JCB find the YieldReport to be an invaluable summary of all debt market activity. Whilst we are focussed on the highest grade bonds it is important to see what is..Angus Coote, Executive Director, JCB Active Bond Fund
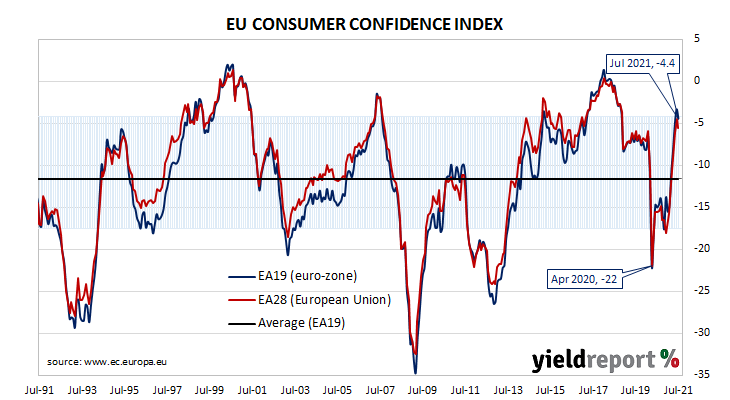
Summary: Euro-zone households less optimistic in July; index falls 1.1 points to -4.4; still at elevated level; euro-zone sovereign bond yields lower.
EU consumer confidence plunged during the GFC and again in 2011/12 during the European debt crisis. After bouncing back through 2013 and 2014, it fell back significantly in late 2018 but only to a level which corresponds to significant optimism among households. Following the plunge which took place in April 2020, a recovery began a month later, with household confidence returning to above-average levels in March 2021.
Consumer confidence deteriorated in July according to the latest survey conducted by the European Commission. Its Consumer Confidence index recorded a reading of -4.4, a level which could be still considered as elevated. The reading was below the -3.0 which had been generally expected and less than June’s figure of -3.3. The average reading since the beginning of 1985 is -11.6.
The report was released on the same day as the ECB’s July policy meeting where policy rates and asset purchase programmes were left unchanged. Sovereign bond yields fell in major euro-zone bond markets on the day and by the end of it, German and French 10-year bond yields had each shed 4bps to -0.43% and -0.09% respectively.
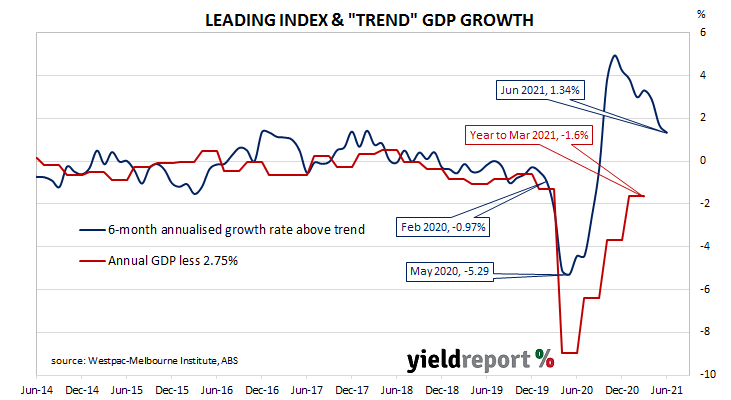
Summary: Leading index growth rate falls again in June; at level which is “more subdued but still strong”; reading implies annual GDP growth to rise to around 4.0% during third, fourth quarters; Westpac slashes September quarter GDP forecast from 0.9% to -0.7%.
Westpac and the Melbourne Institute describe their Leading Index as a composite measure which attempts to estimate the likely pace of Australian economic growth over the next three to six months. After reaching a peak in early 2018, the index trended lower through 2018 and 2019 before plunging to recessionary levels in the second quarter of 2020. Subsequent readings have been markedly higher.
The latest reading of the six month annualised growth rate of the indicator fell in June, from May’s revised figure of +1.68% to +1.34%.
“Over the last six months growth in the Leading Index has slowed from an extremely strong 4.20% to a more subdued, but still strong, 1.34% pace,” said Westpac Chief Economist Bill Evans.
Index figures represent rates relative to “trend” GDP growth, which is generally thought to be around 2.75% per annum. The index is said to lead GDP by three to six months, so theoretically the current reading represents an annual GDP growth rate of around 4.0% in the third or fourth quarters of 2021.
Commonwealth Government bond yields mostly declined on the day, ignoring rises of long-term US Treasury yields overnight. By the end of the day, the 3-year ACGB yield had slipped 1bp to 0.27%, the 10-year yield had lost 2bps to 1.16% while the 20-year yield finished 1bp higher at 1.81%.
Up until recently, Westpac had been expecting an increase of 0.9% in the September quarter. Evans slashed that figure to -0.7% this week, citing extended restrictions in Victoria and New South Wales and additional measures in other states.
Accelerating inflation rate now “top concern” according to UoM July survey
16 July 2021
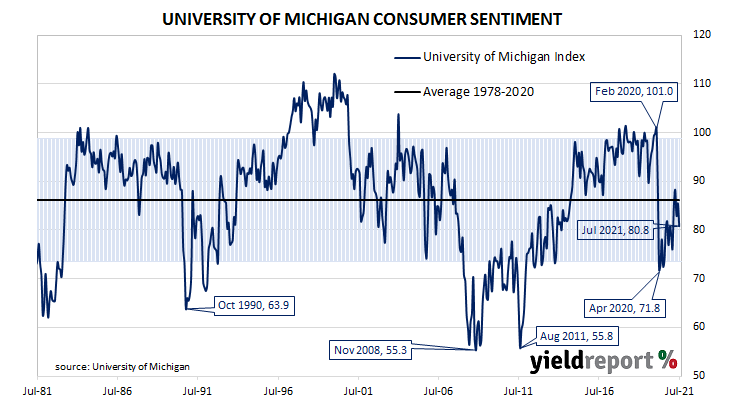
Summary: US consumer confidence deteriorates in July; University of Michigan index below consensus figure; views of present conditions, future conditions both deteriorate; decline caused by underestimating economy’s ability to reactivate supply lines, restore jobs and resultant impact on inflation; respondent complaints regarding rising prices reaches all-time record.
US consumer confidence started 2020 at an elevated level. However, surveys had begun to reflect a growing unease with the global spread of COVID-19 and its reach into the US by March of that year. After a plunge in the following month, household confidence recovered in a haphazard fashion, generally fluctuating at below-average levels.
The latest survey conducted by the University of Michigan indicates the average confidence level of US households deteriorated in July. The University’s preliminary reading of its Index of Consumer Sentiment registered 80.8, below the generally expected figure of 86.5 and lower than June’s final figure of 85.5. Consumers’ views of current conditions and expectations regarding future conditions both deteriorated in comparison to those held at the time of the June survey.
“This decline was caused by a misjudgement by consumers in the pace that the economy would recover as the pandemic eased. This involved both underestimating the economy’s ability to reactivate supply lines and restore jobs and the resulting impact on inflation,” said the University’s Surveys of Consumers chief economist, Richard Curtin.
The report was released on the same day as the June retail sales report and US Treasury bond yields hardly moved on the day. By the end of it, the 2-year Treasury yields remained unchanged at 0.23%, the 10-year yield had slipped 1bp to 1.29% while the 30-year yield finished unchanged at 1.92%.
Curtin noted “complaints about rising prices on homes, vehicles and household durables has reached an all-time record” and the “accelerating inflation rate has now become a top concern” among lower-income and middle-income households. He said an important question was whether consumers will hold on to their savings as a “precautionary hedge” or spend in advance of higher prices. He forecast the precautionary strategy would “quickly fade if the ‘transitory’ spike in inflation extended into 2022.”
Consumers’ expectations of the inflation rate over the next 12 months increased from 4.2% in June to 4.8%.
More-confident households are generally inclined to spend more and save less; some increase in household spending could be expected to follow. As private consumption expenditures account for a majority of GDP in advanced economies, a higher rate of household spending growth would flow through to higher GDP growth if other GDP components did not compensate.
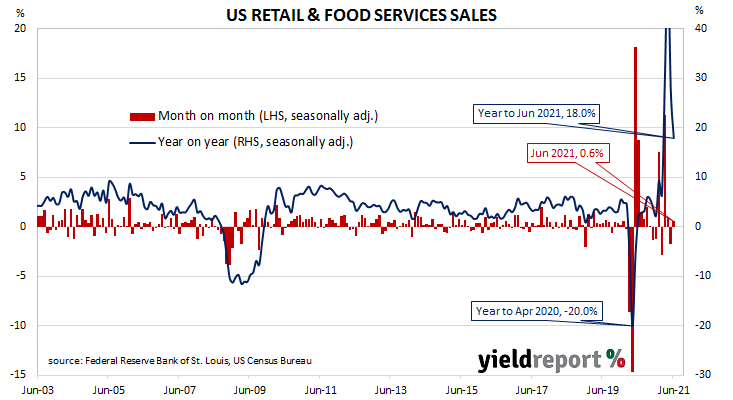
Summary: US retail sales rise by 0.6% in June; rise in contrast to -0.5% expected; sales volatile so far in 2021 but “strong overall”; report alleviates concerns US consumers may turn cautious; rises in majority of retail categories; “vehicles and parts” the largest single influence, falls 2%.
US retail sales had been trending up since late 2015 but, commencing in late 2018, a series of weak or negative monthly results led to a drop-off in the annual growth rate below 2.0% by the end of that year. Growth rates then increased in trend terms through 2019 and into early 2020 until pandemic restrictions sent it into negative territory. A “v-shaped” recovery then took place which was followed by some short-term spikes as federal stimulus payments hit US households in early 2021.
According to the latest “advance” sales numbers released by the US Census Bureau, total retail sales increased by 0.6% in June. The rise was in contrast to the 0.5% decline which had been generally expected and May’s 1.7% fall after it was revised down from -1.3%. On an annual basis, the growth rate slowed from May’s revised figure of 27.6% to 18.6% as the pandemic-induced reduction in spending during the June 2020 quarter continued falling out of the calculations.
“Retail sales have been volatile this year due to the impact of government stimulus payouts but have been strong overall,” said Westpac senior economist Lochlan Halloway.
The report was released on the same day as the University of Michigan’s July consumer confidence report and US Treasury bond yields hardly moved on the day. By the end of it, the 2-year Treasury yields remained unchanged at 0.23%, the 10-year yield had slipped 1bp to 1.29% while the 30-year yield finished unchanged at 1.92%.
NAB currency strategist Rodrigo Catril said, ”[T]he overall strength of the report alleviated concern the cashed-up US consumer with $2.5 trillion of savings may turn cautious as we have seen in other economies.” However, he also pointed out “some commentators also noted how the figures were flattered by higher inflation.”
The majority of categories recorded higher sales over the month. However, the “Motor vehicle & parts dealers” segment provided the largest single influence on the overall result, falling by 2.0% for the month while still remaining 19.5% higher for the year. Sales at food and drinking places, general merchandise stores and petrol (“gasoline”) stations also had significant influences on the total, each rising by 2.3%, 1.9% and 2.5% respectively.
US manufacturing “disappoints” as industrial production misses in June
15 July 2021
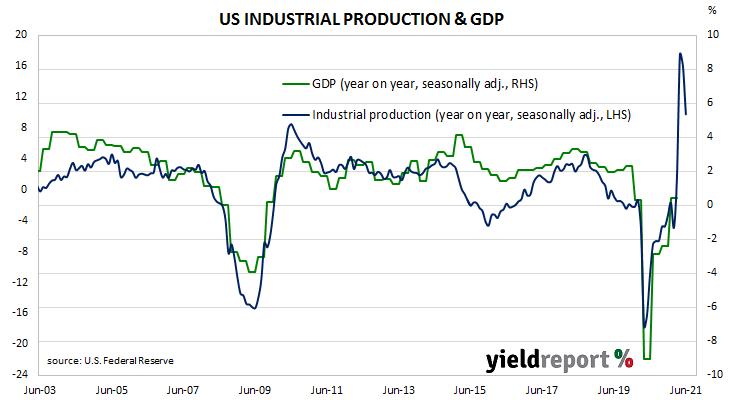
Summary: US industrial output expands by 0.6% in June, up 9.8% over 12 months; rise less than expected; May figure revised down slightly; utility output & mining up, manufacturing “disappoints; capacity utilisation rate rises, still short of February 2020 figure.
The Federal Reserve’s industrial production (IP) index measures real output from manufacturing, mining, electricity and gas company facilities located in the United States. These sectors are thought to be sensitive to consumer demand and so some leading indicators of GDP use industrial production figures as a component. US production collapsed through March and April of 2020 but then began recovering in subsequent months.
According to the Federal Reserve, US industrial production expanded by 0.4% on a seasonally adjusted basis in June. The result was less than the 0.6% increase which had been generally expected and less than May’s 0.7% expansion after it was revised down from 0.8%. On an annual basis, the expansion rate slowed from May’s revised figure of 16.1% to 9.8%.
Longer-term US Treasury bond yields fell on the day as Fed chief Jerome Powell continued his congressional testimony, this time to a senate committee. By the end of the day, the 10-year Treasury yield has lost 4bps to 1.30% and the 30-year yield had shed 5bps to 1.92%. The 2-year yield finished 1bp higher at 0.25%.
Westpac economist Lochlan Halloway pointed out that while utility output and mining rose, the manufacturing sector “disappointed, with a 0.1% drop after downward revisions, with vehicle sector weakness noted.”
The same report includes US capacity utilisation figures which are generally accepted as an indicator of future investment expenditure and/or inflationary pressures. Capacity usage had hit a high for the last business cycle in early 2019 before it began a downtrend which ended with April 2020’s multi-decade low of 64.2%. June’s reading rose from May’s revised figure of 75.1% to 75.4%, still short of February 2020’s 76.3%.
“Raft of price rises” continues, US PPI up 1% in June
14 July 2021
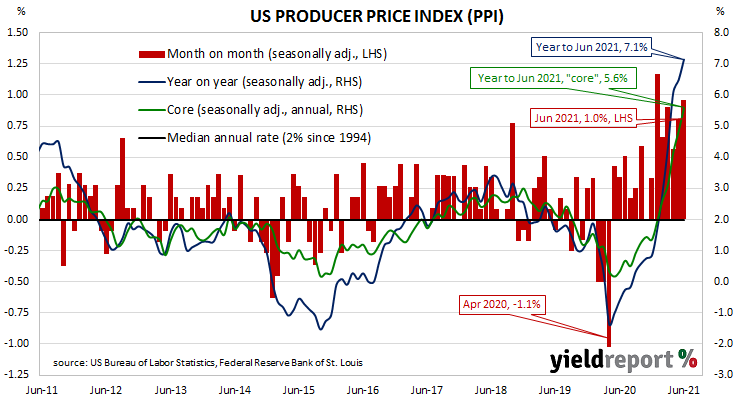
Summary: Prices received by producers rise by 1.0% in June; double expected figure; annual rate moves above 7%; “core” PPI also increases by 1.0%; “current raft of price rises is transitory repeatedly made clear” by Fed; services prices up 0.8%, goods up 1.2%.
Around the end of 2018, the annual inflation rate of the US producer price index (PPI) began a downtrend which continued through 2019. Months in which producer prices increased suggested the trend may have been coming to an end, only for it to continue, culminating in a plunge in April 2020. Figures returned to “normal” towards the end of that year and annual rates are now well above average.
The latest figures published by the Bureau of Labor Statistics indicate producer prices rose by 1.0% after seasonal adjustments in June. The increase was double the 0.5% rise that had been generally expected and more than May’s 0.8% rise. On a 12-month basis, the rate of producer price inflation after seasonal adjustments increased from 6.5% to 7.1%.
PPI inflation excluding foods and energy, or “core” PPI inflation, also rose by 1.0%, up from the 0.7% increases which occurred in April and May. The annual rate accelerated again, this time from 4.8% to 5.6%.
Despite the larger than expected increases, US Treasury bond yields fell noticeably on the day following “dovish” testimony from Fed chief Jerome Powell to a Congressional committee. By the end of the day, the 2-year Treasury yield had lost 4bps to 0.22% while 10-year and 30-year yields each finished 8bps lower at 1.34% and 1.97% respectively.
ANZ economist John Bromhead noted the Fed “has repeatedly made it clear that it thinks the current raft of price rises is transitory, resulting from temporary supply-chain issues and the reopening of the economy. For now, this is limiting the market impact of these strong data prints.”
The BLS stated higher prices for final demand services accounted for 60% of the month’s increase after they rose by 0.8% on average. Prices of final demand goods rose by 1.2%.
The producer price index (PPI) is a measure of prices received by producers for domestically produced goods, services and construction. It is put together in a fashion similar to the consumer price index (CPI) except it measures prices received from the producer’s perspective rather than from the perspective of a retailer or a consumer. It is another one of the various measures of inflation tracked by the US Fed, along with core personal consumption expenditure (PCE) price data.
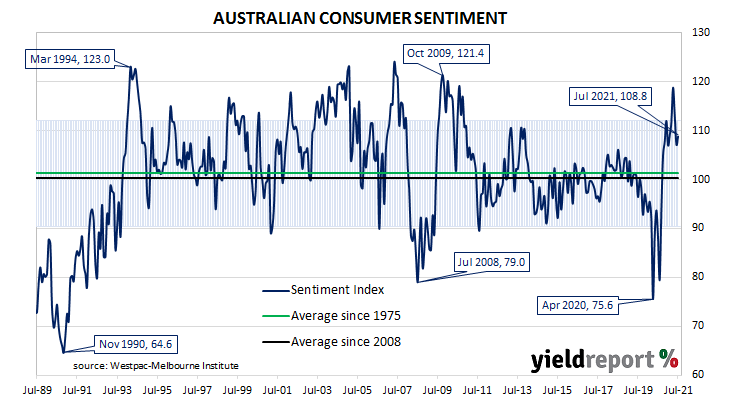
Summary: Household sentiment firms in July; holds up despite NSW fall as Vic, WA bounce back; still well above long-term average; four of five sub-indices higher; unemployment index slightly higher again; NSW concerns not spreading to other states so far.
After a lengthy divergence between measures of consumer sentiment and business confidence in Australia which began in 2014, confidence readings of the two sectors converged again around July 2018. Both readings then deteriorated gradually in trend terms, with consumer confidence leading the way. Household sentiment fell off a cliff in April 2020 but, after a few months of to-ing and fro-ing, it then staged a full recovery.
According to the latest Westpac-Melbourne Institute survey conducted in early July, household sentiment firmed after softening through May and June. The Consumer Sentiment Index increased from June’s reading of 107.2 to 108.8.
“Confidence has held up overall despite a sharp fall in New South Wales as other states, notably Victoria and Western Australia, recorded strong bounce-backs from COVID-related disruptions in June,” said Westpac chief economist Bill Evans. He noted the survey was held in the week in which Sydney residents were facing “stay at home” restrictions but before those restrictions were extended on 9 July.
Any reading of the Consumer Sentiment Index above 100 indicates the number of consumers who are optimistic is greater than the number of consumers who are pessimistic. The latest figure is still well above the long-term average reading of just over 101.
Domestic Treasury bond yields increased modestly on the day, largely in line with overnight movements in US Treasury bond yields. By the close of business, the 2-year ACGB yield had crept up 1bp to 0.35% while 10-year and 20-year yields each finished 2bps higher at 1.35% and 1.93% respectively.
In the cash futures market, expectations of a change in the actual cash rate, currently at 0.03%, remained largely unchanged. At the end of the day, contract prices implied the cash rate would rise slowly, reaching 0.22% by October 2022.
Euro-zone output down in May; supply constraints likely through 2021
14 July 2021
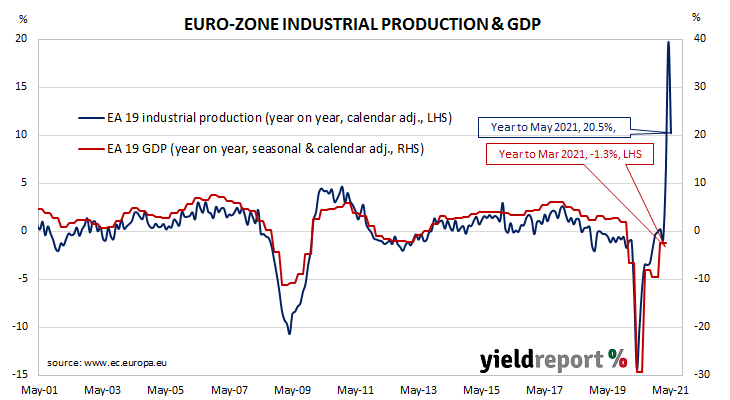
Summary: Euro-zone industrial production down 1% in May; contraction triple expected figure; annual growth rate falls, “base effects” still present; production down in all four of euro-zone’s largest economies; supply constraints likely through 2021.
Following a recession in 2009/2010 and the debt-crisis which flowed from it, euro-zone industrial production recovered and then reached a peak four years later in 2016. Growth rates then fluctuated for two years before beginning a steady and persistent slowdown from the start of 2018. That decline was transformed into a plunge in March and April of 2020. However, subsequent months in 2020 and early 2021 produced an almost-complete recovery.
According to the latest figures released by Eurostat, euro-zone industrial production contracted by 1.0% in May on a seasonally-adjusted and calendar-adjusted basis. The fall was triple the 0.3% decrease which had been generally expected and in contrast to April’s 0.6% increase after revisions. On an annual basis, the calendar-adjusted growth rate slowed from April’s revised rate of 39.4% to 20.5%. (Monthly production figures collapsed during the June quarter of 2020, resulting in significantly lower bases for annual calculations. i.e. “base effects”.)
German and French 10-year sovereign bond yields moved lower on the day. By the close of business, The German 10-year bund yield had shed 3bps to -0.32% and the French 10-year OAT yield had lost 2bps to 0.02%.
ANZ economist John Bromhead noted all industrial production categories decreased with the exception of durable goods. He expects an ongoing drag from supply constraints which “are likely to continue to weigh on industrial production until at least the end of the year.”
Industrial production growth contracted in all four of the euro-zone’s four largest economies. Germany’s production contracted by 0.6% while the comparable figures for France, Italy and Spain were -0.3%, -1.5% and -0.8% respectively.
Summary: US CPI jumps by 0.9% in June; nearly double expectations; “core” rate up 0.9%, double expected figure; “mostly transitory” given used-car contribution; rises in categories tied to reopening and temporary supply shortages may give Fed “more confidence” higher inflation rate temporary.
The annual rate of US inflation as measured by changes in the consumer price index (CPI) halved from nearly 3% in the period from July 2018 to February 2019. It then fluctuated in a range from 1.5% to 2.0% through 2019 before rising above 2.0% in the final months of that year. Substantially lower rates were reported from March 2020 to May 2020 and they remained below 2% until March of this year.
The latest CPI figures released by the Bureau of Labor Statistics indicated seasonally-adjusted consumer prices jumped by 0.9% on average in June. The result was nearly double the 0.5% increase which had been generally expected and greater than May’s 0.6% rise. On a 12-month basis, the inflation rate accelerated from May’s seasonally adjusted reading of 4.9% to 5.3%.
“Headline” inflation is known to be volatile and so references are often made to “core” inflation for analytical purposes. Core inflation, a measure of inflation which strips out the volatile food and energy components of the index, also jumped by 0.9% on a seasonally-adjusted basis for the month. The result was more than double the expected figure of 0.4% and more than May’s 0.7% increase. The annual rate accelerated again, this time from 3.8% to 4.5%.
“The key question for the Fed and markets in general is whether the sustained lift in inflation seen over the past couple of months is still likely to be transitory, or will it be more persistent, warranting an earlier normalisation in Fed policy,” said NAB senior economist Tapas Strickland. In his view, “the rise is mostly transitory” given used-car prices contributed over 0.4% to the increase of the core measure.
US Treasury bond yields rose on the day. By the close of business, the 2-year yield had added 3bps to 0.26%, the 10-year yield had gained 6bps to 1.42% while the 30-year yield finished 5bps higher at 2.05%.
In terms of US Fed policy, expectations of any change in the federal funds range over the next 12 months remained fairly soft. July 2022 futures contracts implied an effective federal funds rate of 0.17%, 7bps above the spot rate.
NAB business indices fall, “solid” June quarter still anticipated
13 July 2021
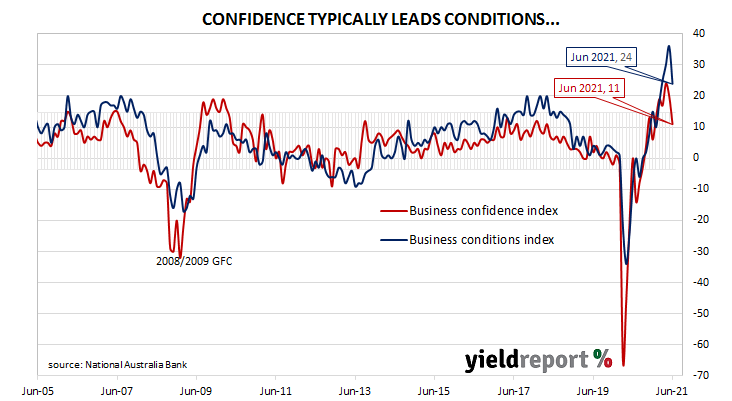
Summary: Business conditions deteriorate in June, still elevated; confidence subsides; points to “solid outcome” in June quarter; Australian economy has “considerable momentum”; survey conducted in period with more coronavirus cases, additional restrictions; business conditions will likely deteriorate further in July; economy has “considerable momentum”; capacity utilisation rate declines; all sectors of economy still at/above respective long-run averages;
NAB’s business survey indicated Australian business conditions were robust in the first half of 2018, with a cyclical-peak reached in April of that year. Readings from NAB’s index then began to slip, declining to below-average levels by the end of 2018. Forecasts of a slowdown in the domestic economy began to emerge in the first half of 2019 and the index trended lower, hitting a nadir in April 2020 as pandemic restrictions were introduced. Conditions improved markedly over the next twelve months.
According to NAB’s latest monthly business survey of over 400 firms conducted over the second half of June, business conditions deteriorated, albeit to a level which is still elevated. NAB’s conditions index registered 24, down from May’s revised reading of 36.
Business confidence subsided although it remained at an above-average level. NAB’s confidence index dropped from May’s reading of 20 to 11. Typically, NAB’s confidence index leads the conditions index by approximately one month, although some divergences have appeared in the past from time to time.
“Overall, the survey points to a solid outcome in the June quarter for economic activity and continues to reflect the support of both fiscal and monetary policy,” said NAB senior economist Gareth Spence.
Long-term Commonwealth Government bond yields rose a touch on the day. By the end of the day, 10-year and 20-year ACGB yields had each crept up 1bp to 1.33% and 1.91% respectively. The 2-year yield finished unchanged at 0.35%.
In the cash futures market, expectations of a change in the actual cash rate, currently at 0.03%, remained largely unchanged. At the end of the day, contract prices implied the cash rate would creep up to around 0.19% by October 2022.