News

US quit rate still elevated after May decline

07 July 2021

Summary: US quit rate falls back in May after hitting new high in April; quit rate “still elevated”; job openings up, separations down; “job matching” issues still evident.


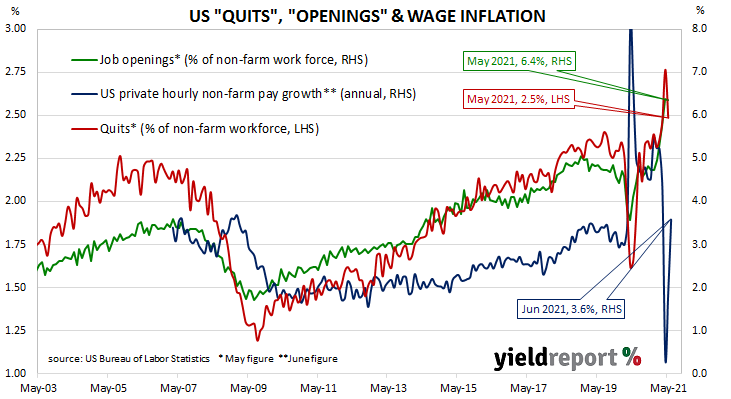
The number of US employees who quit their jobs as a percentage of total employment increased slowly but steadily after the GFC. It peaked in March 2019 and then tracked sideways until virus containment measures were introduced in March 2020. The quit rate plummeted as alternative employment opportunities rapidly dried up but then recovered back to its pre-pandemic rate in the third quarter of 2020.

Figures released as part of the most recent JOLTS report show the quit rate fell back in May after it hit a new series high in April. 2.5% of the non-farm workforce left their jobs voluntarily, down from April’s 2.8% after it was revised up from 2.7%. There were 388,000 fewer quits but 533,000 more people employed in the non-farm sector in May.

ANZ economist Daniel Been described the 2.5% quit rate as “still elevated” and said people “with jobs are continuing to take advantage of the strong labour demand conditions to improve their position.”

Long-term US Treasury bond yields decreased moderately on the day. By the close of business, the 10-year Treasury yield had shed 3bps to 1.32% and the 30-year yield had lost 4bps to 1.94%. The 2-year yield finished unchanged at 0.22%.

The fall was led by 181,000 fewer quits in the “Professional and business services” sector while the “Accommodation and food services” sector experienced the greatest increase. Overall, the total number of quits for the month fell from April’s revised figure of 3.992 million to 3.604 million.

Total vacancies at the end of May increased by 16,000, or 0.2%, from April’s revised figure of 9.193 million to 9.209 million, driven by a 109,000 rise in the “Other services” sector, an 89,000 increase in the “Accommodation and food services” sector and 81,000 more openings in the “Healthcare/social services” sector. 100,000 fewer openings in the “Professional and business services” sector and 80,000 fewer openings in the “Arts, entertainment and recreation” sector provided the two largest offsets. Overall, 7 out of 18 sectors experienced more job openings than in the previous month.

Total separations decreased by 485,000, or 8.4%, from April’s revised figure of 5.803 million to 5.318 million. The fall was led by the “Professional and business services” sector, where there were 192,000 fewer separations than in April. Separations decreased in 13 out of 18 sectors.

“More improvement to come” after June job ads report

05 July 2021

Summary:  Job ads up 3.0% in June; ads 129.1% higher than same month in 2020; “more improvement to come”; recent lockdowns to “limit” jobs market improvements in June, July; workers typically reinstated once restrictions lift.


From mid-2017 onwards, year-on-year growth rates in the total number of Australian job advertisements consistently exceeded 10%. That was until mid-2018 when the annual growth rate fell back markedly. 2019 was notable for its reduced employment advertising and this trend continued into the first quarter of 2020. Figures plunged in April and May of 2020 as pandemic restrictions took effect but then recovered relatively quickly.

According to the latest ANZ figures, total advertisements increased by 3.0% in June on a seasonally-adjusted basis. The rise followed a 6.8% increase in May and a 4.7% gain in April after revisions. On a 12-month basis, total job advertisements were 129.1% higher than in June 2020, down from May’s comparable figure of 246.5%.

“The 3.0% rise in ANZ Job Ads in June suggests there is more improvement to come in the near term, despite lockdowns,” said ANZ senior economist Catherine Birch.

The figures were released on the same day as the Melbourne Institute’s latest reading of its Inflation Gauge and Commonwealth Government bond yields fell on the day. By the close of business, the 3-year ACGB yield had slipped 1bp to 0.42%, the 10-year yield had shed 5bps to 1.44% while the 20-year yield finished 1bps lower at 2.04%.

Birch expects recent lockdowns in various states to “limit further labour market improvements in June and July” but only temporarily “as long as restrictions ease as planned and states avoid extended lockdowns.” She said history suggests “workers are reinstated once restrictions lift, given the underlying strength in the labour market and overall demand.”

The inverse relationship between job advertisements and the unemployment rate has been quite strong (see below chart), although ANZ themselves called the relationship between the two series into question in early 2019.  A rising number of job advertisements as a proportion of the labour force is suggestive of lower unemployment rates in the near-future. A falling ratio suggests higher unemployment rates will follow.

Spike likely for June quarter CPI

05 July 2021

Summary: Melbourne Institute inflation rate rises in June; annual rate at 3 per cent, bolstered by July 2020 rebound; implies June quarter reading of 2.9% annual rate.


Despite the RBA’s desire for a higher inflation rate, ostensibly to combat recessions, attempts to accelerate inflation through record-low interest rates have failed to date. The RBA’s stated objective is to achieve an inflation rate of between 2% and 3%, “on average, over time.” Australia’s inflation rate has been trending lower and lower since the GFC and the “coronavirus recession” then crushed it in the June quarter of 2020.

The Melbourne Institute’s latest reading of its Inflation Gauge index increased by 0.4% in June, following a 0.2% fall in May and a 0.4% increase in April. On an annual basis, the index rose by 3.0%, slowing from May’s comparable figure of 3.3%. However, a 0.9% rise in July 2020 accounts for nearly one third of the annual increase.

The figures were released on the same day as ANZ’s latest Job Ads report and Commonwealth Government bond yields fell on the day. By the close of business, the 3-year ACGB yield had slipped 1bp to 0.42%, the 10-year yield had shed 5bps to 1.44% while the 20-year yield finished 1bps lower at 2.04%.

The Melbourne Institute’s Inflation Gauge is an attempt to replicate the ABS consumer price index (CPI) on a monthly basis. It has turned out to be a reliable leading indicator of the CPI, although there are periods in which the Inflation Gauge and the CPI have diverged for as long as twelve months. On average, the Inflation Gauge’s annual rate tends to overestimate the ABS headline rate by around 0.1% on average.

Given the Inflation Gauge’s tendency to overestimate, the latest figures imply an official CPI reading of 0.1% (seasonally adjusted) for the June quarter or 2.9% in annual terms. However, it is worth noting the annual CPI rate to the end of March 2019 was 1.3% when the Inflation Gauge had implied a 2.0% annual rate.

Home approvals continue falling in May as HomeBuilder effect unwinds

05 July 2021

Summary: Home approval numbers fall 7.1% in May; slightly better than expected figure; approvals falling but “still far above pre-pandemic levels”; “clearer signs” unwinding of HomeBuilder “starting to come through; house approvals down, apartment approvals up; non-residential approvals up 28.5% over month, up 36.4% over year.


Approvals for dwellings, that is apartments and houses, had been heading south since mid-2018. As an indicator of investor confidence, falling approvals had presented a worrying signal, not just for the building sector but for the overall economy. However, approval figures from late-2019 and the early months of 2020 painted a picture of a recovery taking place, even as late as April of that year. Subsequent months’ figures then trended sharply upwards.

The Australian Bureau of Statistics has released the latest figures from May and total residential approvals fell by 7.1% on a seasonally-adjusted basis. The drop over the month was greater than the 5.0% fall which had been generally expected and larger than April’s 5.7% fall after revisions. Total approvals increased by 52.7% on an annual basis, an acceleration from the previous month’s revised figure of 42.4%. Monthly growth rates are often volatile.

“Building approvals may be falling, but they are still far above pre-pandemic levels,” said ANZ economist Adelaide Timbrell.

The figures were released on the same day as ANZ’s latest Job Ads report and the Melbourne Institute’s June reading of its Inflation Gauge. Commonwealth Government bond yields fell on the day and, by the close of business, the 3-year ACGB yield had slipped 1bp to 0.42%, the 10-year yield had shed 5bps to 1.44% while the 20-year yield finished 1bps lower at 2.04%.

Westpac senior economist Matthew Hassan said there are “clearer signs” an unwinding of the Federal HomeBuilder scheme “is starting to come through.” He expects “more steep declines…as the unwind continues in coming months.”

Approvals for new houses decreased by 10.3 over the month after rising by 5.0% in April after revisions. On a 12-month basis, house approvals were 53.6% higher than they were in May 2020, down from April’s comparable figure of 69.4%.

“Nothing” to make Fed hawkish in June payrolls report

02 July 2021

Summary: Non-farm payrolls increase by 850K in June; more than expected; previous two months’ figures revised up by 15K; jobless rate up, participation rate steady; 40% of gain from leisure/hospitality; total employment still 6.8 million below February 2020; “nothing” for Fed to become hawkish about; jobs-to-population ratio steady at 58%; underutilisation rate falls below 10%; annual hourly pay growth increases to 3.6%.


The US economy ceased producing jobs in net terms as infection controls began to be implemented in March 2020. The unemployment rate had been around 3.5% but that changed as job losses began to surge through March and April of 2020. The May 2020 non-farm employment report represented a turning point and subsequent months provided substantial employment gains. Changes in recent months have been generally more modest but still well above the long-term monthly average.

According to the US Bureau of Labor Statistics, the US economy created an additional 850,000 jobs in the non-farm sector in June. The increase was above the 700,000 which had been generally expected earlier in the week and greater than the 683,000 jobs which had been added in May after revisions. Employment figures for April and May were revised up by a total of 15,000.

The unemployment rate rose from May’s rate of 5.8% to 5.9%. The total number of unemployed increased by 168,000 to 9.484 million while the total number of people who are either employed or looking for work increased by 150,000 to 161.086 million. Despite a higher number of people in the labour force, the participation rate remained unchanged from May’s rate of 61.6%.

“While headline payrolls did beat expectations by a considerable way, the unemployment rate rose and 40% of jobs gains was led by the leisure and hospitality industry,” said NAB senior economist NAB Tapas Strickland.


US Treasury yields fell modestly on the day. By the close of business, the 2-year bond yield had lost 2bps to 0.24% while 10-year and 30-year yields each finished 3bps lower at 1.43% and 2.04% respectively.

“Overall the level of payrolls is still 6.8 million below pre-pandemic February 2020 levels and is still below the level of substantial progress needed by the Fed. As such there is nothing in this report for the Fed to become hawkish about,” Strickland concluded.

May home loan approvals “consistent with continued strong momentum”

02 July 2021

Summary: Number of home loan approvals increase by 0.8% in May; “consistent with continued strong momentum in housing markets”; value of loan commitments up by 1.9%; pace over past 3 months points to further acceleration over the second half.


A very clear downtrend was evident in the monthly figures of both the number and value of home loan commitments through late-2017 to mid-2019. Then the RBA reduced its cash rate target in a series of cuts and both the number and value of mortgage approvals began to noticeably increase. Figures from February through to May of 2020 provided an indication the trend had finished but subsequent figures pushed the annual rate of increases back into positive territory and then on elevated levels.

May’s housing finance figures have now been released and the total number of loan commitments (excluding refinancing loans) to owner-occupiers increased by 0.8%. The rise came after a 0.6% fall in April after revisions and, on an annual basis, the rate of growth increased from April’s figure of 59.0% to 76.8%.

“Overall the picture is consistent with continued strong momentum in housing markets and an expected switch towards investor-led gains,” said Westpac senior economist Matthew Hassan.

Commonwealth bond yields fell on the day, especially at the ultra-long end. By the close of business, 3-year and 10-year ACGB yield had each slipped 1bp to 0.43% and 1.49% respectively while the 20-year yield finished 7bps lower at 2.05%.

In dollar terms, total loan approvals excluding refinancing increased by 4.9% over the month, a larger increase than April’s 3.7% increase. On a year-on-year basis, total approvals excluding refinancing increased by 95.4%, an acceleration from the previous month’s comparable figure of 68.2%.

The total value of owner-occupier loan commitments excluding refinancing increased by 1.9%, down from April’s figure of 4.3%. On an annual basis, owner-occupier loan commitments were 88.4% higher than in May 2020, whereas April’s annual growth figure was 70.1%.

ISM says US continues strong growth in June

01 July 2021

Summary: ISM purchasing managers index (PMI) slightly lower; below consensus expectation; indicates “strong sector expansion and U.S. economic growth”; supply squeeze may have peaked; implies US economy still growing at rapid pace.


US purchasing managers’ index (PMI) readings reached a cyclical peak in September 2017.  They then started a downtrend which ended in March 2020 with a contraction in US manufacturing which lasted until June 2020. Subsequent month’s readings implied growth had resumed before becoming stronger through the early months of 2021.

According to the latest Institute of Supply Management (ISM) survey, its Purchasing Managers Index recorded a reading of 60.6% in June. The result was slightly below the generally expected figure of 61.0% and slightly lower than May’s reading of 61.2%. The average reading since 1948 is 52.9% and any reading above 50% implies an expansion in the US manufacturing sector relative to the previous month.

The ISM’s Timothy Fiore said, “The Manufacturing PMI continued to indicate strong sector expansion and U.S. economic growth in June.”

Longer-term US Treasury bond yields declined modestly on the day. By the close of business, the 10-year Treasury bond yield had slipped 1bp to 1.46% and the 30-year yield had shed 2bps to 2.07%. The 2-year yield finished 1bp higher at 0.26%.

NAB currency strategist Rodrigo Catril described US manufacturing as being at a “very robust level” while noting supplier delivery times had eased, “hinting at the idea that maybe the US has reached a peak in the supply bottle neck squeeze…” However, he also said the current supply situation is “still a long way from normal.”

Purchasing managers’ indices (PMIs) are economic indicators derived from monthly surveys of executives in private-sector companies. They are diffusion indices, which means a reading of 50% represents no change from the previous period, while a reading under 50% implies respondents reported a deterioration on average. According to the ISM, a reading “above 42.8%, over a period of time, generally indicates an expansion of the overall economy.”

Manufacturing PMI figures appear to lead US GDP by several months despite a considerable error in any given month. The chart below shows US GDP on a “year on year” basis (and not the BEA annualised basis) against US GDP implied by monthly PMI figures.

“Another sign” service sector “rebounding quickly” from ADP June report

30 June 2021

Summary: ADP payrolls up by 692K in June; more than consensus figure; May increase revised down by 92K; “another sign” activity, employment in service sector “rebounding quickly”; led again by leisure/hospitality sector; figures up equally across firms of all sizes; 90% of gain in services sector.


The ADP National Employment Report is a monthly report which provides an estimate of US non-farm employment in the private sector. Since publishing of the report began in 2006, its employment figures have exhibited a high correlation with official non-farm payroll figures, although a large difference can arise in any individual month.

The latest ADP report indicated private sector employment increased by 692,000 in June, more than the 530,000 which had been generally expected. May’s increase was revised down by 92,000 to 886,000.

ANZ economist Rahul Khare said the figures from the report provided “another sign that activity and employment in the service sector is rebounding quickly.”  However, he also noted “the ADP data has not been a particularly good predictor of non-farm payrolls during the pandemic…”

US Treasury yields barely moved on the day. By the close of business, the 2-year Treasury bond yield remained unchanged at 0.25%, the 10-year yield had slipped 1bp to 1.47% and the 30-year yield finished unchanged at 2.09%.

In terms of US Fed policy, expectations of any change in the federal funds rate over the next 12 months remained soft. Federal funds futures contracts for June 2022 implied an effective federal funds rate of 0.15%, 5bps above the current spot rate.

Employment numbers in net terms increased across businesses of all sizes, with gains fairly evenly distributed for a fourth consecutive month. Firms with less than 50 employees filled a net 215,000 positions, mid-sized firms (50-499 employees) gained 236,000 positions while large businesses (500 or more employees) accounted for 240,000 additional employees.

Credit growth picks up in May; further increases expected

30 June 2021

Summary: Private sector credit grows at 0.4% in May; above expected figure; annual growth rate rises from 1.4% to 1.9%; further increases expected on housing loan data, higher business confidence; housing credit growth continues, business loans up, personal loans up.


The pace of lending to the non-bank private sector by financial institutions in Australia has been trending down since late-2015. Private sector credit growth appeared to have stabilised in the September quarter of 2018 but the annual growth rate then continued to deteriorate through to the end of 2019. The early months of 2020 provided some positive signs but they disappeared in April 2020.

According to the latest RBA figures, private sector credit growth accelerated In May, rising by 0.4%. The result was above the generally expected figure of 0.3% and faster than April’s 0.3% increase after revisions. On an annual basis, the growth rate increased from 1.3% in April to 1.9%.

Commonwealth Government bond yields hardly moved on the day. By the close of business, 3-year and 10-year ACGB yields remained unchanged while the 20-year yield finished 1bp higher at 2.11%.

“We expect further increases in credit growth over coming months. Housing loan approvals point to solid increases in both owner-occupier and investor credit growth, while business lending should be supported by stronger confidence and spending intentions, as well as the Government’s tax incentives for investment,” said Morgan Stanley Australia strategist Chris Read.

Owner-occupier loans accounted for about two-thirds of the net growth over the month while investor loans accounted for much of the balance. Business loans and personal debt both grew modestly.

The traditional driver of loan growth rates, the owner-occupier segment, grew by 0.7% over the month, slightly faster than April’s 0.6% increase. The sector’s 12-month growth rate sped up from 6.2% to 6.6%.

Growth rates in the business sector resumed as total business credit expanded by 0.2%, in contrast to April’s 0.3% contraction. The segment’s annual growth rate remained negative, although its contraction rate slowed from April’s 3.0% to 2.0%.

Optimistic US consumers, “very tight labour market”

29 June 2021

Summary: US consumer confidence back to 2018 and 2019 levels; sizable increase in Conference Board index in June; reading more than expected; views of present conditions, short-term outlook improves; June quarter “strengthens”; business conditions, financial prospects to “continue improving”; job indicators at 21-year high, indicative of “very tight labour market”.


After the GFC in 2008/09, US consumer confidence clawed its way back to neutral over a number of years and then went from strength to strength until late 2018. Measures of consumer confidence then oscillated within a fairly narrow band at historically high levels until they plunged in early 2020. Subsequent readings then fluctuated around the long-term average until March this year.

The latest Conference Board survey held during the first three weeks of June indicated US consumer confidence returned to a level last seen in 2018 and 2019. June’s Consumer Confidence Index registered 127.3, well above the median consensus figure of 119.0 and markedly higher than May’s final figure of 120.0.

Consumers’ views of present conditions and their outlook of the near-future both improved. The Present Situation Index rose from 148.7 to 157.7 and the Expectations Index increased from 100.9 to 107.0.

Lynn Franco, a senior director at The Conference Board, said the increase in the Present Situation Index suggested “economic growth has strengthened further” in the June quarter while the improved outlook was a sign “business conditions and their own financial prospects will continue improving in the months ahead.”

US Treasury bond yields eased slightly on the day. By the close of business, the 2-year Treasury bond yield had slipped 1bp to 0.25%, the 10-year remained unchanged at 1.48% while the 30-year yield finished 1bp lower at 2.09%.

In terms of US Fed policy, expectations of any change in the federal funds rate over the next 12 months remained low, although there has been a slight upwards movement over the past month or so. Federal funds futures contracts for June 2022 implied an effective federal funds rate of 0.15%, about 5bps above the current spot rate.

Click for more news