JCB find the YieldReport to be an invaluable summary of all debt market activity. Whilst we are focussed on the highest grade bonds it is important to see what is..Angus Coote, Executive Director, JCB Active Bond Fund
Summary: Euro-zone composite sentiment index up in June; above expectations; readings from major euro-zone economies up except Spain; sovereign bond yields inch up on day; index implies near-5% GDP growth.
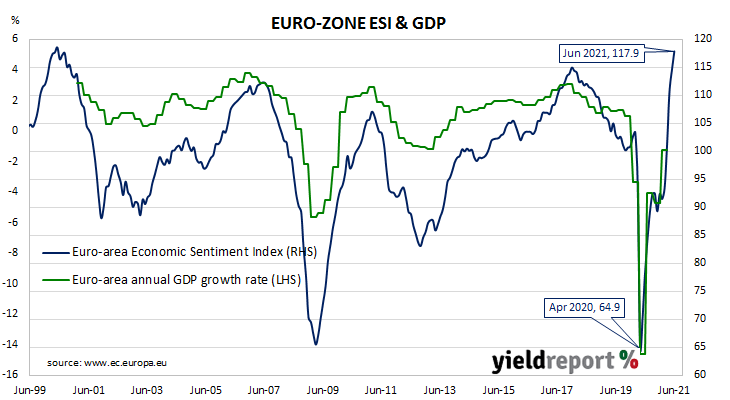
The European Commission’s Economic Sentiment Indicator (ESI) is a composite index comprising five differently-weighted sectoral confidence indicators. It is heavily weighted towards confidence surveys from the business sector, with the consumer confidence sub-index only accounting for 20% of the ESI. However, it has a good relationship with euro-zone GDP, although not as a leading indicator.
The ESI posted a reading of 117.9 in June, above the market’s expected figure of 116.0 and well above May’s reading of 114.5. The average reading since 1985 has been just under 100.
Confidence improved across all five of the industry, retail trade, construction, services and consumer sub-indices. On a geographical basis, the ESI increased in Germany, France and Italy but declined in Spain.
German and French 10-year bond yields finished the day a touch higher. By the close of business, both yields had inched up 1bp to -0.18 and 0.17% respectively.
End-of-quarter ESI readings and annual euro-zone GDP growth rates are highly correlated. This latest reading corresponds to a year-to-June growth rate of 4.9%, up from May’s comparable figure of 4.2%.
Fed inflation projections “a difficult ask” after PCE report
28 June 2021
Summary: US Fed’s favoured inflation measure increased by 0.5% in May; slightly below market expectations; annual rate accelerates further above 3%; Fed inflation projections “a difficult ask”; Treasury bond yields higher.
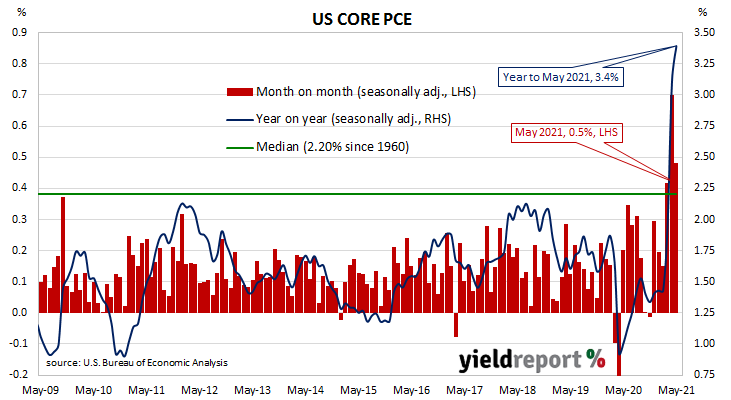
One of the US Fed’s favoured measures of inflation is the change in the core personal consumption expenditures (PCE) price index. After hitting the Fed’s target at the time of 2.0% in mid-2018, the annual rate then hovered in a range between 1.8% and 2.0% before it eased back to a range between 1.5% and 1.8% through 2019. It then plummeted below 1.0% in April 2020 before rising back to around 1.5% in the September quarter of that year.
The latest figures have now been published by the Bureau of Economic Analysis as part of the May personal income and expenditures report. Core PCE prices rose by 0.5% over the month, slightly below the generally expected figure of 0.6% and April’s 0.7% increase. On a 12-month basis, the core PCE inflation rate accelerated from April’s figure of 3.1% to 3.4%.
“For the Fed to meet its inflation projections, the monthly change in PCE inflation needs to fall to 0.18% pretty much immediately. That looks a difficult ask,” said ANZ economist Rahul Khare.
US Treasury bond yields increased on the day. By the close of business, the 2-year Treasury bond yield had inched up 1bp to 0.27%, the 10-year yield had gained 4bps to 1.53% while the 30-year yield finished 5bps higher at 2.15%.
The core version of PCE strips out energy and food components, which are volatile from month to month, in an attempt to identify the prevailing trend. It is not the only measure of inflation used by the Fed; it also tracks the Consumer Price Index (CPI) and the Producer Price Index (PPI) from the Department of Labor. However, it is the one measure which is most often referred to in FOMC minutes.
Summary: ifo business climate index up again in June; above expected figure; expectations, current conditions indices both up; economy “growing strongly at present”; expectations index implies euro-zone GDP growth in September quarter of 3.7%.
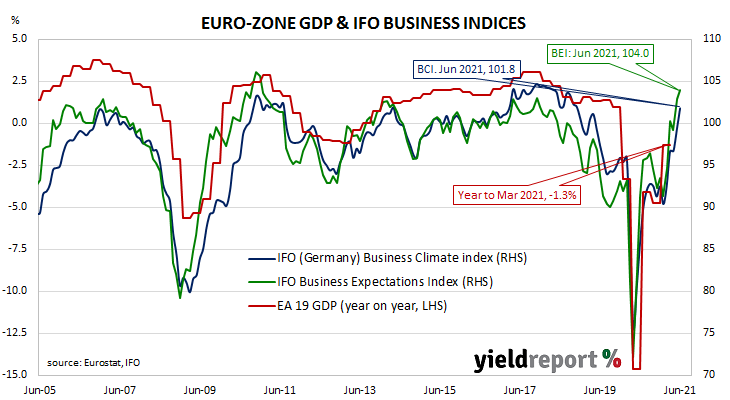
Following a recession in 2009/2010, the ifo Institute’s business climate index largely ignored the European debt-crisis of 2010-2012, remaining at average-to-elevated levels through to early-2020. However, the index was quick to react in the March 2020 survey, falling precipitously. The rebound which began in May of that year was almost as sharp but it was also characterised by a period of below-average readings which lasted until early 2021.
According to the latest figures released by the Institute, its business climate index increased to 101.8 in June. The reading was above the expected reading of 100.4 and 2.6 points above May’s final reading of 99.2. The average reading since January 2005 is just above 97.
“The mood in the German economy has once again improved significantly,” said Clemens Fuest, the president of the ifo Institute. “Optimism about the second half of the year also increased. The German economy is shaking off the corona crisis.”
The expectations index increased, rising from May’s figure of 102.9 to 104.0, also above the generally-expected figure of 103.6. The current situation index rose from 95.7 to 99.6.
German and French 10-year bond yields both declined a touch on the day. By the close of business, they had each slipped 1bp to -0.19% and +0.15% respectively.
ANZ economist Kishti Sen said the figures “reaffirmed the message from the PMI data that the economy is growing strongly at present.”
The ifo Institute’s business climate index is a composite index which combines German companies’ views of current conditions with their outlook for the next six months. It has similarities to consumer sentiment indices in the US such as the ones produced by The Conference Board and the University of Michigan.
Euro household confidence improves, now at elevated level
22 June 2021
Summary: Euro-zone households more optimistic again in June; index registers -3.3; at elevated level; index below consensus expectation but up from May; major euro-zone bond yields almost stable.
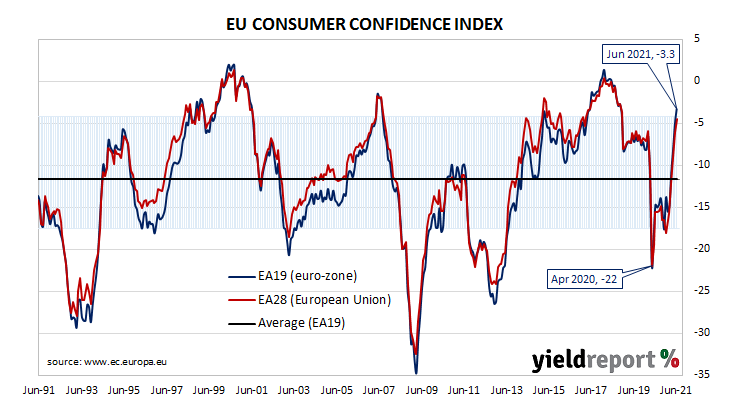
EU consumer confidence plunged during the GFC and again in 2011/12 during the European debt crisis. After bouncing back through 2013 and 2014, it fell back significantly in late 2018 but only to a level which corresponds to significant optimism among households. Following the plunge which took place in April 2020, a recovery began a month later, with household confidence returning to above-average levels in March 2021.
Consumer confidence improved again in June according to the latest survey conducted by the European Commission. Its Consumer Confidence index recorded a reading of -3.3, a level which could be reasonably described as elevated. The reading is below the -3.0 which had been generally expected but above May’s figure of -5.1. The average reading since the beginning of 1985 is -11.6.
Sovereign bond yields remained almost stable in major European bond markets on the day. By the end of it, the German 10-year bond yield remained unchanged at -0.17% while the French 10-year yield had inched up 1bp to 0.17%.
Summary: US leading index up 1.3% in May; above expectations; “strong economic growth will continue”; Conference Board raises 2021 forecast again, from 6.4% to 6.6%.
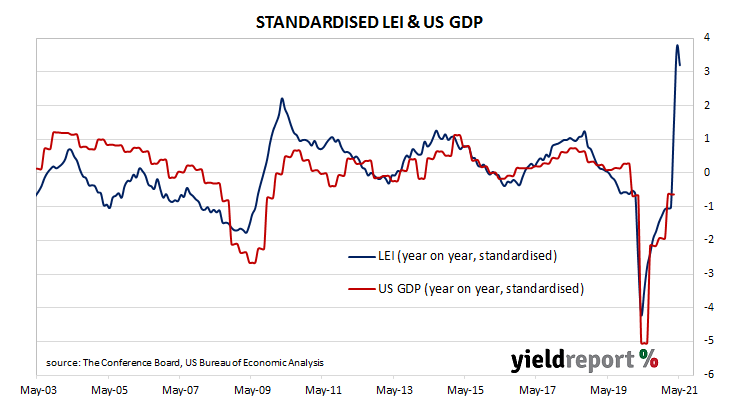
The Conference Board Leading Economic Index (LEI) is a composite index composed of ten sub-indices which are thought to be sensitive to changes in the US economy. The Conference Board describes it as an index which attempts to signal growth peaks and troughs; turning points in the index have historically occurred prior to changes in aggregate economic activity. Readings from March and April of 2020 signalled “a deep US recession” but then subsequent readings indicated the US economy was recovering rapidly.
The latest reading of the LEI indicates it rose by 1.3% in May. The result was above the 1.1% increase which had been generally expected but in line with April’s revised figure. On an annual basis, the LEI growth rate slowed from 16.9% after revisions to 14.9%.
“After another large improvement in May, the US LEI now stands above its previous peak reached in January 2020, suggesting that strong economic growth will continue in the near term,” said Ataman Ozyildirim, Senior Director of Economic Research at The Conference Board.
Changes over time can be large but once they are standardised, a clearer relationship with GDP emerges. The latest reading implies a 6.7% year-on-year growth rate in August, down from July’s 7.2%. The Conference Board forecasts a 6.6% expansion across all of calendar 2021, up from their forecast of 6.4% a month ago.
Zero in the chart above represents the average US GDP growth rate from September 2002, or about 1.8% year on year.
Longer-term US Treasury bond yields ended the day noticeably lower. At the close of business, the 10-year Treasury yield had shed 7bps to 1.51% and the 30-year yield had dropped by 11bps to 2.10%. The 2-year yield crept up 1bp to 0.22%.
Aus. leading index falls back, “more sustainable” growth rates ahead
16 June 2021
Summary: Leading index falls in May; at level signalling “more sustainable above trend growth rate” through 2021 and 2022; reading implies annual GDP growth to rise to around 4.25% during third, fourth quarters; FY 2021 GDP growth expected to be at/above 9.25%.
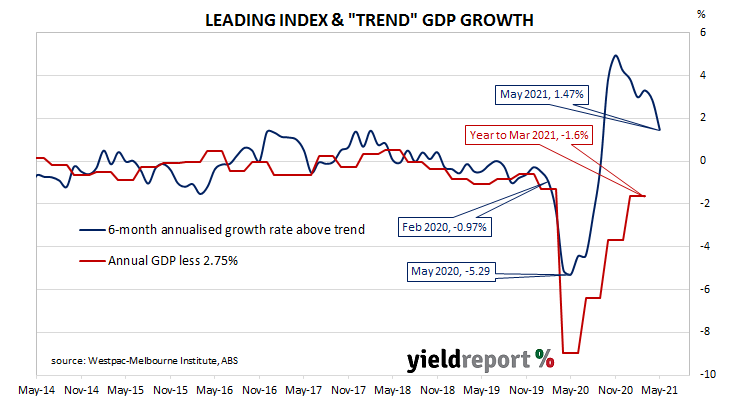
Westpac and the Melbourne Institute describe their Leading Index as a composite measure which attempts to estimate the likely pace of Australian economic growth over the next three to six months. After reaching a peak in early 2018, the index trended lower through 2018 and 2019 before plunging to recessionary levels in the second quarter of 2020. Subsequent readings have been markedly higher.
The latest reading of the six month annualised growth rate of the indicator fell in May, from April’s revised figure of +2.86% to +1.47%.
“The growth rate in the Leading Index has normalised significantly over the last six months to signal a more sustainable above-trend growth rate through the remainder of 2021 and 2022,” said Westpac Chief Economist Bill Evans.
Index figures represent rates relative to “trend” GDP growth, which is generally thought to be around 2.75% per annum. The index is said to lead GDP by three to six months, so theoretically the current reading represents an annual GDP growth rate of around 4.25% in the third or fourth quarters of 2021.
Longer-term Commonwealth Government bond yields rose noticeably on the day, ignoring relatively stable US Treasury yields overnight. By the end of the day, the 10-year ACGB yield had gained 5bps to 1.56% and the 20-year yield had gained 6bps to 2.22%. The 3-year yield finished 1bp higher at 0.34%.
US manufacturing “past peak growth”, “remains very strong”
15 June 2021
Summary: US output expands in May; rise more than expected; April figure revised down considerably; US manufacturing “past peak growth” but “remains very strong”; capacity utilisation rate rises, highest since February 2020.
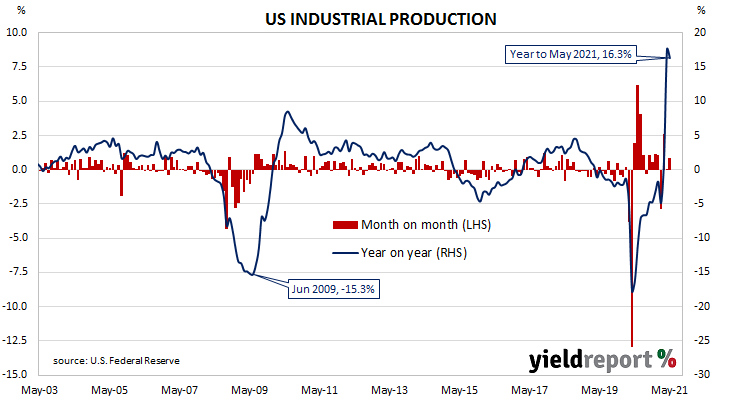
The Federal Reserve’s industrial production (IP) index measures real output from manufacturing, mining, electricity and gas company facilities located in the United States. These sectors are thought to be sensitive to consumer demand and so some leading indicators of GDP use industrial production figures as a component. US production collapsed through March and April of 2020 and then began recovering in subsequent months.
According to the Federal Reserve, US industrial production grew by 0.8% on a seasonally adjusted basis in May. The result was more than the 0.6% increase which had been generally expected and substantially more than April’s 0.1% expansion after it was revised down considerably from 0.7%. On an annual basis, the expansion rate slowed from April’s figure of +17.6% to +16.3%.
The report was released on the same day as May’s retail sales and producer price index (PPI) numbers but US Treasury bond yields hardly moved on the day as markets awaited this week’s FOMC meeting. By the end of the day, 2-year and 10-year Treasury yields remained unchanged at 0.16% and 1.50% respectively while the 30-year yield finished 1bp higher at 2.19%.
NAB senior economist Tapas Strickland said the figures, in conjunction with other recent reports, indicated US manufacturing “is moving past peak growth, even if activity remains very strong in an absolute sense.” He also noted it had recovered to pre-COVID levels.
May PPI report: “ongoing inflation pressure” in pipeline for US
15 June 2021
Summary: Prices received by producers rise by 0.8% in May; double expected figure; annual rate moves further above 6%; “core” PPI increases by 0.7% again; points “to ongoing pipeline inflation pressure”; goods prices up 1.5%, services up 0.6%.
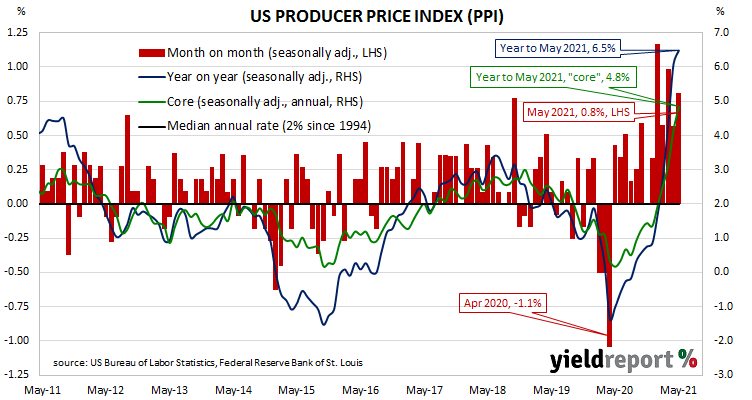
Around the end of 2018, the annual inflation rate of the US producer price index (PPI) began a downtrend which continued through 2019. Months in which producer prices increased suggested the trend may have been coming to an end, only for it to continue, culminating in a plunge in April 2020. Figures returned to “normal” towards the end of that year and annual rates are now well above average.
The latest figures published by the Bureau of Labor Statistics indicate producer prices rose by 0.8% after seasonal adjustments in May. The increase was double the 0.4% rise which had been generally expected and more than April’s 0.6% rise. On a 12-month basis, the rate of producer price inflation after seasonal adjustments increased from 6.1% to 6.5%.
PPI inflation excluding foods and energy, or “core” PPI inflation, rose by 0.7%, the same rate as in April and March. The annual rate accelerated again, this time from 4.2% to 4.8%. ANZ economist Adelaide Timbrell said the figures point “to ongoing pipeline inflation pressure.”
The report was released on the same day as May’s retail sales and industrial production numbers but US Treasury bond yields hardly moved on the day as markets awaited this week’s FOMC meeting. By the end of the day, 2-year and 10-year Treasury yields remained unchanged at 0.16% and 1.50% respectively while the 30-year yield finished 1bp higher at 2.19%.
The BLS stated higher prices for final demand goods accounted for 60% of the month’s increase after they rose by 1.5% on average. Prices of final demand services rose by 0.6%.
The producer price index (PPI) is a measure of prices received by producers for domestically produced goods, services and construction. It is put together in a fashion similar to the consumer price index (CPI) except it measures prices received from the producer’s perspective rather than from the perspective of a retailer or a consumer. It is another one of the various measures of inflation tracked by the US Fed, along with core personal consumption expenditure (PCE) price data.
US retail falls in May; still an “encouraging story”
15 June 2021
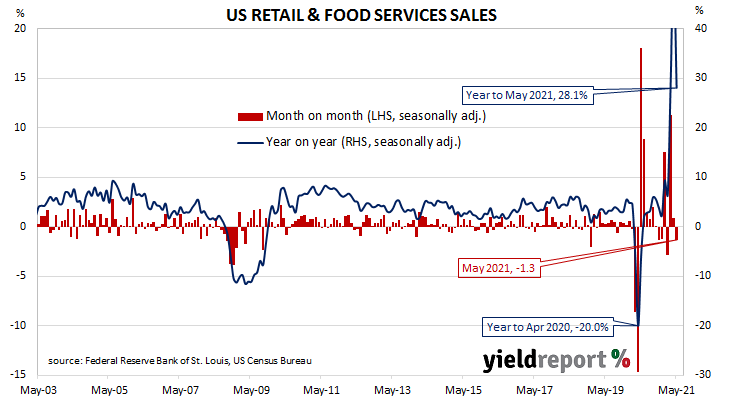
Summary: US retail sales decline by 1.3% in May; fall larger than -0.4% expected; initially disappointing but numbers “tell encouraging story”; “move from spending on goods to services “underway”; falls in majority of retail categories; “vehicles and parts” the largest influence.
US retail sales had been trending up since late 2015 but, commencing in late 2018, a series of weak or negative monthly results led to a drop-off in the annual growth rate below 2.0% by the end of that year. Growth rates then increased in trend terms through 2019 and into early 2020 until pandemic restrictions sent it into negative territory. A “v-shaped” recovery then took place which was followed by some short-term spikes as federal stimulus payments hit US households in early 2021.
According to the latest “advance” sales numbers released by the US Census Bureau, total retail sales declined by 1.3% in May. The fall was larger than the 0.4% decrease which had been generally expected and it contrasted with April’s 0.9% rise after it was revised up from zero. On an annual basis, the growth rate slowed from April’s revised figure of 53.4% to 28.1% as the pandemic-induced reduction in spending during the June 2020 quarter continued falling out of the calculations.
NAB senior economist Tapas Strickland said although the result was initially disappointing, “looking under the hood the retail numbers tell an encouraging story.”
The report was released on the same day as May’s industrial production and producer price index (PPI) numbers but US Treasury bond yields hardly moved on the day as markets awaited this week’s FOMC meeting. By the end of the day, 2-year and 10-year Treasury yields remained unchanged at 0.16% and 1.50% respectively while the 30-year yield finished 1bp higher at 2.19%.
Strickland noted April’s figures were revised up and a “pivot from goods to services also appears underway”. He pointed to increased spending on restaurants and bars “with total sending on food-service sales now above pre-pandemic levels.” He thought such a move may “alleviate some of the price pressures being seen on the goods side of the economy.”
The majority of categories recorded lower sales over the month. The “Motor vehicle & parts dealers” segment provided the largest single influence on the overall result, falling by 3.7% for the month while still remaining 34.8% higher for the year. Building materials and general merchandise sales also had significant influences on the total, falling by 5.9% and 3.3% respectively.
Supply chains “remain a drag” as euro-zone output recovers
14 June 2021
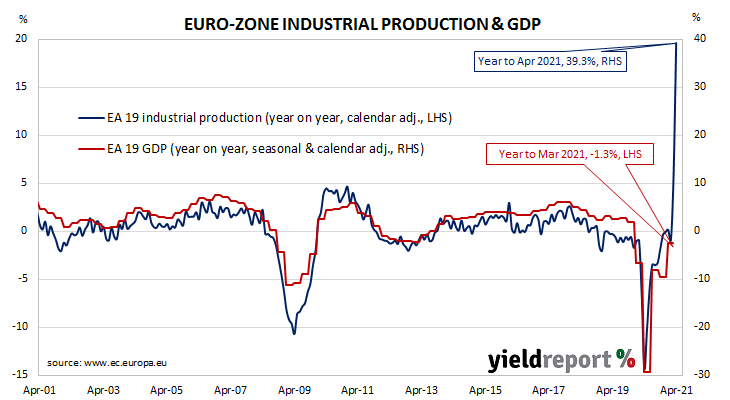
Summary: Euro-zone industrial production up solidly in April; expansion double expected figure; annual growth rate jumps again on “base effects”; supply chain problems still “a drag on growth”; expansion in only two of euro-zone’s four largest economies.
Following a recession in 2009/2010 and the debt-crisis which flowed from it, euro-zone industrial production recovered and then reached a peak four years later in 2016. Growth rates then fluctuated for two years before beginning a steady and persistent slowdown from the start of 2018. That decline was transformed into a plunge in March and April of 2020. However, subsequent months in 2020 and early 2021 produced an almost-complete recovery.
According to the latest figures released by Eurostat, euro-zone industrial production increased by 0.8% in April on a seasonally-adjusted and calendar-adjusted basis. The expansion was double the 0.4% increase which had been generally expected and double March’s 0.4% increase after revisions. On an annual basis, the calendar-adjusted growth rate jumped again, this time from March’s revised rate of 11.5% to 39.3%. (Monthly production figures collapsed during the June quarter of 2020, resulting in significantly lower bases for annual calculations.)
German and French 10-year sovereign bond yields moved higher on the day. By the close of business, both had risen by 3bps to -0.25% and 0.13% respectively.
ANZ economist Charlotte Heck-Parsch pointed to the effects of the June 2020 quarter’s on the annual growth rate and noted supply chain problems “remain a drag on growth.”
Industrial production growth expanded in only two of the euro-zone’s four largest economies. Germany’s production contracted by 0.3% while the comparable figures for France, Italy and Spain were zero, +1.8% and +1.1% respectively.