News

US confidence recovers in June; mainly in middle, upper incomes

11 June 2021

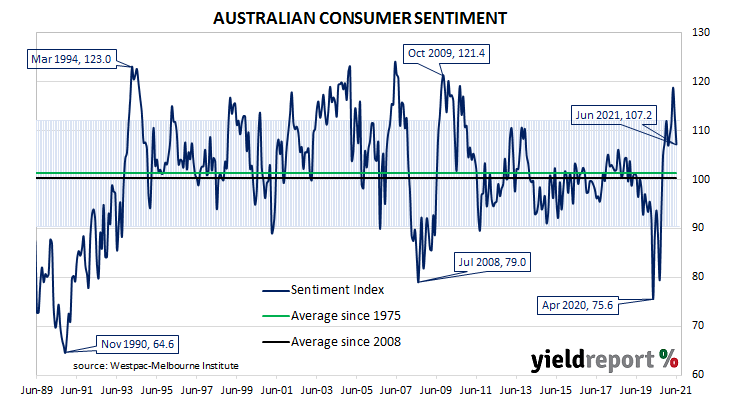
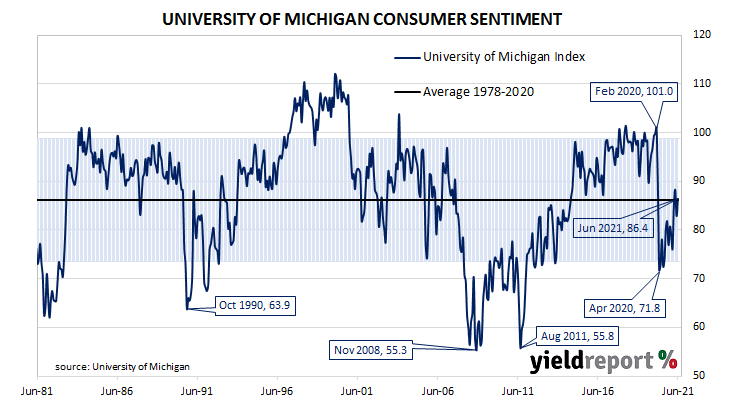
Summary: US consumer confidence improves in June; University of Michigan index above consensus figure; views of present conditions, future conditions both improve; driven by middle, upper income households, future economic prospects; stronger growth, lower unemployment rates generally expected; higher inflation rates “a top concern”.


US consumer confidence started 2020 at an elevated level. However, surveys had begun to reflect a growing uneasiness with the global spread of COVID-19 and its reach into the US by March of that year. After a plunge in the following month, household confidence recovered in a haphazard fashion, holding at below-average levels. While recent surveys suggested optimism may be about to rise, they have also tended to produce readings close to the long-term average.

The latest survey conducted by the University of Michigan indicates the average confidence level of US households improved in June. The University’s preliminary reading of its Index of Consumer Sentiment registered 86.4, above the generally expected figure of 83.8 and higher than May’s final figure of 82.9. Consumers’ views of current conditions and expectations regarding future conditions both improved in comparison to those held at the time of the May survey.

“The early June gain was mainly among middle and upper income households and for future economic prospects rather than current conditions,” said the University’s Surveys of Consumers chief economist, Richard Curtin.

Longer-term US Treasury bond yields moved a touch higher on the day. By the end of it, 10-year and 30-year Treasury yields had each crept up 1bp to 1.45% and 2.14% respectively. The 2-year yield finished unchanged at 0.15%.

Curtin noted respondents generally expected stronger growth, “with an all-time record number of consumers anticipating a net decline in unemployment.” However, higher inflation rates “remained a top concern of consumers, although the expected rate of inflation declined in early June.”

More-confident households are generally inclined to spend more and save less; some increase in household spending could be expected to follow. As private consumption expenditures account for a majority of GDP in advanced economies, a higher rate of household spending growth would flow through to higher GDP growth if other GDP components did not compensate.

May US CPI report suggests “inflation creep may be broadening”

10 June 2021

Summary: US CPI rises noticeably in May; double expectations; “core” rate more than expected figure; most,  not all, underlying drivers point to transitory factors; non-food/energy commodities, used car/truck prices main drivers; “inflation creep may be broadening”; risk of “more permanent lift” in inflation.


The annual rate of US inflation as measured by changes in the consumer price index (CPI) halved from nearly 3% in the period from July 2018 to February 2019. It then fluctuated in a range from 1.5% to 2.0% through 2019 before rising above 2.0% in the final months of that year. Substantially lower rates were reported from March 2020 to May 2020; falls in the index over these three months in 2020 are expected to raise annual inflation rates temporarily over the corresponding months in 2021.

The latest CPI figures released by the Bureau of Labor Statistics indicated seasonally-adjusted consumer prices rose by 0.6% on average in May. The result was double the 0.3% increase which had been generally expected but less than April’s 0.8% jump. On a 12-month basis, the inflation rate accelerated from April’s seasonally adjusted reading of 4.2% to 4.9%.

“Headline” inflation is known to be volatile and so references are often made to “core” inflation for analytical purposes. Core inflation, a measure of inflation which strips out the volatile food and energy components of the index, increased by 0.7% on a seasonally-adjusted basis for the month. The result was more than the expected 0.5% but less than April’s 0.9% increase. The annual rate accelerated again, from 3.0% to 3.8%.

NAB currency strategist Rodrigo Catril said “most, but not all of its underlying drivers pointing to transitory factors.” He noted the rise in core inflation was largely driven by increases used car prices, airfares fares and vehicle rentals.

Longer-term US Treasury bond yields fell on the day. By the close of business, the 10-year yield had lost 5bps to 1.44% and the 30-year yield had shed 4bps to 2.13%. The 2-year yield finished 1bp higher at 0.15%.

In terms of US Fed policy, expectations of any change in the federal funds range over the next 12 months remained fairly soft. June 2022 futures contracts implied an effective federal funds rate of 0.10%, only several basis points above the spot rate.

Consumer sentiment softens again; Melbourne lockdown infects other states

09 June 2021

Summary: Household sentiment softens in June; “almost certainly due” to Melbourne lockdown; still well above long-term average; all five sub-indices lower; unemployment index higher; falls in non-Victorian states reflects vulnerability to further outbreaks.


After a lengthy divergence between measures of consumer sentiment and business confidence in Australia which began in 2014, confidence readings of the two sectors converged again around July 2018. Both readings then deteriorated gradually in trend terms, with consumer confidence leading the way. Household sentiment fell off a cliff in April 2020 but, after a few months of to-ing and fro-ing, it then staged a full recovery.

According to the latest Westpac-Melbourne Institute survey conducted in the first week of June, household sentiment softened for a second consecutive month but remained at an above-average level. The Consumer Sentiment Index declined from May’s reading of 113.1 to 107.2.

“The latest fall in June is almost certainly due to concerns around the two-week lockdown in Melbourne. The survey was conducted during the first week of the lockdown,” said Westpac chief economist Bill Evans.

Any reading of the Consumer Sentiment Index above 100 indicates the number of consumers who are optimistic is greater than the number of consumers who are pessimistic. The latest figure is still well above the long-term average reading of just over 101.

Domestic Treasury bond yields declined on the day, largely in line with overnight movements in US Treasury bond yields. By the close of business, the 3-year ACGB yield had lost 2bps to 0.18% while 10-year and 20-year yields each finished 3bps lower at 1.52% and 2.21% respectively.

In the cash futures market, expectations of a change in the actual cash rate, currently at 0.03%, remained largely unchanged. At the end of the day, contract prices implied the cash rate would rise slowly, reaching 0.145% by October 2022.

All five sub-indices again registered lower readings; the “Economic conditions – next 12 months” sub-index experienced the largest monthly percentage decline, followed by the “Family finances versus a year ago” sub-index.

The Unemployment Expectations index, formerly a useful guide to RBA rate changes, rose from 100.2 to 108.4. Higher readings result from more respondents expecting a higher unemployment rate in the year ahead.

JOLTS report: US “jobs easy to find”

08 June 2021

Summary: US quit rate hits new high in April; jobs “easy to find”; job openings, separations both up; openings-hires gap “indication of challenges” for businesses.


The number of US employees who quit their jobs as a percentage of total employment increased slowly but steadily after the GFC. It peaked in March 2019 and then tracked sideways until virus containment measures were introduced in March 2020. The quit rate plummeted as alternative employment opportunities rapidly dried up but then recovered back to its pre-pandemic rate in the third quarter of 2020.

Figures released as part of the most recent JOLTS report show the quit rate hit a new series high in April. 2.7% of the non-farm workforce left their jobs voluntarily, up from March’s 2.5% after it was revised up from 2.4%. There were 384,000 additional quits, outweighing a 278,000 increase in the number of people employed in the non-farm sector in April.

ANZ analyst Rahul Khare said the 2.7% quit rate indicates “jobs are easy to find.”

Despite the report, long-term US Treasury bond yields decreased moderately on the day. By the close of business, 10-year and 30-year Treasury yields had both shed 3bps to 1.54% and 2.22% respectively. The 2-year yield finished unchanged at 0.16%.

The largest sources of additional quits came from the “Retail trade” and the “Professional and business services” sectors while the construction sector experienced the greatest decline. Overall, the total number of quits for the month rose from March’s revised figure of 3.568 million to 3.952 million.

Total vacancies at the end of April increased by 998,000, or 12.0%, from March’s revised figure of 8.288 million to 9.286 million, driven by a 349,000 rise in the “Accommodation and food services” sector and a 115,000 rise in the “Other services” sector. 23,000 fewer openings in the “Educational services” sector provided the single largest offset. Overall, 15 out of 18 sectors experienced more job openings than in the previous month.

Total separations increased by 324,000, or 6.0%, from March’s revised figure of 5.436 million to 5.760 million. The rise was led by the “Retail trade” sector, where there were 116,000 more separations than in March. Separations increased in 13 out of 18 sectors.

NAB survey points to “strong outcomes”, “ongoing recovery”

08 June 2021

Summary: Business conditions improve in May, another new record high; confidence declines, still elevated; points to “strong outcomes” in business sector”; capacity usage rate slips; all eight sectors of economy above respective long-run averages; “suggests sharply lower unemployment in near-term”; breadth of strength in survey encouraging, points to ongoing recovery in all sectors.


NAB’s business survey indicated Australian business conditions were robust in the first half of 2018, with a cyclical-peak reached in April of that year. Readings from NAB’s indices then began to slip, declining to below-average levels by the end of 2018. Forecasts of a slowdown in the domestic economy began to emerge in the first half of 2019 and the indices trended lower, hitting a nadir in April 2020 as pandemic restrictions were introduced. Conditions have improved markedly since then and NAB’s indices are both back at elevated levels.

According to NAB’s latest monthly business survey of over 400 firms conducted over the second half of May, business conditions improved again as the NAB index hit another record high. NAB’s conditions index registered 37, up from April’s revised reading of 32.

Business confidence subsided slightly but remained at an elevated level. NAB’s confidence index declined from April’s revised reading of 23 to 20, just a few points below April’s record-high reading. Typically, NAB’s confidence index leads the conditions index by approximately one month, although some divergences have appeared in the past from time to time.

“The survey continues to point to strong outcomes in the business sector, with business conditions resetting their record high for the second month in a row and forward orders also holding at a record level,” said NAB chief economist Alan Oster.

Long-term Commonwealth Government bond yields fell on the day, in contrast with overnight movements of their US counterparts. By the end of the day, the 3-year ACGB yield slipped 1bp to 0.20%, the 10-year yield had shed 3bps to 1.55% while the 20-year yield finished 5bps lower at 2.24%.

In the cash futures market, expectations of a change in the actual cash rate, currently at 0.03%, remained fairly stable. At the end of the day, contract prices implied the cash rate would creep up to around 0.16% by October 2022.

May job ads consistent with 5% jobless rate

07 June 2021

Summary:  Job ads up again in May; ads double same month in 2020; consistent with 5% jobless rate; “employment growth will be very strong”; ANZ expects jobless rate to hit 4.8% by end of this year.


From mid-2017 onwards, year-on-year growth rates in the total number of Australian job advertisements consistently exceeded 10%. That was until mid-2018 when the annual growth rate fell back markedly. 2019 was notable for its reduced employment advertising and this trend continued into the first quarter of 2020. Figures plunged in April and May of 2020 as pandemic restrictions took effect but then recovered relatively quickly. 

According to the latest ANZ figures, total advertisements increased by 7.9% in May on a seasonally-adjusted basis. The rise followed a 4.9% increase in April and an 8.0% gain in March after revisions. On a 12-month basis, total job advertisements were 219.8% higher than in May 2020, up from April’s comparable figure of 195.5%.

“ANZ Job Ads hit 12 straight months of gains in May and is now consistent with an unemployment rate of around 5%,” said ANZ senior economist Catherine Birch.

Commonwealth bond yields fell moderately on the day, following noticeably-lower long-term US Treasury bond yields from Friday night. By the close of business, the 3-year ACGB yield had slipped 1bp to 0.21%, the 10-year yield had lost 5bps to 1.58% while the 20-year yield finished 4bps lower at 2.29%.

Birch noted the figures are “unlikely to fully translate into employment, due to skills mismatches and restricted labour mobility” but “employment growth will be very strong, particularly given such low population growth.” ANZ currently expects Australia’s jobless rate to hit 4.8% by the end of this year and 4.4% by the end of 2022.

The inverse relationship between job advertisements and the unemployment rate has been quite strong (see below chart), although ANZ themselves called the relationship between the two series into question in early 2019.  A rising number of job advertisements as a proportion of the labour force is suggestive of lower unemployment rates in the near-future. A falling ratio suggests higher unemployment rates will follow.

May US non-farm payrolls “not too good, not too bad”

04 June 2021

Summary: Non-farm payrolls increase in May; less than expected; previous two months’ figures revised up; jobless rate falls, participation rate down; market response: “not too good, not too bad”; not strong enough to add to speculation of Fed taper; jobs-to-population ratio inches up; underemployment rate falls closer to 10%; annual hourly pay growth resumes, employers having to “pay up”.


The US economy ceased producing jobs in net terms as infection controls began to be implemented in March 2020. The unemployment rate had been around 3.5% but that changed as job losses began to surge through March and April of 2020. The May 2020 non-farm employment report represented a turning point and subsequent months provided substantial employment gains. Changes in recent months have been more modest but mostly positive.

According to the US Bureau of Labor Statistics, the US economy created an additional 559,000 jobs in the non-farm sector in May. The increase was below the 663,000 which had been generally expected earlier in the week but double the 278,000 jobs that had been added in April after revisions. Employment figures for March and April were revised up by a total of 27,000.

The unemployment rate fell from April’s rate of 6.1% to 5.8%. The total number of unemployed decreased by 496,000 to 9.316 million while the total number of people who are either employed or looking for work decreased by 52,000 to 160.936 million. The lower number of people in the labour force led to fall in the participation rate from April’s rate of 61.7% to 61.6%.

“Not too good, not too bad, that seems to have been the market response to the non-farm payrolls numbers out of the US on Friday,” said NAB currency strategist Rodrigo Catril.

US Treasury yields fell on the day, especially at the long end. By the close of business, the 2-year bond yield had slipped 1bp to 0.15% while 10-year and 30-year yields each finished 7bps lower at 1.55% and 2.23% respectively.

Catril noted “the report was not too strong to instigate Fed tapering talk but strong enough to suggest the US labour market remains on a strong recovery path.”

One figure which is indicative of the “spare capacity” of the US employment market is the employment-to-population ratio. This ratio is simply the number of people in work divided by the total US population. It hit a cyclical-low of 58.2 in October 2010 before slowly recovering to just above 61% in late-2019. May’s reading inched up from 57.9% to 58.0%, continuing a rising trend which began in May 2020.

“Solid” private payrolls report adds to continuing recovery picture

03 June 2021

Summary: ADP payroll numbers increase in May; more than consensus figure; April increase revised down; suggest US job market to continue recovery at “solid pace”; led again by leisure/hospitality sector; figures up across firms of all sizes; gain predominantly in services sector.


The ADP National Employment Report is a monthly report which provides an estimate of US non-farm employment in the private sector. Since publishing of the report began in 2006, its employment figures have exhibited a high correlation with official non-farm payroll figures, although a large difference can arise in any individual month.

The latest ADP report indicated private sector employment increased by 978,000 in May, more than the 700,000 which had been generally expected. April’s increase was revised down by 88,000 to 654,000.

“Regardless of the reliability of the ADP report as guide for nonfarm payrolls, the solid ADP print overnight alongside another solid ISM services print suggests the US labour market should recover at a solid pace over coming months,” said NAB currency strategist Rodrigo Catril.

US Treasury yields rose on the day. By the close of business, 2-year Treasury bond yield had inched up 1bp to 0.16% while 10-year and 30-year yields each finished 3bps higher at 1.62% and 2.30% respectively.

In terms of US Fed policy, expectations of any change in the federal funds rate over the next 12 months remained soft. Federal funds futures contracts for June 2022 implied an effective federal funds rate of 0.105%, about 5bps above the current spot rate.

Employment numbers in net terms increased across businesses of all sizes, with gains fairly evenly distributed for a third consecutive month. Firms with less than 50 employees filled a net 333,000 positions, mid-sized firms (50-499 employees) gained 338,000 positions while large businesses (500 or more employees) accounted for 308,000 additional employees.

Labour shortages, delays, disruptions in latest ISM PMI report

01 June 2021

Summary: ISM purchasing managers index (PMI) slightly up; above consensus expectation; US firms struggling with labour shortages, shipping delays, other disruptions; implies US economy still growing at rapid pace.


US purchasing managers’ index (PMI) readings reached a cyclical peak in September 2017.  They then started a downtrend which ended in March 2020 with a contraction in US manufacturing which lasted until June 2020. Subsequent month’s readings implied growth had resumed before becoming stronger through the early months of 2021.

According to the latest Institute of Supply Management (ISM) survey, its Purchasing Managers Index recorded a reading of 61.2% in May. The result was slightly above the generally expected figure of 61.0% and slightly higher than April’s reading of 60.7%. The average reading since 1948 is 52.9% and any reading above 50% implies an expansion in the US manufacturing sector relative to the previous month.

“The data continue to show that as the US economy recovers, firms are struggling to keep up with surging demand due to labour shortages, shipping delays and other COVID-related disruptions,” said ANZ senior economist Catherine Birch.

US Treasury bond yields rose modestly on the day. By the close of business, the 2-year and 10-year Treasury bond yields had each inched up 1bp to 0.15% and 1.61% respectively while the 30-year yield finished 3bps higher at 2.29%.

NAB currency strategist Rodrigo Catril noted ISM’s employment gauge had fallen to a six-month low, “reflecting the difficulty in hiring and retaining labour, with the spokesman for the survey pointing to the enhanced unemployment benefits reducing labour supply…” He expects labour shortages to ease “in coming months” as US states withdraw the supplementary payments.

Purchasing managers’ indices (PMIs) are economic indicators derived from monthly surveys of executives in private-sector companies. They are diffusion indices, which means a reading of 50% represents no change from the previous period, while a reading under 50% implies respondents reported a deterioration on average. According to the ISM, a reading “above 42.8%, over a period of time, generally indicates an expansion of the overall economy.”

April home approvals drop, “largely confined” to high-rise

01 June 2021

Summary: Home approval numbers fall in April; slightly lower than expected figure; “largely confined to high-rise”; economists divided on outlook; house approval up, apartment approvals drop; non-residential approvals drop but still up on annual basis.


Approvals for dwellings, that is apartments and houses, had been heading south since mid-2018. As an indicator of investor confidence, falling approvals had presented a worrying signal, not just for the building sector but for the overall economy. However, approval figures from late-2019 and the early months of 2020 painted a picture of a recovery taking place, even as late as April. Subsequent months’ figures then trended sharply upwards.

The Australian Bureau of Statistics has released the latest figures from April and total residential approvals fell by 8.6% on a seasonally-adjusted basis. The drop over the month was slightly lower than the 10.0% which had been generally expected and in contrast with March’s 18.9% rise after revisions. Total approvals increased by 39.2% on an annual basis, a slowdown from the previous month’s revised figure of 50.0%. Monthly growth rates are often volatile.

Westpac senior economist Matthew Hassan said weakness was “largely confined to high-rise units rather than appearing in segments where unwinding pull-forward effects from the expiring HomeBuilder scheme would impact.”

Commonwealth bond yields moved lower on the day, ignoring flat or slightly higher US Treasury yields at the close of trading on Tuesday morning. By the end of the day, the 3-year ACGB yield had slipped 1bp to 0.21%, the 10-year remained unchanged at 1.65% while the 20-year yield finished 2bps lower at 2.35%.

“Very low interest rates…and continued fiscal support for home buyers announced in the May budget are also supporting demand for housing, which is likely to keep supporting approvals past the effects of Homebuilder,” said ANZ economist Adelaide Timbrell.

Click for more news