Summary: US output expands in April; rise substantially less than expected; March figure revised up; capacity utilisation rate rises, still below January figure.
The Federal Reserve’s industrial production (IP) index measures real output from manufacturing, mining, electricity and gas company facilities located in the United States. These sectors are thought to be sensitive to consumer demand and so some leading indicators of GDP use industrial production figures as a component.
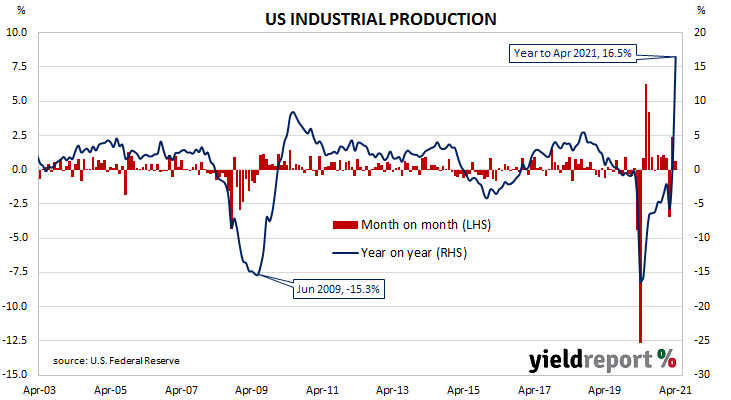
US production collapsed through March and April of 2020 and then began recovering in subsequent months.
According to the Federal Reserve, US industrial production grew by 0.7% on a seasonally adjusted basis in April. The result was substantially less than the 1.3% increase which had been generally expected and March’s 2.4% expansion after it was revised up from 1.4%. On an annual basis, the expansion rate increased from March’s figure of +1.0% to +16.5%, reflecting a 12.7% fall in April 2020.
The report was released on the same day as April’s retail sales numbers and the University of Michigan’s latest consumer sentiment report. US Treasury bond yields moved lower and, by the end of the day, the 2-year Treasury yield had slipped 1bp to 0.15%, the 10-year yield had lost 2bps to 1.64% while the 30-year yield finished 6bps lower at 2.35%.
The same report includes US capacity utilisation figures which are generally accepted as an indicator of future investment expenditure and/or inflationary pressures. Capacity usage had hit a high for the last business cycle in early 2019 before it began a downtrend which ended with April 2020’s multi-decade low of 64.2%. April’s reading rose from March’s figure of 74.4% to 74.9%, a level still below that of January.
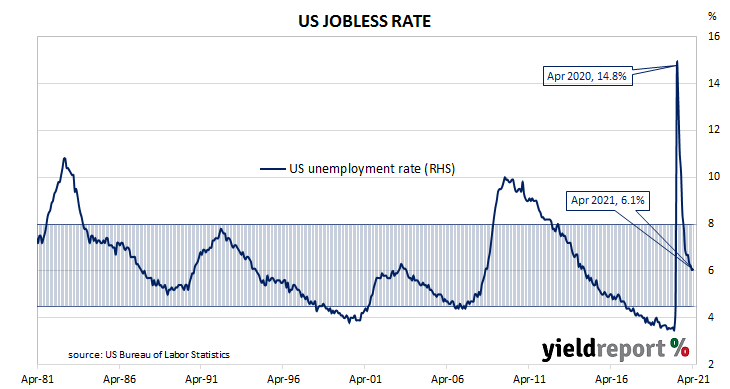
While the utilisation rate’s correlation with the US jobless rate is solid, it is not as high as Australia’s comparable correlation.