News

Inflation index back above 2 per cent

03 May 2021

Summary: Melbourne Institute inflation rate up moderately in April; annual rate back above 2 per cent.


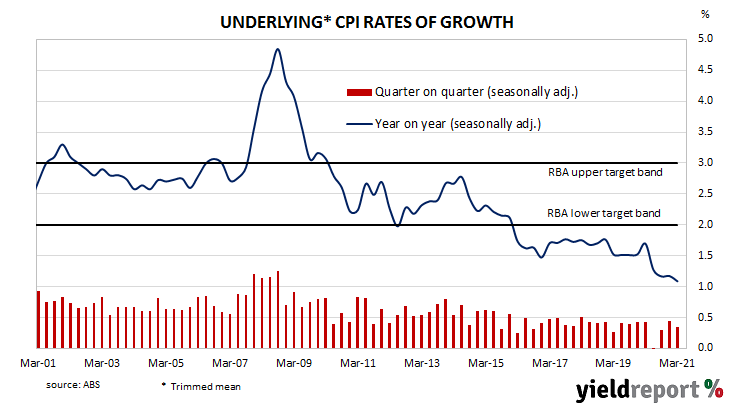
Despite the RBA’s desire for a higher inflation rate, ostensibly to combat recessions, attempts to accelerate inflation through record-low interest rates have failed to date. The RBA’s stated objective is to achieve an inflation rate of between 2% and 3%, “on average, over time.” Since the GFC, Australia’s inflation rate has been trending lower and lower; the “coronavirus recession” then crushed it in the June quarter of 2020.

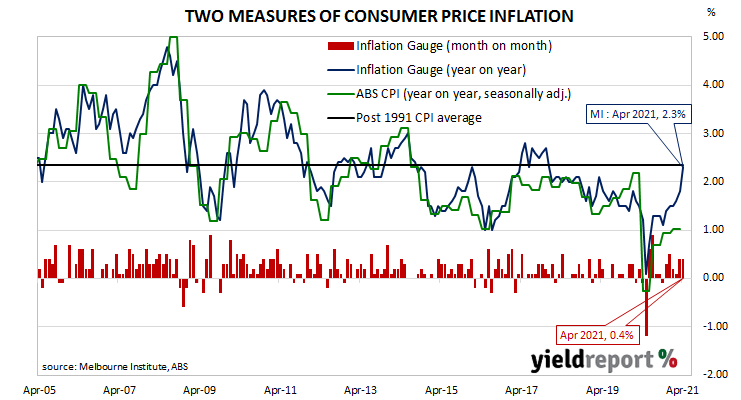
The Melbourne Institute’s latest reading of its Inflation Gauge index increased by 0.4% in April, following increases of 0.4% and 0.1% in March and February respectively. On an annual basis, the index rose by 2.3%, up from 1.8% in March.

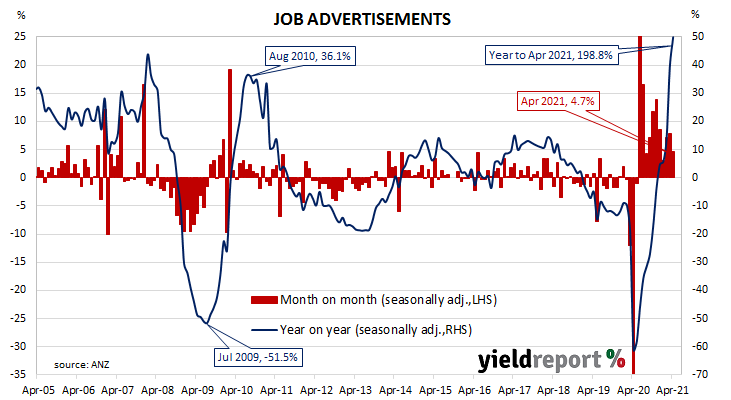
The figures were released on the same day as ANZ’s latest Job Ads survey but Commonwealth bond yields hardly moved on the day as they followed a subdued session in US Treasury bond markets overnight. By the close of business, the 3-year ACGB yield had slipped 1bp to 0.26% while 10-year and 20-year yields each finished 1bp higher at 1.71% and 2.43% respectively.

The Melbourne Institute’s Inflation Gauge is an attempt to replicate the ABS consumer price index (CPI) on a monthly basis. It has turned out to be a reliable leading indicator of the CPI, although there are periods in which the Inflation Gauge and the CPI have diverged for as long as twelve months. On average, the Inflation Gauge’s annual rate tends to overestimate the ABS headline rate by around 0.1% on average.

Central bankers desire a certain level of inflation which is “sufficiently low that it does not materially distort economic decisions in the community” but high enough so it does not constrain “a central bank’s ability to combat recessions.” Hence the recent obsession among central banks, including the RBA, to increase inflation

“Ongoing declines” in jobless rate expected: ANZ

03 May 2021

Summary:  Job ads up again in April; ads doubled since April 2020; “signalling ongoing declines” in jobless rate; hiring by businesses “not heavily dependent” on JobKeeper.


From mid-2017 onwards, year-on-year growth rates in the total number of Australian job advertisements consistently exceeded 10%. That was until mid-2018 when the annual growth rate fell back markedly. 2019 was notable for its reduced employment advertising and this trend continued into the first quarter of 2020. Figures plunged in April and May of 2020 as pandemic restrictions took effect but then recovered relatively quickly.

According to the latest ANZ figures, total advertisements increased by 4.7% in April on a seasonally-adjusted basis. The rise followed a 7.8% increase in March and a 7.2% gain in February after revisions. On a 12-month basis, total job advertisements were 198.8% higher than in April 2020, up from March’s comparable figure of 39.2%.

“ANZ Job Ads is still signalling ongoing declines in the unemployment rate,” said ANZ senior economist Catherine Birch.

The figures were released on the same day as the Inflation Gauge reading but Commonwealth bond yields hardly moved on the day as they followed a subdued session in US Treasury bond markets overnight. By the close of business, the 3-year ACGB yield had slipped 1bp to 0.26% while 10-year and 20-year yields each finished 1bp higher at 1.71% and 2.43% respectively.

Birch said, “It is not surprising that ANZ Job Ads has continued to rise post-JobKeeper. Businesses looking to hire new workers are, on the whole, unlikely to be those that were heavily dependent on the JobKeeper payment.” However, she also expects “many but not all” who do lose their jobs in the months following the end of the programme “will be able to find work elsewhere relatively quickly” given the current strength of the labour market.

The inverse relationship between job advertisements and the unemployment rate has been quite strong (see below chart), although ANZ themselves called the relationship between the two series into question in early 2019.  A rising number of job advertisements as a proportion of the labour force is suggestive of lower unemployment rates in the near-future. A falling ratio suggests higher unemployment rates will follow.

Some signs of “firming inflation pressures” from US PCE report

30 April 2021

Summary: US Fed’s favoured inflation measure up in March; above market expectations; annual rate accelerates; some signs of “firming inflation pressures”; long-term Treasury bond yields hardly move.


One of the US Fed’s favoured measures of inflation is the change in the core personal consumption expenditures (PCE) price index. After hitting the Fed’s target at the time of 2.0% in mid-2018, the annual rate then hovered in a range between 1.8% and 2.0% before it eased back to a range between 1.5% and 1.8% through 2019. It then plummeted below 1.0% in April 2020 before rising back to around 1.5% in the September quarter.

The latest figures have now been published by the Bureau of Economic Analysis as part of the March personal income and expenditures report. Core PCE prices rose by 0.4% over the month, above the generally expected figure of 0.3% and well above February’s 0.1% increase. On a 12-month basis, the core PCE inflation rate accelerated from 1.4% to 1.8%.

“The PCE deflator showed some evidence of firming inflation pressures in the monthly data as the economy re-opens, but [it is] well within the Fed’s script,” said ANZ Head of Australian Economics David Plank.

US Treasury bond yields hardly moved on the day. By the close of business, the 2-year Treasury bond yield remained unchanged at 0.16%, the 10-year yield had slipped 1bp to 1.53% while the 30-year yield finished unchanged at 2.30%.

The core version of PCE strips out energy and food components, which are volatile from month to month, in an attempt to identify the prevailing trend. It’s not the only measure of inflation used by the Fed; it also tracks the Consumer Price Index (CPI) and the Producer Price Index (PPI) from the Department of Labor. However, it is the one measure that is most often referred to in FOMC minutes.

March credit update “confirms turning point”

30 April 2021

Summary: Private sector credit grows at moderate rate in March; above expected figure; update confirms credit cycle turned “decisively”; fall in annual rate the result of base effects from March 2020; housing credit growth continues, business & personal loans up.


The pace of lending to the non-bank private sector by financial institutions in Australia has been trending down since late-2015. Private sector credit growth appeared to have stabilised in the September quarter of 2018 but the annual growth rate then continued to deteriorate through to the end of 2019. The early months of 2020 provided some positive signs but they disappeared in April 2020.

According to the latest RBA figures, private sector credit growth continued at a moderate pace in March, rising by 0.4%. The result was greater than the generally expected figure of 0.3% and faster than February’s 0.2% increase. However, the annual growth rate still slowed from 1.6% in February to 1.0%.

“A month ago, we described the private sector credit cycle at a turning point, with a strong tailwind from policy stimulus. Today’s update provides further confirmation that the credit cycle has turned decisively,” said senior Westpac senior economist Andrew Hanlan.

Owner-occupier loans accounted for about half of the net growth while investor and business loans accounted for much of the balance. Total personal debt grew for the first time in several years.

Commonwealth bond yields moved up on the day. At the close of business, the 3-year yield ACGB had inched up 1bp to 0.27% while 10-year and 20-year yields each finished 3bps higher at 1.70% and 2.42% respectively.

Hanlan noted the fall in the annual growth to 1.0% was the result of “base effects” from March 2020. “This will be the low point in the current cycle and compares with a GFC cycle low of 0.8% in November 2009.”

The traditional driver of loan growth rates, the owner-occupier segment, grew by 0.7% over the month, slightly faster than February’s 0.6%. The sector’s 12-month growth rate accelerated from 5.9% to 6.1%.

Growth rates in the business sector picked up as business credit grew by 0.3%, up from zero in February. However, the segment’s annual growth rate remained negative, its contraction rate increasing from February’s rate of -0.2% to -2.6%.

US GDP jumps; consumption a key driver in March quarter

29 April 2021

Summary:  US GDP up 1.6% in March quarter; personal consumption the key driver; recovery “well established”, double digit growth “not unrealistic expectation for Q2”; inventory change drags on result; supply disruptions may be a factor; GDP price deflator annual rate accelerates, nearly 2% per annum.


US GDP growth slowed in the second quarter of 2019 before stabilising at about 0.5% per quarter.  At the same time, US bond yields suggested future growth rates would be below trend. The US Fed agreed and it reduced its federal funds range three times in the second half of 2019. Pandemic restrictions in the June quarter of 2020 sent parts of the US economy into hibernation; the lifting of those same restrictions sparked a rapid recovery. Growth rates now appear to be reverting to more normal levels.

The US Bureau of Economic Analysis has now released March quarter “advance” GDP estimates and they indicate the US economy expanded by 1.6% or at an annualised growth rate of 6.4%. The figure was largely in line with the +1.6% (+6.5% annualised) which had been generally expected but higher than the December quarter’s 1.1% expansion.

“Personal consumption was the key driver of growth…supported by government stimulus payments and the broader recovery,” said Westpac economist Lochlan Halloway.

US GDP numbers are published in a manner which is different to most other countries; quarterly figures are compounded to give an annualised figure. In countries such as Australia and the UK, an annual figure is calculated by taking the latest number and comparing it with the figure from the same period in the previous year. The diagram above shows US GDP once it has been expressed in the normal manner, as well as the annualised figure.

US Treasury bond yields moved in a somewhat haphazard fashion on the day. By the end of it, the 2-year Treasury bond yield had slipped 1bp to 0.15%, the 10-year had gained 2bps to 1.64% while the 30-year yield finished unchanged at 2.30%.

In terms of US Fed policy, expectations of any change in the federal funds rate over the next 12 months remained largely stable. Federal funds futures contracts for April 2022 implied an effective federal funds rate of 0.11%, a few basis points above the current spot rate.

Euro-zone sentiment jumps; now implies expansion

29 April 2021

Summary: Euro-zone composite sentiment index up sharply; well above expectations; results from major euro-zone economies all up; sovereign bond yields up, especially French yields; index now implies euro-zone GDP expansion.


The European Commission’s Economic Sentiment Indicator (ESI) is a composite index comprised of five differently-weighted sectoral confidence indicators.  It is heavily weighted towards confidence surveys from the business sector, with the consumer confidence sub-index only accounting for 20% of the ESI. However, it has a good relationship with euro-zone GDP, although not as a leading indicator.

The ESI posted a reading of 110.3 in April, significantly above the market’s expected figure of 102.2 and well above March’s revised reading of 100.9. The average reading since 1985 has been just under 100.

Confidence improved across all five of the industry, retail trade, construction, services and consumer sub-indices. On a geographical basis, the ESI increased in Germany, France, Italy and Spain.

German and French 10-year bond yields finished the day higher. By the close of business, the German bund yield had gained 4bps to -0.16% while the French OAT yield had jumped 14bps to 0.16%.

March CPI misses; tobacco, food softer than expected

28 April 2021

Summary: Inflation rate less than market expectations in March quarter; RBA preferred measure also less than expected; transport, health main drivers of result.


In the early 1990s, entrenched inflation in Australia was broken by the “recession we had to have” as it became known. Since then, underlying consumer price inflation has averaged around 2.4%, a little below the midpoint of the RBA’s target range of 2%-3%. Following the GFC, various measures of consumer inflation have been in a down-trend despite attempts by the RBA to increase them through historically low cash rates.

Consumer price indices for the March quarter have now been released by the ABS and both the headline and seasonally-adjusted figures were lower than the 0.9% which had been generally expected. The headline inflation rate came in at 0.6% for the quarter, less than the December quarter’s 0.9%. The seasonally-adjusted inflation rate also slowed in comparison to the previous quarter, from a revised rate of 0.9% to 0.5%. On a 12-month basis, the headline rate registered 1.1%, while the seasonally-adjusted rate posted a 1.0% increase. In the December quarter, their respective rates were both 0.9%.

The RBA’s preferred measure of underlying inflation, the “trimmed mean”, was also less than expected. The trimmed mean inflation rate for the March quarter was +0.3%, less than the market’s expected figure of 0.5% and slightly lower than the December quarter’s 0.4%. The 12-month growth rate slipped from 1.2% to 1.1%.

Commonwealth Government bond yields moved a little lower on the day. By the close of business, the 3-year ACGB yield had lost 2bps to 0.27% and the 10-year yield had slipped 1bp to 1.69%. The 20-year yield remained unchanged at 2.40%.

In the cash futures market, expectations of a change in the actual cash rate, currently at 0.03%, remained largely unchanged. At the end of the day, contract prices implied the cash rate would inch up slowly to around 0.12% by September 2022.

The main driver of the headline inflation figure in the quarter was a 3.2% rise in transport prices, contributing 0.3% points of the 0.6% (unadjusted) increase over the quarter. The health segment had the next largest influence on the quarter; it increased by 2.0% and contributed just over 0.1% points to the quarterly total.

US consumer sentiment “soars” in April

27 April 2021

Summary: US consumer confidence up sharply in April; Conference Board index “soars”; increase noticeably more than expected; view of present conditions jumps, view of future conditions improves more modestly; income prospects improve on job market, stimulus cheques.


After the GFC in 2008/09, US consumer confidence clawed its way back to neutral over a number of years and then went from strength to strength until late 2018. Measures of consumer confidence then oscillated within a fairly narrow band at historically high levels until they plunged in early 2020. Subsequent readings then fluctuated around the long-term average until March this year.

The latest Conference Board survey held during the first half of April indicated US consumer confidence improved for a fourth consecutive month. April’s Consumer Confidence Index registered 121.7, well above the median consensus figure of 111.9 and considerably higher than March’s final figure of 109.0. Consumers’ views of present conditions and future conditions both improved; the Present Situation Index “soared” from 110.1 to 139.6 while the Expectations Index rose much more modestly, from 108.3 to 109.8.

“Consumers were more upbeat about their income prospects, perhaps due to the improving job market and the recent round of stimulus cheques,” said Lynn Franco, a senior director at The Conference Board.

Long-term US Treasury bond yields moved a touch higher on the day. By the close of business, 10-year and 30-year Treasury bond yields each ticked up 1bp to 1.63% and 2.30% respectively. The 2-year yield remained unchanged at 0.18%.

In terms of US Fed policy, expectations of any change in the federal funds rate over the next 12 months remained low. Federal funds futures contracts for April 2022 implied an effective federal funds rate of 0.11%, about 4bps above the current spot rate.

“The index’s breakdown suggests, the latest round of stimulus payments alongside the improving COVID picture is making the US consumer feel pretty good about the economy and their household finances today,” said NAB currency strategist Rodrigo Catril.

ifo index suggests “much more to come”

26 April 2021

Summary: ifo business climate index up again in April; under expected figure; expectations index declines, current conditions index up; index consistent with positive euro-zone GDP growth.


Following a recession in 2009/2010, the ifo Institute’s business climate index largely ignored the European debt-crisis of 2010-2012, remaining at average-to-elevated levels through to early-2020. However, the index was quick to react in the March 2020 survey, falling precipitously. The rebound which began in May of that year was almost as sharp but it was also characterised by a period of below-average readings which lasted until March.

According to the latest figures released by the Institute, its business climate index increased to 96.8 in April. The reading was below the expected reading of 97.8 but 0.2 points above March’s final reading of 96.6. The average reading since January 2005 is just below 97.

In contrast, the expectations index decreased, falling from March’s revised figure of 100.3 to 99.5, also below the generally-expected figure of 101.2. The current situation index rose from 93.1 to 94.1.

“Companies once again raised their assessments of the current business situation. However, they were no longer quite so optimistic about the coming six months. Both the third wave of infections and bottlenecks in intermediate products are impeding Germany’s economic recovery,” said Clemens Fuest, the president of the ifo Institute.

German and French 10-year bond yields slipped a touch. By the close of business, the German 10-year bund yield had inched up 1bp to -0.25% while the French 10-year OAT yield finished unchanged at 0.08%.

Ray Attrill, NAB’s Head of FX Strategy within its FICC division said, “The survey is nonetheless consistent with some lift in activity, with much more to come in the service sector in coming months.”

Conference Board index up; GDP forecast raised

22 April 2021

Summary: US leading index reading above expectations in March; economic momentum increasing in near term; Conference Board raises 2021 forecast.


The Conference Board Leading Economic Index (LEI) is a composite index composed of ten sub-indices which are thought to be sensitive to changes in the US economy. The Conference Board describes it as an index which attempts to signal growth peaks and troughs; turning points in the index have historically occurred prior to changes in aggregate economic activity. Readings from March and April of 2020 signalled “a deep US recession” but then subsequent readings indicated the US economy recovered rapidly.

The latest reading of the LEI indicates it rose by 1.3% in March. The result was double the 0.6% increase which had been generally expected and February’s 0.1% increase after it was revised. On an annual basis, the LEI growth rate increased from -1.3% after revisions to +8.1%.

“The improvement in the US LEI, with all ten components contributing positively, suggests economic momentum is increasing in the near term,” said Ataman Ozyildirim, Senior Director of Economic Research at The Conference Board.

Changes over time can be large but once they are standardised, a clearer relationship with GDP emerges. The latest reading implies a 4.1% year-on-year growth rate in June, up from May’s 0.2%. The Conference Board forecasts a 6.0% expansion across all of calendar 2021, up from their forecast of 5.5% a month ago.

Zero in the chart above represents the average US GDP growth rate from September 2002, or about 1.8% year on year.

US Treasury bond yields ended the day unchanged. At the close of business, 2-year, 10-year and 30-year Treasury yields finished at 0.15%, 1.56% and 2.26% respectively.

Click for more news