JCB find the YieldReport to be an invaluable summary of all debt market activity. Whilst we are focussed on the highest grade bonds it is important to see what is..Angus Coote, Executive Director, JCB Active Bond Fund
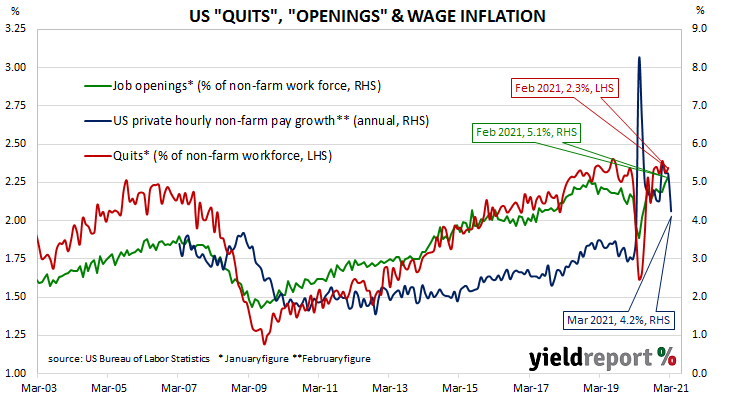
Summary: US quit rate holds in February; “illustrates strength of labour market rebound”; job openings, separations both up.
The number of US employees who quit their jobs as a percentage of total employment increased slowly but steadily after the GFC. It peaked in March 2019 and then tracked sideways until virus containment measures were introduced in March 2020. The quit rate plummeted as alternative employment opportunities rapidly dried up but then recovered back to its pre-pandemic rate in the third quarter of 2020.
Figures released as part of the most recent JOLTS report show the quit rate remained stable in February. 2.3% of the non-farm workforce left their jobs voluntarily, the same rate as in January. While there were 51,000 additional quits, the number of people employed in the non-farm sector grew by 468,000, leaving the quit rate unchanged after rounding.
Long-term US Treasury bond yields fell moderately on the day. By the close of business, the 10-year Treasury yield had lost 4bps to 1.66% and the 30-year yield had shed 3bps to 2.32%. The 2-year yield finished unchanged at 0.15%.
“While this data lags the payrolls report, it illustrates the strength of the labour market rebound and the ability for it to persist over coming months,” said ANZ senior economist Catherine Birch.
The largest sources of additional quits came from the “State & local government” and “Other services” sectors while the “Finance & insurance” sector experienced the greatest decline. Overall, the total number of quits for the month rose from January’s revised figure of 3.306 million to 3.357 million.
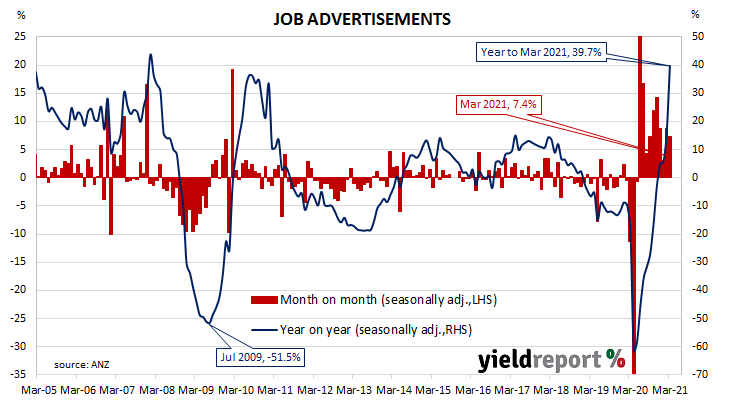
Summary: Job ads up again in March; near-40% growth over past 12 months; well above pre-COVID level; “growing labour demand” should soften effects of end of JobKeeper.
From mid-2017 onwards, year-on-year growth rates in the total number of Australian job advertisements consistently exceeded 10%. That was until mid-2018 when the annual growth rate fell back markedly. 2019 was notable for its reduced employment advertising and this trend continued into the first quarter of 2020. Figures plunged in April 2020 as pandemic restrictions took effect but then recovered relatively quickly.
According to the latest ANZ figures, total advertisements increased by 7.4% in March on a seasonally-adjusted basis. The rise followed an 8.8% increase in February and a 3.0% gain in January after revisions. On a 12-month basis, total job advertisements were 39.7% higher than in March 2020, up from February’s comparable figure of 15.5%.
“Six months ago, our view was that ANZ Job Ads would need to sustain levels materially higher than pre-pandemic in order to entrench the labour market recovery. ANZ Job Ads has done better than that, now 23% above its pre-COVID level and at a 12-year high,” said ANZ senior economist Catherine Birch.
Commonwealth bond yields fell on the day. By the close of business, the 3-year ACGB yield had slipped 1bps to 0.26%, the 10-year yield had lost 4bps to 1.75% and the 20-year yield finished 3bps lower at 2.46%.
Birch thinks the end of the JobKeeper programme will not be quite as detrimental to overall employment numbers “as growing labour demand elsewhere should mean many workers find a new job relatively quickly.”
She expects “a temporary rise” in the June quarter’s unemployment rate before it resumes falling in the second half of the year.
The inverse relationship between job advertisements and the unemployment rate has been quite strong (see below chart), although ANZ themselves called the relationship between the two series into question in early 2019. A rising number of job advertisements as a proportion of the labour force is suggestive of lower unemployment rates in the near-future. A falling ratio suggests higher unemployment rates will follow.
March US payrolls beats estimates, “momentum building”
02 April 2021
Summary: March non-farm payrolls increase much more than expected; January, February figures revised up; jobless rate declines, participation rate up; “more momentum building”; jobs-to-population ratio up again; underemployment rate falls below 11%; hourly pay growth slows.
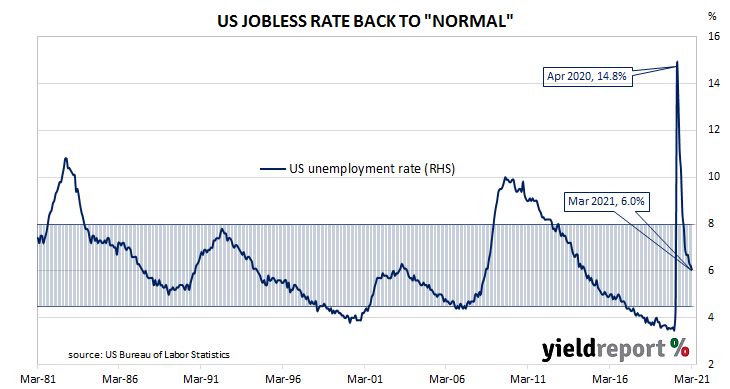
The US economy ceased producing jobs in net terms as infection controls began to be implemented in March 2020. The unemployment rate had been around 3.5% but that changed as job losses began to surge through March and April of 2020. The May 2020 non-farm employment report represented a turning point and subsequent months provided substantial employment gains. Changes in recent months have been more modest but mostly positive.
According to the US Bureau of Labor Statistics, the US economy created an additional 916,000 jobs in the non-farm sector in March. The increase was well above the 600,000 which had been generally expected earlier in the week and almost double the 468,000 jobs which had been added in February after revisions. Employment figures for January and February were revised up by a total of 156,000.
The unemployment rate declined again, from February’s rate of 6.2% to 6.0%. The total number of unemployed decreased by 262,000 to 9.710 million while the total number of people who are either employed or looking for work increased by 347,000 to 160.558 million. The additional number of people in the labour force led to rise in the participation rate from February’s rate of 61.4% to 61.5%.
ANZ economist Hayden Dimes said, “While employment remains down on its pre-pandemic peak by more than eight million, increased fiscal stimulus alongside an accelerating pace of vaccine rollout suggests there’s plenty more momentum building in the pipeline.”
US Treasury yields rose moderately on the day. By the close of business, the 2-year bond yield had added 2bps to 0.18%, the 10-year yield had gained 4bps to 1.72% and the 30-year yield finished 2bps higher at 2.36%.
One figure which is indicative of the “spare capacity” of the US employment market is the employment-to-population ratio. This ratio is simply the number of people in work divided by the total US population. It hit a cyclical-low of 58.2 in October 2010 before slowly recovering to just above 61% in late-2019. March’s reading increased from 57.6% to 57.8%, continuing a rising trend which began in May 2020.
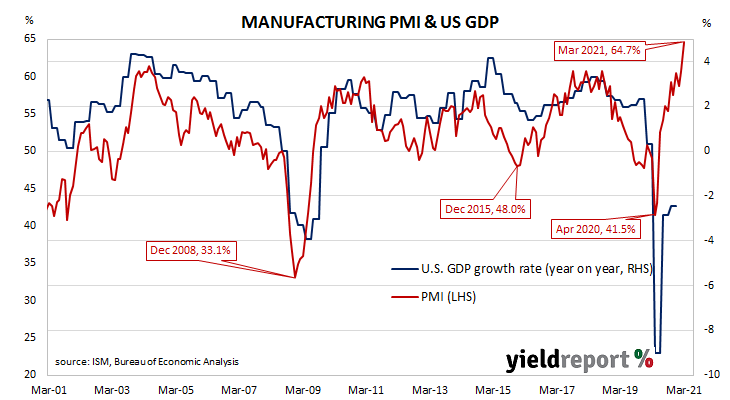
Summary: ISM purchasing managers index (PMI) up; above consensus expectation; highest reading since 1983; implies US economy growing at rapid pace.
US purchasing managers’ index (PMI) readings reached a cyclical peak in September 2017 before they started a downtrend which ended in March 2020 with a contraction in US manufacturing which lasted until June 2020. Subsequent month’s readings implied growth had resumed and the early months of 2021 have provided elevated readings.
According to the latest Institute of Supply Management (ISM) survey, its Purchasing Managers Index recorded a reading of 64.7% in March. The result was above the generally expected figure of 60.5% and higher than February’s reading of 60.8%. The average reading since 1948 is 52.9% and any reading above 50% implies an expansion in the US manufacturing sector relative to the previous month.
ANZ economist Hayden Dimes noted the index had “reached its highest level since 1983”, pushed “by the strongest orders and production readings in 17 years.”
Long-term US Treasury bond yields fell noticeably on the day while shorter-term yields remained stable. By the close of business, the 2-year Treasury bond yield remained unchanged at 0.16%, the 10-year yield had shed 6bps to 1.68% while the 30-year yield finished 7bps lower at 2.34%.
Purchasing Managers’ Indices (PMIs) are economic indicators derived from monthly surveys of executives in private-sector companies. They are diffusion indices, which means a reading of 50% represents no change from the previous period, while a reading under 50% implies respondents reported a deterioration on average. According to the ISM, a reading “above 42.8%, over a period of time, generally indicates an expansion of the overall economy,”
Manufacturing PMI figures appear to lead US GDP by several months despite a considerable error in any given month. The chart below shows US GDP on a “year on year” basis (and not the BEA annualised basis) against US GDP implied by monthly PMI figures.
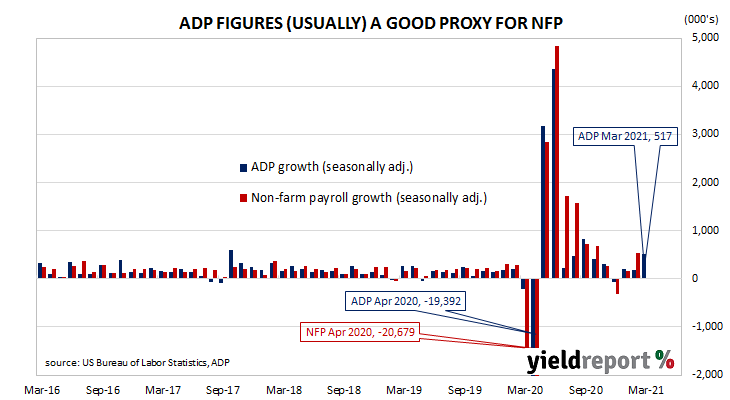
Hospitality sector leads gains in ADP March report
31 March 2021
Summary: ADP payroll numbers increase in March; slightly more than consensus figure; February increase revised up; led by leisure/hospitality sector as restrictions eased; figures up across firms of all sizes; gains in both goods and services sectors.
The ADP National Employment Report is a monthly report which provides an estimate of US non-farm employment in the private sector. Since publishing of the report began in 2006, its employment figures have exhibited a high correlation with official non-farm payroll figures, although a large difference can arise in any individual month.
The latest ADP report indicated private sector employment increased by 517,000 in March, slightly more than the 500,000 which had been generally expected. February’s increase was revised up by 59,000 to 176,000.
“The rise in employment was led by leisure and hospitality, possibly reflecting that many states in the US have been relaxing COVID restrictions,” said ANZ economist Daniel Been.
US Treasury yields moved almost-uniformly higher across the curve on the day. By the close of business, 2-year and 10-year Treasury bond yields had each gained 2bps to 0.16% and 1.74% respectively while the 30-year yield finished 3bps higher at 2.41%.
In terms of US Fed policy, expectations of any change in the federal funds rate over the next 12 months remained soft. Federal funds futures contracts for March 2022 implied an effective federal funds rate of 0.10%, just 3bps above the current spot rate.
Employment numbers in net terms increased across businesses of all sizes, with gains fairly evenly distributed. Firms with less than 50 employees filled a net 174,000 positions, mid-sized firms (50-499 employees) gained 188,000 positions while large businesses (500 or more employees) accounted for 155,000 additional employees.
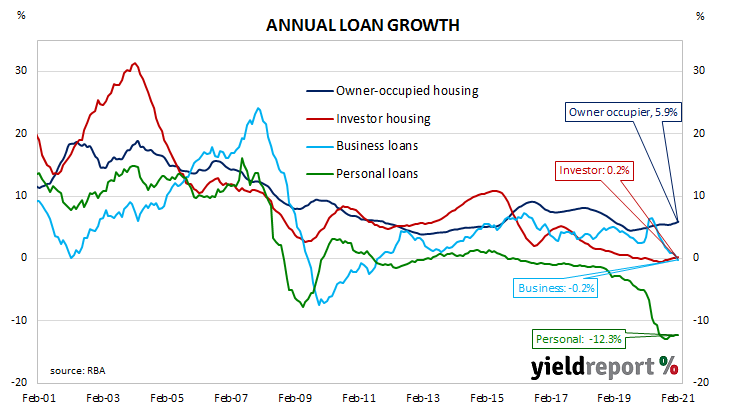
Summary: Private sector credit maintains modest growth rate in February; under expected figure; “turned the corner”; housing credit growth continues, business loans steady; past three months data a “significant turnaround” from mid-2020.
The pace of lending to the non-bank private sector by financial institutions in Australia has been trending down since late-2015. Private sector credit growth appeared to have stabilised in the September quarter of 2018 but the annual growth rate then continued to deteriorate through to the end of 2019. The early months of 2020 provided some positive signs but they disappeared in April and have not re-emerged as yet.
According to the latest RBA figures, private sector credit growth continued at a modest rate in February, rising by 0.2%. The result was under the generally expected figure of 0.3% but in line with January’s increase. The annual growth rate slipped from 1.7% in January to 1.6%.
“Credit to the private sector, while soft early in 2020, has turned the corner,” said senior Westpac senior economist Andrew Hanlan.
Owner-occupier and investor loans accounted for all the net growth over the month. Lending to the business sector was flat and personal debt fell again.
Commonwealth bond yields moved very little on the day. At the close of business, the 3-year yield ACGB remained unchanged at 0.29%, the 10-year yield had crept up 1bp to 1.82% while the 20-year yield finished 1bp lower at 2.49%.
The traditional driver of loan growth rates, the owner-occupier segment, grew by 0.6% over the month, slightly faster than January’s 0.5%. The sector’s 12-month growth rate accelerated from 5.7% to 5.9%.
Growth rates in the business sector remained sluggish and business credit remained unchanged after rounding, up from -0.1% in January. The segment’s annual growth rate went into reverse, slowing from January’s rate of 0.5% to -0.2%.
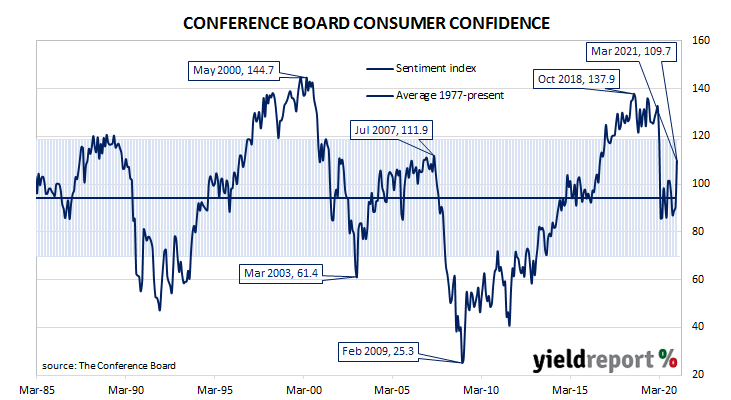
“More free money” drives March jump in US sentiment
30 March 2021
Summary: US consumer confidence up in March; Conference Board index increases considerably more than expected; views of present conditions, future conditions both improve significantly; economic growth “likely to strengthen” but inflation concerns harden; rise in index described as “eye-popping”, attributed to “more free money” soon to hit households.
After the GFC in 2008/09, US consumer confidence clawed its way back to neutral over a number of years and then went from strength to strength until late 2018. Measures of consumer confidence then oscillated within a fairly narrow band at historically high levels until they plunged in early 2020. Subsequent readings then fluctuated around the long-term average.
The latest Conference Board survey held during the first half of March indicated US consumer confidence improved for a third consecutive month. March’s Consumer Confidence Index registered 109.7, well above the median consensus figure of 96 and considerably higher than February’s final figure of 90.4. Consumers’ views of present conditions and future conditions both improved significantly compared to those held at the time of the previous survey.
Lynn Franco, a senior director at The Conference Board, said the figures were “an indication that economic growth is likely to strengthen further in the coming months.” However, she noted respondents disclosed greater concerns regarding short-term inflation, “most likely due to rising prices at the pump…” which “may temper spending intentions in the months ahead.”
US Treasury bond yields reacted in a haphazard fashion on the day. By the close of business, the 2-year Treasury bond yield remained unchanged at 0.14%, the 10-year yield had inched up 1bp to 1.72% while the 30-year yield finished 4bps lower at 2.37%.
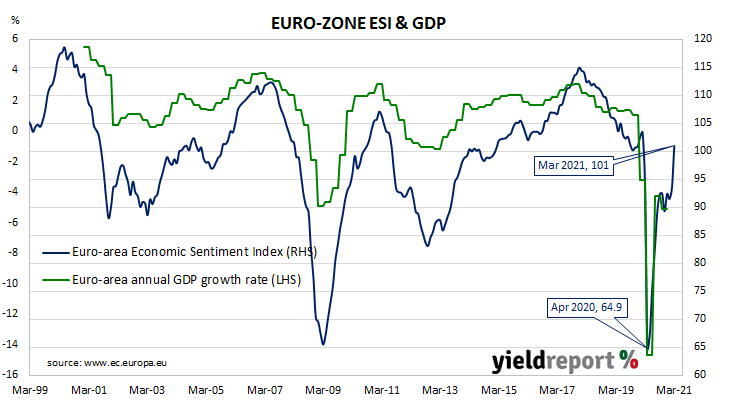
Summary: Euro-zone composite sentiment index up; above expectations; all industry sectors improve; readings from major euro-zone economies all up; sovereign bond yields up moderately; index implies GDP growth to end of March.
The European Commission’s Economic Sentiment Indicator (ESI) is a composite index comprised of five differently-weighted sectoral confidence indicators. It is heavily weighted towards confidence surveys from the business sector, with the consumer confidence sub-index only accounting for 20% of the ESI. However, it has a good relationship with euro-zone GDP, although not as a leading indicator.
The ESI produced a reading of 101.0 in March, above the market’s expected figure of 95.0 and considerably more than February’s reading of 93.4. The average reading since 1985 has been just under 100.
Confidence improved across all five of the industry, retail trade, construction, services and consumer sub-indices. On a geographical basis, the ESI rose in all major economies, with Germany recording a record monthly increase.
German and French 10-year bond yields finished the day moderately higher. By the close of business, the German bund yield had gained 3bps to -0.29% and the French OAT yield had added 4bps to -0.03%.
End-of-quarter ESI and annual euro-zone GDP growth rates are highly correlated. This latest reading corresponds to a year-to-March growth rate of 1.6%, up from February’s comparable reading of 0.1%.
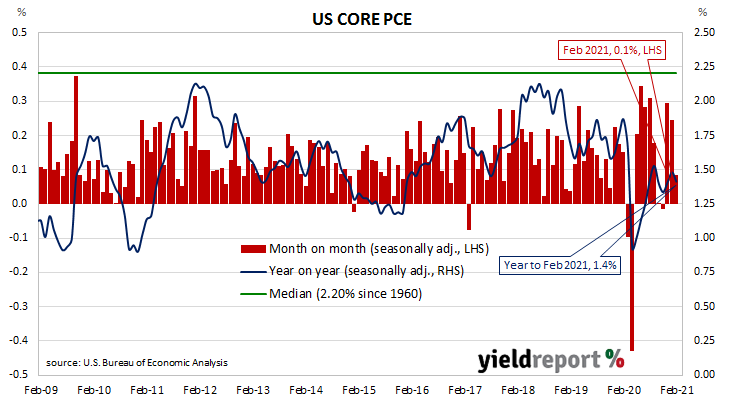
US bond yields up despite mundane core PCE inflation figures
26 March 2021
Summary: US Fed’s favoured inflation measure up in February; in line with market expectations; annual rate unchanged; long-term Treasury bond yields up.
One of the US Fed’s favoured measures of inflation is the change in the core personal consumption expenditures (PCE) price index. After hitting the Fed’s target at the time of 2.0% in mid-2018, the annual rate then hovered in a range between 1.8% and 2.0% before it eased back to a range between 1.5% and 1.8% through 2019. It then plummeted below 1.0% in April 2020 before rising back to around 1.5% in the September quarter.
The latest figures have now been published by the Bureau of Economic Analysis as part of the February personal income and expenditures report. Core PCE prices rose by 0.1% over the month, in line with the generally expected figure but less than January’s 0.2% increase after it was revised down from 0.3%. On a 12-month basis, the core PCE inflation rate remained steady at 1.4% after January’s comparable figure was revised down from 1.5%.
Long-term US Treasury bond yields rose on the day. By the close of business, the 10-year Treasury bond yield had gained 5bps to 1.68% and the 30-year yield had increased by 4bps to 2.39%. The 2-year yield finished unchanged at 0.14%.
The core version of PCE strips out energy and food components, which are volatile from month to month, in an attempt to identify the prevailing trend. It’s not the only measure of inflation used by the Fed; it also tracks the Consumer Price Index (CPI) and the Producer Price Index (PPI) from the Department of Labor. However, it is the one measure that is most often referred to in FOMC minutes.
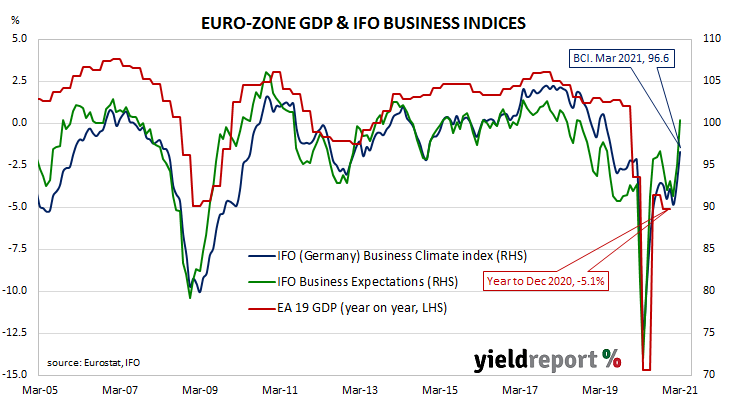
Summary: ifo business climate index up again in March; higher than expected figure; highest value since mid-2019; index now implies positive euro-zone GDP growth.
Following a recession in 2009/2010, the ifo Institute’s business climate index largely ignored the European debt-crisis of 2010-2012, remaining at average-to-elevated levels through to early-2020. However, the index was quick to react in the March 2020 survey, falling precipitously. The rebound which began in May was almost as sharp but subsequent readings then stagnated at below-average levels.
According to the latest figures released by the Institute, its business climate index increased to 96.6 in March, ending a run of readings near 90. The reading was above the expected reading of 93.2 and 3.9 points above February’s final reading of 92.7. The average reading since January 2005 is just below 97.
The expectations index also increased, rising from February’s revised figure of 95.0 to 100.4, also above the generally-expected figure of 95.0. The current situation index rose from 90.6 to 93.0.
“This is its highest value since June 2019. Companies were clearly more satisfied with their current business situation. Optimism about the coming months has also returned. Despite the rising rate of infections, the German economy is entering the spring with confidence,” said Clemens Fuest, the president of the ifo Institute.
German and French 10-year bond yields declined moderately on the day. By the close of business, the German 10-year bund yield had gained 4bps to -0.35% and the French 10-year OAT yield had added 3bps to -0.11%.
The ifo Institute’s business climate index is a composite index which combines German companies’ views of current conditions with their outlook for the next six months. It has similarities to consumer sentiment indices in the US such as the ones produced by The Conference Board and the University of Michigan.
It also displays a solid correlation with euro-zone GDP.