JCB find the YieldReport to be an invaluable summary of all debt market activity. Whilst we are focussed on the highest grade bonds it is important to see what is..Angus Coote, Executive Director, JCB Active Bond Fund
Summary: Euro-zone households more optimistic in March; index well-above consensus expectation; back above long-term average; major euro-zone bond yields slip.
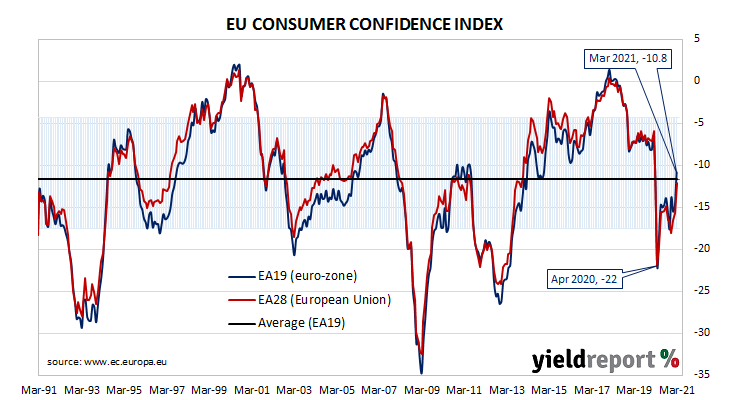
EU consumer confidence plunged during the GFC and again in 2011/12 during the European debt crisis. After bouncing back through 2013 and 2014, it fell back significantly in late 2018 but only to a level which corresponds to significant optimism among households. Following the plunge which took place in April 2020, a recovery of sorts began a month later.
The March survey conducted by the European Commission indicated its Consumer Confidence index increased to -10.8. The reading was well above the -16.0 which had been generally expected and February’s figure of -14.8. The average reading since the beginning of 1985 is -11.7.
Sovereign bond yields declined a touch in major European bond markets on the day. By the end of it, German and French 10-year bond yields had each slipped 1bp to -0.35% and -0.12% respectively.
Conference Board leading index misses; still on track for strong 2021
18 March 2021
Summary: US leading index reading below expectations in February; vaccinations, fiscal supports not yet fully reflected; Conference Board raises 2021 forecast; “signs of weakness” among some index components, from temporary factors.
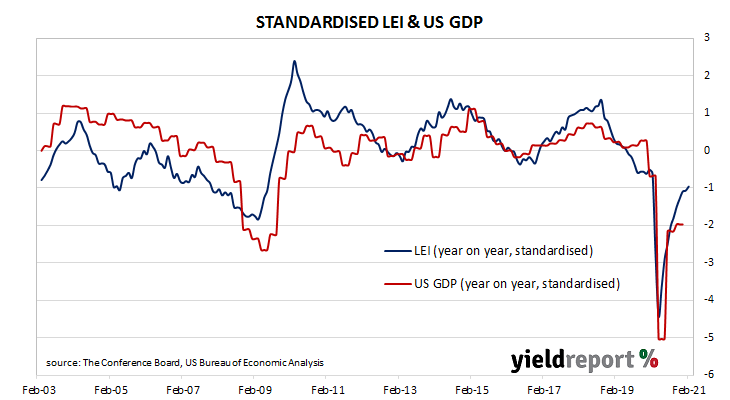
The Conference Board Leading Economic Index (LEI) is a composite index composed of ten sub-indices which are thought to be sensitive to changes in the US economy. The Conference Board describes it as an index which attempts to signal growth peaks and troughs; turning points in the index have historically occurred prior to changes in aggregate economic activity. Readings from March and April signalled “a deep US recession”; more recent readings indicated the US recovery is still underway, albeit at a slowing pace.
The latest reading of the LEI indicates it rose by 0.2% in February. The result was less than the 0.3% increase which had been generally expected and January’s 0.5% increase. However, on an annual basis, the LEI growth rate increased from -1.4% after revisions to -1.0%.
Ataman Ozyildirim, Senior Director of Economic Research at The Conference Board said “economic growth should continue well into this year.” He noted “the acceleration of the vaccination campaign and a new round of large fiscal supports are not yet fully reflected in the LEI.”
Changes over time can be large but once they are standardised, a clearer relationship with GDP emerges. The latest reading implies a 0.3% year-on-year growth rate in May, up from April’s 0.1%. The Conference Board forecasts a 5.5% expansion across all of calendar 2021, up from their forecast of 4.4% a month ago.
Zero in the chart above represents the average US GDP growth rate from September 2002, or about 1.8% year on year.
Jobless rate tumbles in Feb; 2020 job losses regained
18 March 2021
Summary: Employment grows in February; employment number increase significantly larger than expected figure; aggregate job losses from 2020 now recovered; data “remarkable”, requires confirmation; participation rate unchanged; fewer people seeking work, larger available workforce sends jobless rate below 6%; fewer part-time jobs, more full-time jobs; work hours rise markedly; underemployment rate up; “total labour market slack still elevated”.
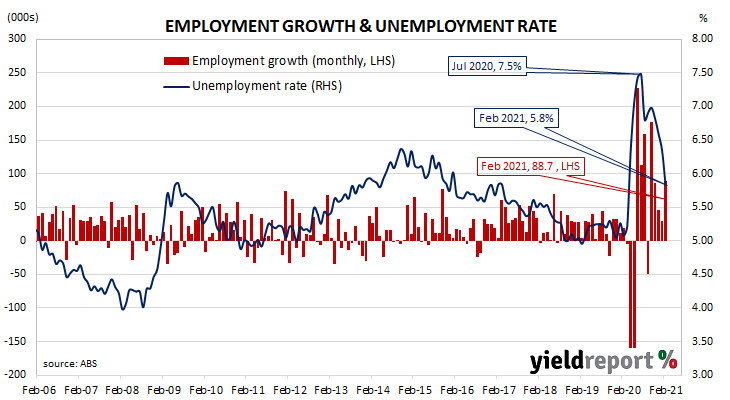
Australia’s period of falling unemployment came to an end in early 2019 when the jobless rate hit a low of 4.9%. It then averaged around 5.2% through to March 2020, bouncing around in a range from 5.1% to 5.3%. Leading indicators such as ANZ’s Job Ads survey and NAB’s capacity utilisation estimate suggested the unemployment rate would rise in the June 2020 quarter and it did so, sharply. The jobless rate peaked in July before falling below 7% in August. Since then, it has continued to trend lower.
The latest Labour force figures have now been released and they indicate the number of people employed in Australia according to ABS definitions increased by 88,700 in February. The rise was more than January’s 29,500 increase and significantly larger than the generally expected figure of 30,000.
“Nationally, before COVID hit, the level of employment peaked in February 2020 at 13.0 million, meaning after today’s gains, employment has recovered the aggregate job losses,” said UBS economist George Tharenou.
Domestic Treasury bond yields moved higher across the curve, outpacing overnight movements of their US Treasury bond counterparts. By the end of the day, the 3-year ACGB yield had gained 3bps to 0.29%, the 10-year yield had increased by 6bps to 1.82% while the 20-year yield finished 8bps higher at 2.52%.
In the cash futures market, expectations of a change in the actual cash rate, currently at 0.03%, remained largely stable, although 2022 contracts crept up a little. At the end of the day, contract prices implied the cash rate would inch up slowly to around 0.10% by mid-2022.
“The labour market data is remarkable, and materially stronger than expected by such a large margin that we cautiously wait for another print to confirm the scale of improvement, given the potentially large statistical errors in such a small sample in the LFS,” said Tharenou.
The participation rate remained unchanged from January’s 66.1% as the total available workforce increased by 18,800 to 13,812,100. The number of unemployed persons dropped by 69,900 to 805,200; the lower unemployment number in conjunction with the increase in the number of people in the workforce led to a fall in the unemployment rate from 6.3% to 5.8%.
Severe weather, supply chains drag on US Feb output
16 March 2021
Summary: US output contracts in February; fall in contrast to expected figure; cold weather, supply chain issues blamed; capacity utilisation rate drops back to November level.
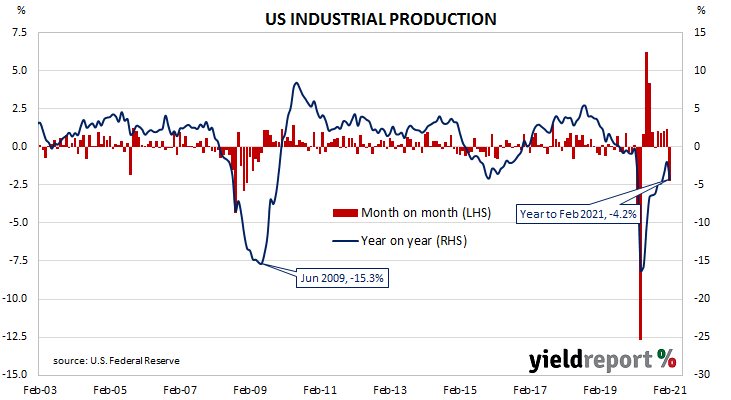
The Federal Reserve’s industrial production (IP) index measures real output from manufacturing, mining, electricity and gas company facilities located in the United States. These sectors are thought to be sensitive to consumer demand and so some leading indicators of GDP use industrial production figures as a component.
Production began recovering in May 2020 and subsequent months after collapsing in the previous two months.
US industrial production contracted by 2.2% on a seasonally adjusted basis in February, the first negative result since September. The result was in contrast to the 0.6% increase which had been generally expected and January’s 1.1% rise after it was revised up from 0.9%. On an annual basis, the contraction rate increased from January’s revised figure of -2.0% to -4.2%
NAB senior economist David de Garis pointed to the Fed’s statement that “‘severe winter weather in the south central region of the country in mid-February accounted for the bulk of the declines in output for the month.”. Westpac economist Lochlan Halloway noted there also were “some supply chain issues.”
The report was released on the same day as February’s retail sales numbers and, despite the soft figures, longer-term US Treasury bond yields moved a little higher. By the end of the day, the 10-year Treasury yield had inched up 1bps to 1.62% and the 30-year yield had added 2bps to 2.38%. The 2-year yield remained unchanged at 0.15%.
The same report includes US capacity utilisation figures which are generally accepted as an indicator of future investment expenditure and/or inflationary pressures. Capacity usage had hit a high for the last business cycle in early 2019 before it began a downtrend which ended with April 2020’s multi-decade low of 64.2%. February’s reading fell from January’s revised figure of 75.5% from 73.8%, a similar level to that of November.
US retail falters in Feb, March stimulus lift expected
16 March 2021
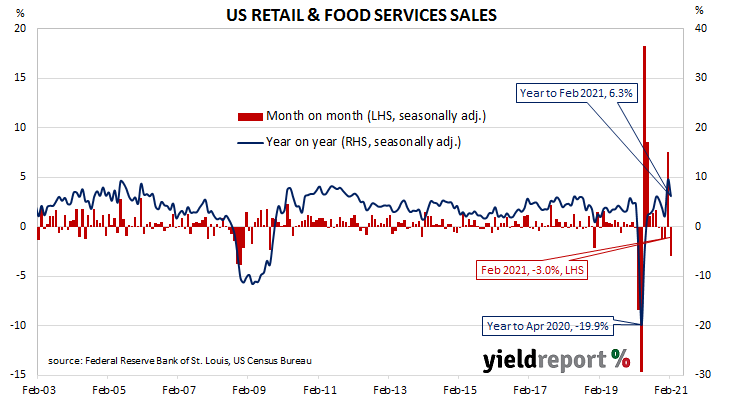
Summary: US retail sales drop in February; fall significantly larger than expected figure; credit card, debit card trackers suggest spending lift in early March, ahead of stimulus payments; falls in all retail categories bar one; “vehicles and parts”, “non-store retailers” the largest influences on total.
US retail sales had been trending up since late 2015 but, commencing in late 2018, a series of weak or negative monthly results led to a drop-off in the annual growth rate below 2.0% by the end of that year. Growth rates then increased in trend terms through 2019 and into early 2020 until pandemic restrictions sent it into negative territory. A “v-shaped” recovery then took place but more recent growth rates have been somewhat volatile.
According to the latest “advance” sales numbers released by the US Census Bureau, total retail sales dropped by 3.0% in February. The fall was significantly lower than the 0.3% decline which had been generally expected and in stark contrast to January’s 7.6% increase after it was revised up from 5.3%. On an annual basis, the growth rate increased from January’s revised figure of 9.5% to 6.3%.
The report was released on the same day as February’s industrial production numbers and, despite the soft figures, longer-term US Treasury bond yields moved a little higher. By the end of the day, the 10-year Treasury yield had inched up 1bps to 1.62% and the 30-year yield had added 2bps to 2.38%. The 2-year yield remained unchanged at 0.15%.
NAB senior economist David de Garis said, “As for next month, JPMorgan and BofA’s respective trackers of credit-and-debit-card transactions shows a lift in spending in early March even ahead of the stimulus payments.”
All categories bar one recorded lower sales over the month. The “Motor vehicle & parts dealers” and “Non-store retailers” segments provided the largest influences on the overall result. Sales in these segments decreased by 4.2% and 5.4% respectively over the month. However, both segments’ sales increased by 9.2% and 25.9% respectively on an annual basis.
Leading index declines, still at “above-trend” rate
16 March 2021
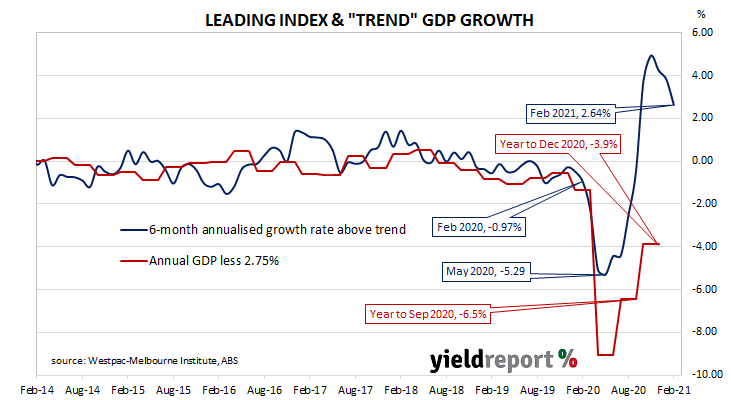
Summary: Leading index declines in February; continues likelihood of above-trend growth; reading implies annual GDP growth to rise to around 5.5% during first half of 2021; RBA February GDP forecasts expected to be exceeded.
Westpac and the Melbourne Institute describe their Leading Index as a composite measure which attempts to estimate the likely pace of Australian economic growth over the next three to six months. After reaching a peak in early 2018, the index trended lower through 2018 and 2019 before plunging to recessionary levels in the second quarter of 2020. Readings from the third and fourth quarters have been markedly higher.
The latest reading of the six month annualised growth rate of the indicator declined in February, from January’s revised figure of +3.83% to +2.64%.
Index figures represent rates relative to trend-GDP growth, which is generally thought to be around 2.75% per annum. The index is said to lead GDP by three to six months, so theoretically the current reading represents an annual GDP growth rate of around 5.5% in the second or third quarters of 2021.
Long-term Commonwealth Government bond yields moved moderately higher on the day, slightly outpacing rises in US Treasury bond markets overnight. By the end of the day, the 10-year ACGB yield had gained 3bps to 1.76% and the 20-year yield had increased by 4bps to 2.44%. The 3-year yield finished unchanged at 0.26%.
“From our perspective the key driver of growth in 2021 will be the household sector as a sharp fall in the currently elevated savings rate will free up considerable funds to support strong consumer spending,” said Westpac Chief Economist Bill Evans.
The RBA’s February Statement on Monetary Policy forecast GDP for the years ending June 2021 and December 2021 to be 8.0% and 3.5% respectively. Should the RBA’s forecasts prove to be accurate, an increase of just 1.3% across the March and June quarters is implied. Evans currently expects an increase of 1.6% in the March quarter alone.
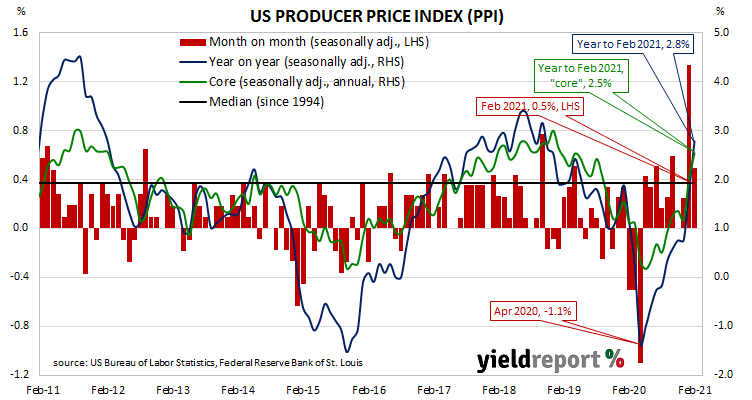
Summary: Prices received by producers increase in February, above expectations; smaller “core” PPI increase; most of rise from higher goods prices.
Around the end of 2018, the annual inflation rate of the US producer price index (PPI) began a downtrend which then continued through 2019. Months in which producer prices increased suggested the trend may have been coming to an end, only for it to continue, culminating in a plunge in April 2020. Figures returned to “normal” towards the end of the year and annual rates are now above average.
The latest figures published by the Bureau of Labor Statistics indicate producer prices rose by 0.5% after seasonal adjustments in February. The increase was above the 0.4% rise which had been generally expected but considerably less than January’s 1.3% jump. On a 12-month basis, the rate of producer price inflation after seasonal adjustments increased from 1.8% to 2.8%.
PPI inflation excluding foods and energy rose by just 0.2% after recording a 1.2% increase in December and a 0.1% increase in November. The annual rate accelerated from 2.0% to 2.5%.
US Treasury bond yields moved higher on the day, especially at the long-end. By the close of business, the 2-year yield had inched up 1bp to 0.15%, the 10-year yield had gained 9bps to 1.63% and the 30-year yield finished 8bps higher at 2.38%.
The BLS stated higher prices for final demand goods accounted for “most” of the month’s increase after they rose by 1.4% on average. Prices of final demand services rose by just 0.1%.
The producer price index (PPI) is a measure of prices received by producers for domestically produced goods, services and construction. It is put together in a fashion similar to the consumer price index (CPI) except it measures prices received from the producer’s perspective rather than from the perspective of a retailer or a consumer. It is another one of the various measures of inflation tracked by the US Fed, along with core personal consumption expenditure (PCE) price data.
Summary: US consumer confidence improves in March; University of Michigan index above consensus figure; views of present, future conditions both improve; gains widespread across all subgroups, regions; under-35s noticeably more confident; consumers “responding well” to fiscal package, vaccine rollout; jobs market.
US consumer confidence started 2020 at an elevated level. However, by March, surveys had begun to reflect a growing uneasiness with the global spread of COVID-19 and its reach into the US. After a plunge in April 2020, household confidence recovered in a haphazard fashion. Recent reading have consistently remained at below-average levels. However, there are now signs this situation may change in coming months.
The latest survey conducted by the University of Michigan indicates the average confidence level of US households lifted in March after deteriorating for two consecutive months. The University’s preliminary reading from its Index of Consumer Sentiment registered 80.0, above the generally expected figure of 78.0 and higher than February’s final figure of 76.2. Consumers’ views of current conditions and their expectations regarding future conditions both improved in comparison to those held at the time of the February survey.
“Consumer sentiment rose in early March to its highest level in a year due to the growing number of vaccinations as well as the widely anticipated passage of Biden’s relief measures,” said the University’s Surveys of Consumers chief economist, Richard Curtin. He said “gains were widespread across all socioeconomic subgroups and all regions” and noted the group which had consistently led past recoveries, the under-35s, was noticeably more confident than older groups.
US Treasury bond yields moved higher on the day, especially at the long-end. By the close of business, the 2-year yield had inched up 1bp to 0.15%, the 10-year yield had gained 9bps to 1.63% and the 30-year yield finished 8bps higher at 2.38%.
ANZ economist Hayden Dimes said, “Consumers are responding well to Biden’s fiscal package, the vaccine rollout and firmness in the jobs market.”
More-confident households are generally inclined to spend more and save less; some increase in household spending could be expected to follow. As private consumption expenditures account for a majority of GDP in advanced economies, a higher rate of household spending growth would flow through to higher GDP growth if other GDP components did not compensate.
Euro-zone output recovers, annual rate back above zero
12 March 2021
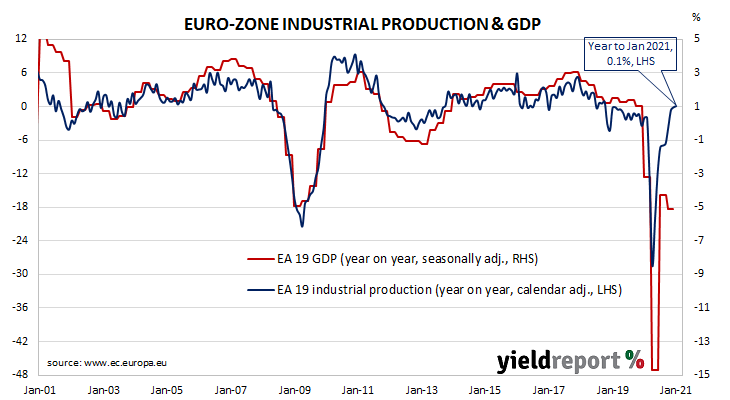
Summary: Euro-zone industrial production increases in January; rise in contrast to expected fall; annual growth rate back above zero.
Following a recession in 2009/2010 and the debt-crisis which flowed from it, euro-zone industrial production recovered and then reached a peak four years later in early 2016. Growth rates then fluctuated through 2016/2017 before beginning a steady and persistent slowdown from the start of 2018. That decline was transformed into a plunge in March and April of 2020 but subsequent months in 2020 produced an almost-complete recovery.
According to the latest figures released by Eurostat, euro-zone industrial production increased by 0.8% in January on a seasonally-adjusted and calendar-adjusted basis. The rise was in contrast to the 0.2% contraction which had been generally expected and December’s -0.1% after revisions. On an annual basis, the calendar-adjusted growth rate increased from December’s revised rate of -0.1% to +0.1%.
German and French 10-year sovereign bond yields moved higher on the day. By the close of business, the German and French 10-year yields had each gained 3bps to -0.31% and -0.06% respectively.
Industrial production growth expanded in only two of the euro-zone’s four largest economies. Germany’s production contracted by 0.4% while the comparable figures for France, Italy and Spain were +3.4%, +1.0% and -0.7% respectively.
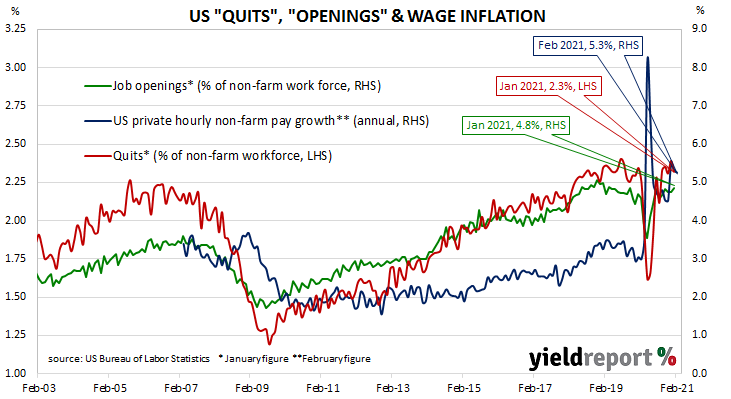
US quit rate slips while openings total beats estimates
11 March 2021
Summary: US quit rate slips in January; job openings up, separations down; job openings number more than expected.
The number of US employees who quit their jobs as a percentage of total employment increased slowly but steadily after the GFC. It peaked in March 2019 and then tracked sideways until virus containment measures were introduced in March 2020. The quit rate plummeted as alternative employment opportunities rapidly dried up but then recovered quite quickly over the remainder of 2020.
Figures released as part of the most recent JOLTS report show the quit rate slipped back in January. 2.3% of the non-farm workforce left their jobs voluntarily, a slightly lower rate than December’s revised rate of 2.4%. The fall was led by fewer quits in the “Wholesale trade” and “Accommodation and food services” sectors and together, these two sectors accounted for nearly 60% of the decrease, while the “Finance & insurance” sector experienced the greatest increase. Overall, the total number of quits for the month fell by 96,000 from December’s revised figure of 3.407 million to 3.311 million.
Short-term US Treasury bond yields declined while longer-term yields increased on the day. By the close of business, the 2-year Treasury yield had lost 2bps to 0.14%, the 10-year yield had gained 2bps to 1.54% and the 30-year yield finished 5bps higher at 2.29%.
“More jobs are also becoming available, with job openings data for January lifting to 6.9 million. This was well above the 6.6 million expected, but the challenge remains to match the skills of those out of work with jobs available,” said ANZ economist Adelaide Timbrell.
Total vacancies at the end of January increased by 165,000, or 2.4%, from December’s revised figure of 6.752 million to 6.917 million, driven by a 62,000 rise in the “Other services” sector. 123,000 fewer openings in the “Accommodation and food services” sector provided the single largest offset. Overall, 14 out of 18 sectors experienced more job openings than in the previous month.