News

Westpac-MI leading index falls back in March; weak growth expected over 2024

17 April 2024

Summary: Leading index growth rate down in March; update points to Australia’s sub-trend growth continuing throughout 2024; reading implies annual GDP growth of around 2.5%; ACGB yields rise; rate-cut expectations soften; persistently soft results suggest growth will remain weak over remainder of year.

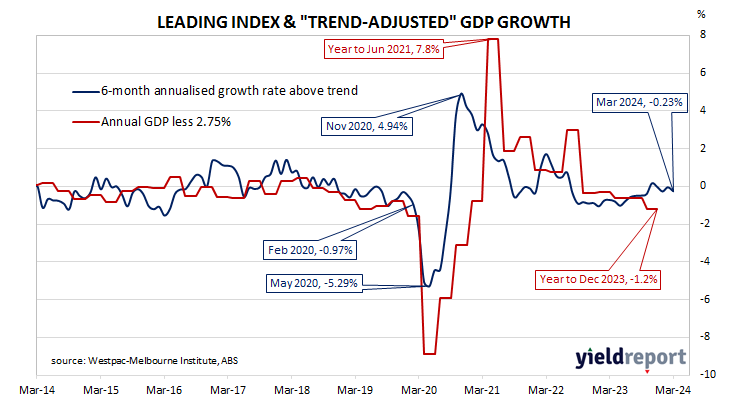
Westpac and the Melbourne Institute describe their Leading Index as a composite measure which attempts to estimate the likely pace of Australian economic growth in the short-term. After reaching a peak in early 2018, the index trended lower through 2018 and 2019 before plunging to recessionary levels in the second quarter of 2020. Subsequent readings spiked towards the end of 2020 but then trended lower through 2021 and 2022 before flattening out in 2023.

March’s reading has now been released and the six month annualised growth rate of the indicator registered -0.23%, down from February’s revised figure of -0.03%.

“The latest Leading Index update points to Australia’s sub-trend growth performance continuing throughout 2024,” said Westpac senior economist Matthew Hassan. “Despite some improvement over the last six months, and a brief one month lift into positive late last year, the Index growth rate has been stuck firmly below zero in early 2024.”

Index figures represent rates relative to “trend” GDP growth, which is generally thought to be around 2.75% per annum in Australia. The index is said to lead GDP by “three to nine months into the future” but the highest correlation between the index and actual GDP figures occurs with a three-month lead. The current reading is thus indicative of an annual GDP growth rate of around 2.5% in the next quarter.

Domestic Treasury bond yields rose nearly uniformly along the curve on the day, largely in line with movements of US Treasury yields on Tuesday night. By the close of business, 3-year and 10-year ACGB yields had both gained 6bps to 3.93% and 4.40% respectively while the 20-year yield finished 4bps higher at 4.68%.

In the cash futures market, expectations regarding rate cuts in the next twelve months softened.  At the end of the day, contracts implied the cash rate would remain close to the current rate for the next few months and average 4.305% through May and 4.29% in June. However, August contracts implied a 4.25% average cash rate, November contracts implied 4.195%, while May 2025 contracts implied 4.045%, 28bps less than the current rate.

“While not overly concerning…the persistently soft results suggest growth will remain weak over the remainder of the year,” Hassan added.

Production of vehicles, parts, lifts US industrial output in March; Feb figures revised up

16 April 2024

US industrial output up 0.4% in March, in line with expectations; flat over past 12 months; ANZ: rise in vehicles, vehicle parts main driver of increase; US Treasury yields rise; rate-cut expectations soften; capacity utilisation rate up at 78.4%, still below long-term average.

The Federal Reserve’s industrial production (IP) index measures real output from manufacturing, mining, electricity and gas company facilities located in the United States. These sectors are thought to be sensitive to consumer demand and so some leading indicators of GDP use industrial production figures as a component. US production collapsed through March and April of 2020 before recovering the ground lost over the fifteen months to July 2021. However, production levels has largely stagnated since early 2022.

According to the Federal Reserve, US industrial production expanded by 0.4% on a seasonally adjusted basis in March. The increase was in line with expectations as well as February’s result after it was revised up from 0.1%. On an annual basis the contraction rate slowed from February’s revised figure of 0.3% to zero.

“A 3.1% rise in autos and auto parts drove the increase,” said ANZ senior economist Blair Chapman. “Excluding that sector, manufacturing production rose a modest 0.3%.”

US Treasury yields rose moderately on the day. By the close of business, the 2-year Treasury yield had gained 6bps to 4.98%, the 10-year yield had added 5bps to 4.66% while the 30-year yield finished 3bps higher at 4.76%.

In terms of US Fed policy, expectations of a lower federal funds rate in the next 12 months softened, although at least two 25bps cuts are still currently factored in. At the close of business, contracts implied the effective federal funds rate would average 5.32% in May, 1bp less than the current spot rate, 5.295% in June and 5.28% in July. However, April 2025 contracts implied 4.725%, 60bps less than the current rate.

The same report includes capacity utilisation figures which are generally accepted as an indicator of future investment expenditure and/or inflationary pressures. Capacity usage hit a high for the last business cycle in early 2019 before it began a downtrend which ended with April 2020’s multi-decade low of 64.2%. March’s reading increased by 0.2 percentage points to 78.4%, still somewhat below the long-term average of 80.1%.

While the US utilisation rate’s correlation with the US jobless rate is solid, it is not as high as the comparable correlation in Australia.

“Solid economic growth”; US retail sales up 0.7% in March

15 April 2024

Summary: US retail sales up 0.7% in March, greater than expected; annual growth rate accelerates to 4.0%; ANZ: data confirms healthy consumption, solid economic growth; US Treasury yields rise; 2024 rate-cut expectations soften; higher sales in eight of thirteen categories; “non-store retailers” largest single influence on month’s result.

US retail sales had been trending up since late 2015 but, commencing in late 2018, a series of weak or negative monthly results led to a drop-off in the annual growth rate below 2.0%. Growth rates then increased in trend terms through 2019 and into early 2020 until pandemic restrictions sent them into negative territory. A “v-shaped” recovery then took place which was followed by some short-term spikes as federal stimulus payments hit US households in the first and second quarters of 2021.

According to the latest “advance” numbers released by the US Census Bureau, total retail sales increased by 0.7% in March. The result was greater than the 0.4% increase which had been generally expected but less than February’s 0.9% gain after it was revised up from 0.6%. On an annual basis, the growth rate accelerated from February’s revised rate of 2.1% to 4.0%.

“Control group sales, which are used to prepare estimates for GDP, rose 1.1% month-on-month and the February data were revised up 0.3% m/m from 0.0%,” said ANZ economist Madeline Dunk. “The data confirmed healthy consumption and solid economic growth, reflecting the current strength in hiring.”  

US Treasury bond yields rose by increasing amounts across the curve on the day. By the close of business, the 2-year Treasury yield had added 3bps to 4.92%, the 10-year yield had gained 9bps to 4.61% while the 30-year yield finished 11bps higher at 4.73%.

In terms of US Fed policy, expectations of a lower federal funds rate in the next 12 months softened, although at least two 25bps cuts are still currently factored in. At the close of business, contracts implied the effective federal funds rate would average 5.32% in May, 1bp less than the current spot rate, 5.29% in June and 5.27% in July. However, April 2025 contracts implied 4.71%, 62bps less than the current rate.

“The three-month average of control group sales is running at 0.4% month-on-month, which crudely equates to real personal consumption growth in the region of 2.0%–2.5% in Q1,” Dunk added.

Eight of the thirteen categories recorded higher sales over the month. The “Non-store retailers” segment provided the largest single influence on the overall result, rising by 2.7% over the month and contributing 0.46 percentage points to the total.  

The non-store segment includes vending machine sales, door-to-door sales and mail-order sales but nowadays this segment has become dominated by online sales. It accounts for over 17% of all US retail sales and it is the second-largest segment after vehicles and parts.

Euro-zone ind. production rises in Feb; still down 6.4% from year ago

15 April 2024

Summary: Euro-zone industrial production up 0.8% in February, less than expected; down 6.4% on annual basis; German, French 10-year yields up noticeably; expansion in all four largest economies.

Following a recession in 2009/2010 and the debt-crisis which flowed from it, euro-zone industrial production recovered and then reached a peak four years later in 2016. Growth rates then fluctuated for two years before beginning a steady and persistent slowdown from the start of 2018. That decline was transformed into a plunge in March and April of 2020 which then took over a year to claw back. Production levels in recent quarters have generally stagnated in trend terms at best.

According to the latest figures released by Eurostat, euro-zone industrial production expanded by 0.8% in February on a seasonally-adjusted and calendar-adjusted basis. The rise was less than the 1.0% increase which had been generally expected but in contrast with January’s 3.0% drop after it was revised up from -3.2%. On an annual basis, the contraction rate slowed from January’s revised rate of 6.6% to 6.4%.

Long-term German and French sovereign bond yields both rose noticeably on the day as US yields rose significantly at the long end of the yield curve. By the close of business, the German 10-year bond yield had gained 7bps to 2.44% while the French 10-year yield finished 9bps higher at 2.96%.

Industrial production expanded in all of the euro-zone’s four largest economies. Germany’s production rose by 1.1% over the month while the comparable figures for France, Spain and Italy were 0.2%, 1.3% and 0.1% respectively.

US consumer sentiment maintains recent stability; UofM index down modestly in April

12 April 2024

Summary: University of Michigan consumer confidence index falls in April, reading less than expected; views of present conditions, future conditions both deteriorate; index moves sideways for fourth straight month; Treasury yields fall; fed funds rate-cut expectations firm; uptick in inflation expectations reflects frustration inflation slowdown may have stalled.

US consumer confidence started 2020 at an elevated level but, after a few months, surveys began to reflect a growing unease with the global spread of COVID-19 and its reach into the US. Household confidence plunged in April 2020 and then recovered in a haphazard fashion, generally fluctuating at below-average levels according to the University of Michigan. The University’s measure of confidence had recovered back to the long-term average by April 2021 but then it plunged again in the September quarter and remained at historically low levels through 2022 and 2023.

The latest survey conducted by the University indicates confidence among US households has deteriorated in April. The preliminary reading of the Index of Consumer Sentiment registered 77.9 in April, less than the 79.0 which had been generally expected as well as March’s final figure of 79.4.

Consumers’ views of current conditions and their views of future conditions both deteriorated relative to those held at the time of the March survey.

“Sentiment moved sideways for the fourth straight month, as consumers perceived few meaningful developments in the economy,” said the University’s Surveys of Consumers Director Joanne Hsu.  

US Treasury bond yields fell almost uniformly across the curve on the day. By the close of business, the 2-year yield had lost 6bps to 4.89% while 10-year and 30-year yields both finished 5bps lower at 4.52% and 4.62% respectively.

In terms of US Fed policy, expectations of a lower federal funds rate in the next 12 months firmed, with at least two 25bps cuts currently factored in. At the close of business, contracts implied the effective federal funds rate would average 5.315% in May, 1bp less than the current spot rate, 5.275% in June and 5.25% in July. However, April 2025 contracts implied 4.655%, 67bps less than the current rate.

“Expectations over personal finances, business conditions, and labour markets have all been stable over the last four months,” added Hsu. “However, a slight uptick in inflation expectations in April reflects some frustration that the inflation slowdown may have stalled.”

It was once thought less-confident households are generally inclined to spend less and save more; some decline in household spending could be expected to follow. However, recent research suggests the correlation between household confidence and retail spending is quite weak.

Soft US PPI figures for March may have implications for upcoming PCE report

11 April 2024

Summary: US producer price index (PPI) up 0.2% in March, less than expected; annual rate accelerates to 2.1%; “core” PPI up 0.2% over month, up 2.4% over year; Citi: some components which are part of PCE softer than expected; short-term US Treasury yields decline, longer-term yields rise; 2024 rate-cut expectations firm a touch; services prices up 0.3%, goods prices down 0.1%.

Around the end of 2018, the annual inflation rate of the US producer price index (PPI) began a downtrend which continued through 2019. Months in which producer prices increased suggested the trend may have been coming to an end, only for it to continue, culminating in a plunge in April 2020. Figures returned to “normal” towards the end of that year but then moved well above the long-term average in 2021 and 2022 before falling back over 2023.

The latest figures published by the Bureau of Labor Statistics indicate producer prices increased by 0.2% after seasonal adjustments in March. The result was less than the 0.3% increase which had been generally expected as well as February’s 0.6% rise. On a 12-month basis, the rate of producer price inflation after seasonal adjustments and revisions accelerated from February’s figure of 1.6% to 2.1%.

Producer prices excluding foods and energy, or “core” PPI, were also up 0.2% after seasonal adjustments. The result was in line with expectations but less than February’s 0.3% increase. The annual growth rate accelerated from 2.0% to 2.4%.

“March PPI was softer than we expected, particularly details of PPI that matter for PCE inflation like airfares, medical services and portfolio management fees,” said Citi Chief Economist Veronica Clark.

Short-term US Treasury bond yields declined on the day while longer-term yields rose moderately. By the close of business, the 2-year Treasury yield had lost 2bps to 4.95%, the 10-year yield had gained 2bps to 4.57% while the 30-year yield finished 4bps higher at 4.67%.

In terms of US Fed policy, expectations of a lower federal funds rate in the next 12 months firmed a touch, with two 25bps cuts currently factored in. At the close of business, contracts implied the effective federal funds rate would average 5.32% in May, 1bp less than the current spot rate, 5.28% in June and 5.26% in July. However, April 2025 contracts implied 4.72%, 51bps less than the current rate.

The BLS stated the rise of the index was attributable to a 0.3% increase in services prices. The final demand goods index declined by 0.1%.

“We were surprised in particular that an increase in physicians’ services prices did not occur in March PPI after a cut of Medicare payments to physicians was partially reversed, and would still highlight this as an upside risk next month,” Clark added.

The producer price index is a measure of prices received by producers for domestically produced goods, services and construction. It is put together in a fashion similar to the consumer price index (CPI) except it measures prices received from the producer’s perspective rather than from the perspective of a retailer or a consumer. It is another one of the various measures of inflation tracked by the US Fed, along with core personal consumption expenditure (PCE) price data. 

US CPI up 0.4% in March; bond yields jump, rate-cut expectations wound back

10 April 2024

Summary: US CPI up 0.4% in March, greater than expected; annual inflation rate rises from 3.2% to 3.5%; “core” rate also up 0.4%, up 3.9% over year; ANZ: improvement in CPI has stalled; Treasury yields jump; rate-cut expectations soften significantly; ANZ: data shows outsized price gains concentrated in few categories; prices of non-energy services main driver again.

The annual rate of US inflation as measured by changes in the consumer price index (CPI) halved from nearly 3% in the period from July 2018 to February 2019. It then fluctuated in a range from 1.5% to 2.0% through 2019 before rising above 2.0% in the final months of that year. Substantially lower rates were reported from March 2020 to May 2020 and they remained below 2% until March 2021. Rates then rose significantly before declining from mid-2022.

The latest US CPI figures released by the Bureau of Labor Statistics indicated seasonally-adjusted consumer prices rose by 0.4% on average in March. The increase was greater than the 0.4% which had been generally expected but in line with February’s rise. On a 12-month basis, the inflation rate accelerated from 3.2% to 3.5%.

“Headline” inflation is known to be volatile and so references are often made to “core” inflation for analytical purposes. The core prices index, the index which excludes the more variable food and energy components, also increased by 0.4% on a seasonally-adjusted basis over the month, above consensus expectations of a 0.3% rise. However, the annual growth rate still slowed from February revised rate of 4.0% to 3.9%.

“The 0.4% month-on-month rise in March headline and core CPI data disappointed as it signalled the improvement in that measure of inflation has stalled,” said ANZ Head of G3 Economics Brian Martin.

US Treasury bond yields jumped on the day, especially at the short end of the curve. By the close of business, the 2-year Treasury yield had gained 23bps to 4.97%, the 10-year yield had added 19bps to 4.55% while the 30-year yield finished 14bps higher at 4.63%.

In terms of US Fed policy, expectations of a lower federal funds rate in the next 12 months softened significantly, although two cuts are still currently factored in. At the close of business, contracts implied the effective federal funds rate would average 5.32% in May, 1bp less than the current spot rate, 5.30% in June and 5.28% in July. However, April 2025 contracts implied 4.72%, 51bps less than the current rate.

“However, scrutiny of the data shows outsized price gains are concentrated in a few categories, like medical insurance, vet services and motor insurance and repair,” Martin added. “Elsewhere, core goods inflation fell, shelter inflation continued to moderate and many key service sectors like recreation, financial services, education, communications and other personal services showed much more normalised price changes.”

The largest influence on headline results is often the change in fuel prices. Prices of “Energy commodities”, the segment which contains vehicle fuels, increased by 1.5% and contributed 0.05 percentage points to the total. However, prices of non-energy services, the segment which includes actual and implied rents, again had the largest effect on the total, adding 0.30 percentage points after increasing by 0.5% on average.

Consumer pessimism continues in April, “few signs of lifting”

09 April 2024

Summary: Westpac-Melbourne Institute consumer sentiment index down in April; pessimism showing few signs of lifting; ACGB yields move lower; rate-cut expectations firm; absence of sentiment recovery reflects nature, duration of Australia’s inflation challenge; three of five sub-indices lower; fewer respondents expecting higher jobless rate.

After a lengthy divergence between measures of consumer sentiment and business confidence in Australia which began in 2014, confidence readings of the two sectors converged again in mid-July 2018. Both measures then deteriorated gradually in trend terms, with consumer confidence leading the way. Household sentiment fell off a cliff in April 2020 but, after a few months of to-ing and fro-ing, it then staged a full recovery. However, consumer sentiment has languished at pessimistic levels since mid-2022 while business sentiment has been more robust.

According to the latest Westpac-Melbourne Institute survey conducted in the first week of April, household sentiment remains at quite a pessimistic level.  Their Consumer Sentiment Index declined from March’s reading of 84.4 to 82.4, a reading which is significantly lower than the long-term average reading of just over 101 and well below the “normal” range.

“The pessimism that has dominated the consumer mood for nearly two years now is still showing few signs of lifting,” said Westpac senior economist Matthew Hassan.

Any reading of the Consumer Sentiment Index below 100 indicates the number of consumers who are pessimistic is greater than the number of consumers who are optimistic.

Commonwealth Government bond yields moved uniformly lower on the day. By the close of business, 3-year, 10-year and 20-year ACGB yields had all lost 3bps to 3.70%, 4.18% and 4.48% respectively.

In the cash futures market, expectations regarding rate cuts in the next twelve months firmed a little.  At the end of the day, contracts implied the cash rate would remain close to the current rate for the next few months and average 4.30% through May and 4.29% in June. However, August contracts implied a 4.215% average cash rate, November contracts implied 4.075%, while May 2025 contracts implied 3.83%, 50bps less than the current rate.

“The absence of a sentiment recovery to date reflects the nature and duration of Australia’s inflation challenge,” added Hassan. ”Consumer price rises have outstripped wage growth by 6 percentage points over the last three years. That has combined with a sharp increase in interest rates and a big lift in tax payments putting household incomes under intense, sustained pressure.”

Three of the five sub-indices registered lower readings, with the “Time to buy a major household item” sub-index posting the largest monthly percentage loss.

However, the Unemployment Expectations index, formerly a useful guide to RBA rate changes, decreased from 128.1 to 124.6. Lower readings result from fewer respondents expecting a higher unemployment rate in the year ahead.

NAB March business indices little changed; above-average activity, below-average confidence

09 April 2024

Summary: Business conditions deteriorate slightly in March; business pessimism eases slightly, confidence index still below average; continues the trend of above-average activity indicators alongside below-average confidence; ACGB yields move lower; rate-cut expectations firm; tentative signs supply, demand coming into balance; capacity utilisation rate declines, still at elevated level.

NAB’s business survey indicated Australian business conditions were robust in the first half of 2018, with a cyclical-peak reached in April of that year. Readings from NAB’s index then began to slip and forecasts of a slowdown in the domestic economy began to emerge in the first half of 2019 as the index trended lower. It hit a nadir in April 2020 as pandemic restrictions were introduced but then improved markedly over the next twelve months and has subsequently remained at robust levels.

According to NAB’s latest monthly business survey of around 400 firms conducted in the last two weeks of March, business conditions slipped a touch, albeit to a level which is still above the long-term average. NAB’s conditions index registered 9 points, down 1 point from February’s reading.

Conversely, business confidence improved slightly.  NAB’s confidence index inched up from February zero reading,  a reading which is below the long-term average.  Typically, NAB’s confidence index leads the conditions index by one month, although some divergences have appeared from time to time.

“Business conditions and confidence were little changed in March, continuing the trend of above-average activity indicators alongside below-average confidence that has defined the NAB Business Survey for much of the past year,” said NAB Chief Economist Alan Oster.

Commonwealth Government bond yields moved uniformly lower on the day. By the close of business, 3-year, 10-year and 20-year ACGB yields had all lost 3bps to 3.70%, 4.18% and 4.48% respectively.

In the cash futures market, expectations regarding rate cuts in the next twelve months firmed a little.  At the end of the day, contracts implied the cash rate would remain close to the current rate for the next few months and average 4.30% through May and 4.29% in June. However, August contracts implied a 4.215% average cash rate, November contracts implied 4.075%, while May 2025 contracts implied 3.83%, 50bps less than the current rate.

“There are tentative signs that supply and demand are coming into better balance with capacity utilisation continuing to ease albeit gradually and from a high level,” Oster added. “In line with this, the month saw some modest easing in the pace of labour and materials cost growth but both remain elevated, and retail price growth also remained strong at 1.3% in quarterly equivalent terms.”

NAB’s measure of national capacity utilisation declined again, this time from February’s reading of 83.4% to 83.2%, a level which is still quite elevated from a historical perspective. Seven of the eight sectors of the economy were reported to be operating at or above their respective long-run averages.

Capacity utilisation is generally accepted as an indicator of future investment expenditure and it also has a strong inverse relationship with Australia’s unemployment rate.

Rate rise effect milder than anticipated; home loan approvals up in February

08 April 2024

Summary: Value of loan commitments up 1.5% in February, slightly less than expected; 13.3% higher than February 2023; ANZ: sales volumes up since January, suggests lending should continue growing; ACGB yields up noticeably; rate-cut expectations soften; update suggests dent from November rate rise was milder than initial estimates had indicated; value of owner-occupier loan approvals up 1.6%; investor approvals up 1.2%; number of owner-occupier home loan approvals up 0.9%.

The number and value of home-loan approvals began to noticeably increase after the RBA reduced its cash rate target in a series of cuts beginning in mid-2019, potentially ending the downtrend which had been in place since mid-2017. Figures from February through to May of 2020 provided an indication the downtrend was still intact but subsequent figures then pushed both back to record highs in 2021. However, there has been a considerable pullback since then, although the total value of new loans is still elevated by historical standards.

February’s housing finance figures have now been released and total loan approvals excluding refinancing increased by 1.5% In dollar terms over the month, slightly less than the 2.0% rise which had been generally expected and in contrast with January 0.8% fall after revisions. On a year-on-year basis, total approvals excluding refinancing were 13.3% higher than February 2023, up from the previous month’s comparable figure of 12.8%.

“Sales volumes have picked up since January suggesting lending should continue to grow in coming months,” said ANZ senior economist Blair Chapman.

Commonwealth Government bond yields rose noticeably on the day, largely in line with movements of US Treasury yields on Friday night. By the close of business, the 3-year ACGB yield had gained 8bps to 3.73%, the 10-year yield had increased by 10bps to 4.21% while the 20-year yield finished 9bps higher at 4.51%.

In the cash futures market, expectations regarding rate cuts in the next twelve months softened.  At the end of the day, contracts implied the cash rate would remain close to the current rate for the next few months and average 4.305% through May and 4.29% in June. However, August contracts implied a 4.22% average cash rate, November contracts implied 4.09%, while February 2025 contracts implied 3.95%, 37bps less than the current rate.

“Overall, the update and revised profile suggests the dent from November’s rate rise was a little milder than initial estimates had indicated with the gradual up-trend in approvals looking more intact,” said Westpac senior economist Matthew Hassan. “That said momentum is still sluggish in most markets and notably softer in Victoria.”

The total value of owner-occupier loan commitments excluding refinancing increased by 1.6%, up from January’s 0.9% fall. On an annual basis, owner-occupier loan commitments were 9.1% higher than in February 2023, up from January’s comparable figure of 8.4%.

The total value of investor commitments excluding refinancing increased by 1.2%. The rise follows a 0.8% decline in January, taking the growth rate over the previous 12 months from 21.7% to 21.5%.

The total number of loan commitments to owner-occupiers excluding refinancing increased by 0.9% to 24447 on a seasonally adjusted basis, in contrast with January’s 0.3% decline. The annual growth rate slowed a touch from 5.6% after revisions to 5.5%.

Click for more news