26 November 2015
Capital expenditure in the third quarter was weaker than the -2.9% expected and declined by 9.2% compared to the previous quarter. There were immediate movements in markets as a result of the figures as cash markets increased the odds of rate cuts next year, 10 year bond yields fell 3bps and the currency markets reacted by sending the Aussie dollar lower as it too factored in lower interest rates in the future.
Equipment spending fell by 8.2% and building/structure spending fell by 9.8%. By industry, the mining sector fell 10.4%, the services sector fell 9.2% while the manufacturing sector provided the one piece of good news and increased by 6.9%.
Estimate 4 for 2015/16 capex plans is now $120.4 billion, 4% higher than August’s Estimate 3 of $104 billion but 20.9% lower on the previous year’s Estimate 4 of $145 billion.
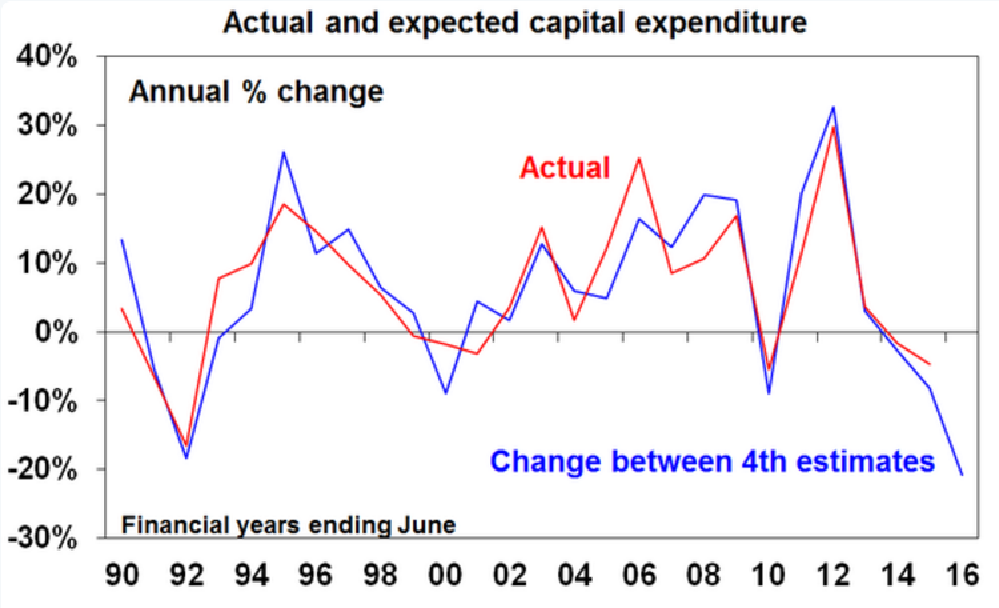
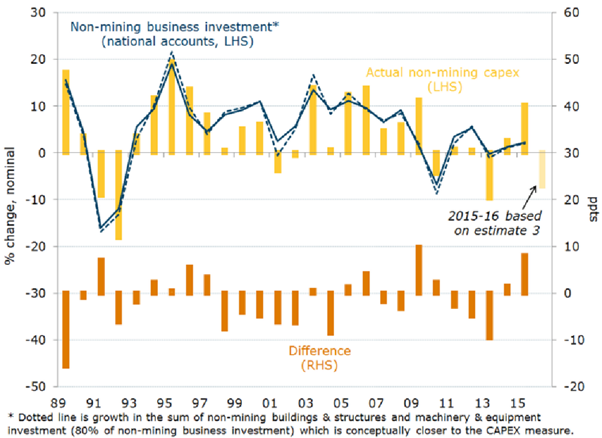
AMP’s chief economist Shane Oliver said the poor Q3 capex plans would partly offset the strong trade contribution to GDP growth. He said Q3 GDP would not be negative but it would not be as strong as some thought after the trade figures came out earlier in the week. Westpac said they had revised their Q3 GDP forecasts back to 0.7% and 2.1% for the 2015/2016 year. ANZ senior economist Justin Fabo pursued a slightly different angle and suggested the figures be treated with some caution as the chart below was “a reminder of just how poor a guide it is to actual non-mining investment.”
26 November 2015
The ABS preliminary estimates of the Australia’s September quarter trade deficit and terms of trade were published indicating an improvement in Australia’s export earnings and prices received. The trade deficit narrowed to $7.4bn, down from the revised June quarter figure of $10.9bn, as the value of gold and minerals exported rose. The figures are “advance” estimates and will be updated in the balance of payments report released in early December.
Westpac said they will be upgrading Q3 GDP forecasts on the back of a lower level of imports and thus a higher net export figure. The bank’s Q3 GDP estimate had been raised from 0.7% to 0.9% which had fed through to a higher full year estimate of 2.3%.
26 November 2015
Late August in Moody’s flagged QBE Insurance Group for credit rating review and a possible upgrade. Nearly two months later the review is over and QBE’s senior debt has been upgraded by the ratings agency to Ba1 from Baa2. Moody’s cited improved financial ratios and earnings which a less volatile. “The rating upgrade reflects the group’s improved balance sheet settings, with a better quality capital structure and lower financial leverage, as well as the demonstrable progress in strategic focus and operational integration. It also reflects the enhanced earnings profile of the group.” QBE currently has an A- credit rating from Standard & Poor’s which was last reviewed in May.
26 November 2015
September quarter construction figures released by the ABS showed a fall of 3.6%, down from the June quarter’s rise of 1.6% and less than the -2.0% result expected by markets. 10 year bond yields dropped by 4-5bps on the day although part of the decline was largely on the back of offshore yields falling.
In the June quarter, WA’s mining sector, in particular the construction of the Roy Hill iron ore mine and the Gorgon LNG projects, was responsible for what was a higher-than-expected result. The thinking at the time was the construction spending figures would drop away once these projects went back to less frenetic levels of activity after making up for lost time. As expected, WA’s contribution to construction was down 8.5% in the September quarter but UBS noted how the other states also fell by a combined 1% for the quarter and 7% for the year. Public sector construction activity also fell but it was no longer in double-digit territory.
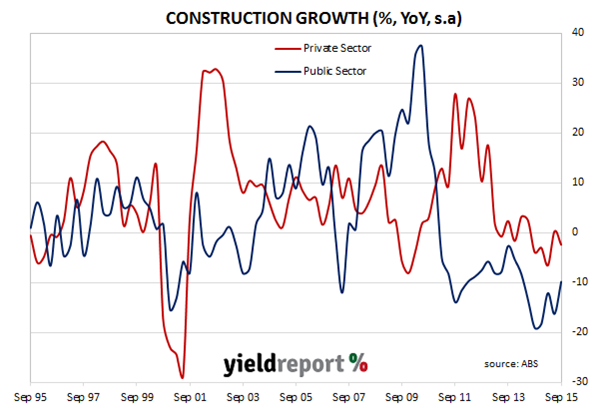
Nationally, the residential building segment was up 2%, while the non-residential segment was down 1.9% for a total building construction increase of 0.6% over the quarter. The -7.3% change in the engineering segment reversed the June quarters large increase.
UBS said the figures implied the Australian economy was not past what they described as the “capex cliff”. However, the investment bank noted how even in the face of the ongoing drag on growth in the construction sector, other sectors such as net exports were likely to provide “upside risk” to Q3 GDP. 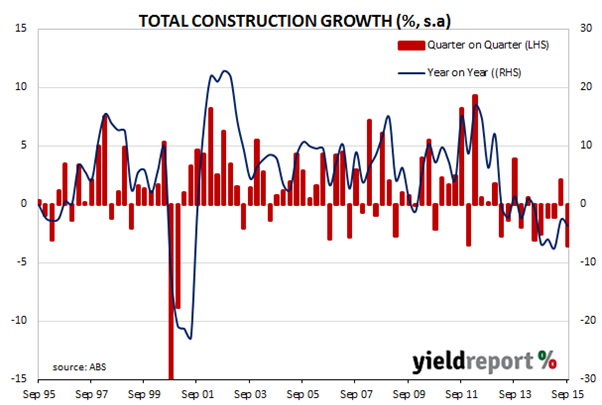
26 November 2015
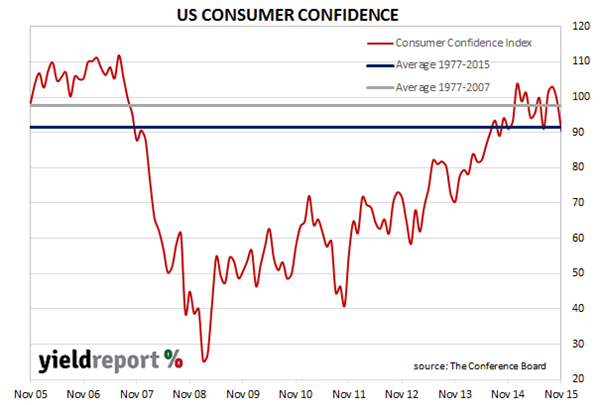
US consumers became less optimistic in the October/November period, predominantly on the back of concerns about the availability of additional work coupled with the view that incomes would fall. The US Conference Board November survey of consumer confidence showed a drop in its confidence index down to 90.4 after October’s drop to 99.1. The result comes as a quite a surprise as financial markets were estimating it would come in at 99.5 and US employment figures had been unexpectedly strong through October.
Consumer confidence typically increases when the economy expands and decreases when the economy contracts. It is seen as an important indicator of an economy’s short term health and in Western countries an estimated 60-70% of economic activity, or GDP, is in the form of private sector consumption.
The Consumer Confidence Index figures have been quite volatile in recent months, typically moving between 90 and 100. Since July 2014 the index has been at the long term average or above (see chart below) and one interpretation is US consumers can be seen as being optimistic in their outlook or neutral at worst. However, the long term average has been dragged down by the US “Great Recession” period and any reading below 97.5 is below the pre-2008 average.
26 November 2015
Earlier this month YieldReport reported on Fortescue Mining’s announcement of a tender to buy back some of its 2019 and 2022 bonds. This week the company announced the results of the tender with offers received worth $1278.6million in face value terms. Fortescue bought back $750million in face value terms but only paid an average 83.5 cents in the dollar recognising a pre-tax gain of USD$124 million in the process. The purchases were funded by cash Fortescue has on hand and might be an easier way for Fortescue to make money than digging the red dirt out of the ground.
The large volume of offers and the discounted price to face value suggests the investors are nervous about: a) the company’s prospects; b) commodity prices in general; c) global interest rates rising or d) a combination of the above. Typically an investor would sell company bonds before maturity if they thought that the price of the bond would fall (or yields spike higher).
Of course the consequence of buying back debt and having a smaller balance sheet is the company now has less liquid assets which can be used in the here and now. Thus the degree of balance sheet and funding flexibility has been reduced as the bonds it bought back were some years away from maturity. The other consequence is that should Fortescue wish to issue bonds in the future, investors may be less enthusiastic and/or demand a higher return. The alternate view is that the company is actually supporting the bond price and hence investors.
25 November 2015
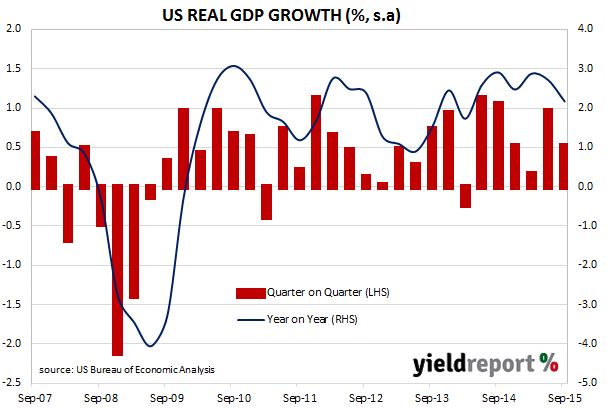
The US Commerce Department released the Q3 GDP “second estimate” figures which showed an annualised growth rate of 2.1% (seasonally adjusted), revised up from the 1.5% advanced estimate released at the end of October but in line with market estimates. As such, US 2 year Treasury notes yields edged 1bp lower to 0.93% while US 10 year yields also fell 1bp to 2.24%.
The second estimates are based on more complete source data than were available for the “advance” estimates. ANZ saw the higher revised growth figures coming as disappointing. “…the composition of growth was a little disappointing relative to the advance release. Inventories were revised up (now estimated to have subtracted 0.6% instead of 1.4% originally) while personal consumption growth was nudged down (0.2% to 3.0% q/q), as were net exports. There was a small upward revision to investment growth.”
The Commerce Department calculates the annualised figure by multiplying the quarterly result by four and so a direct comparison with UK or Australian figures is not meaningful. However, if the US GDP growth figures were to be calculated in same way Australia does (that is, q/q and y/y), then the seasonally adjusted US GDP figures would be 0.5% (q/q) and 2.2% (y/y).
22 November 2015
The Australian Prudential Regulation Authority released the September 2015 quarter statistics for Australian superannuation funds showing that the total assets held is set to burst through the $2 trillion mark very soon.
At the end of the September quarter total superannuation fund assets was $1.994 Billion, an increase of 6.5% since the end of the June quarter. Self-Managed Superannuation Fund assets increased 3.8% over the quarter to $576 billion.
APRA also released an article focusing on the transition to default ‘My Super’ products that showed a strong 15.4% increase during the quarter.
Total benefit payments during the quarter were $62.1 billion, a quarterly increase of 12.1%.
Quarterly Superannuation Performance:
www.apra.gov.au/Super/Publications/Pages/quarterly-superannuation-performance.aspx
Quarterly MySuper Statistics:
www.apra.gov.au/Super/Publications/Pages/Quarterly-MySuper-statistics.aspx
19 November 2015
In the second week of November, ANZ sold a USD$3.25 billion, four tranche deal into the US market (see our commentary on this) and this week Westpac has headed down a similar path, launching a three tranche, USD$3.75 billion fixed and floating rate issue. Of the three tranches, the two which are fixed make up nearly three quarters of the funds to be raised. Australian banks may be voting with their feet as the odds of rates rising in the US shorten. Given the relationship between the Federal Funds Rate and US yields, rises in the Federal Funds Rate will typically lead to higher long end yields. The next few weeks may be one of the few opportunities left to lock in low yields while there is still some uncertainty left in the lead up to the first rate rise.
Banks may also be looking to lock in funding while markets are liquid and demand is present. If the US Fed raises interest rates in December – currently forecast by markets to be around a 70% chance – there is potential for dislocation in markets as it is such a key interest rate globally. Despite the Fed telegraphing its intentions to raise interest rates for many months, it is still possible for markets to be taken by surprise and by locking in rates now, it avoids unforeseen problems trying to raise money in Q1 2016.
18 November 2015
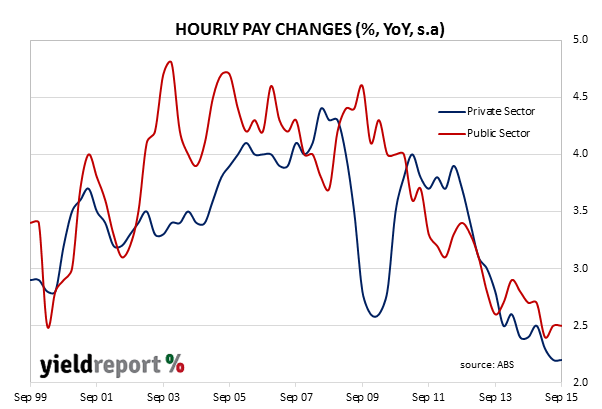
The ABS released September quarter wages figures which were largely in line with market expectations. Private sector wages grew at the lowest rate since the data series began in September 1998 for the second quarter in a row. Seasonally adjusted private sector wages growth for the year to the September quarter 2015 was 2.2%, again smaller than public sector figure of 2.5%. In both sectors, the increase for the September quarter was the same as the increase for the June quarter. Through the year, the joint figure for the combined private / public sectors rose 2.1%, down from the June result of 2.3%.
In the June quarter, WA had the lowest private sector growth of all states due to weakness in the resources sector. The state again scored the lowest rate of growth for the September quarter, recording a rise of 0.5%. South Australia and Tasmania shared the prize for the highest growth rates, recording 1.2% over the quarter, and making it the third quarter in a row for Tasmania.
AMP Capital’s Shane Oliver said the figures explains the Australian economy’s resistance to rising unemployment. Low wages growth “partly explains why jobs growth has been able to come in better than expected despite the slow rate of economic growth.” The 10 year bond yield finished at the low for the day at 2.925%, down 2.5bps.