JCB find the YieldReport to be an invaluable summary of all debt market activity. Whilst we are focussed on the highest grade bonds it is important to see what is..Angus Coote, Executive Director, JCB Active Bond Fund
Composite sentiment index back to implying neg growth in euro-zone
30 August 2023
Summary: Euro-zone composite sentiment indicator down in August, slightly below expectations; readings down in all five sectors; down in three of four largest euro-zone economies; German, French 10-year yields moderately higher; index implies annual GDP growth rate of -0.2%.
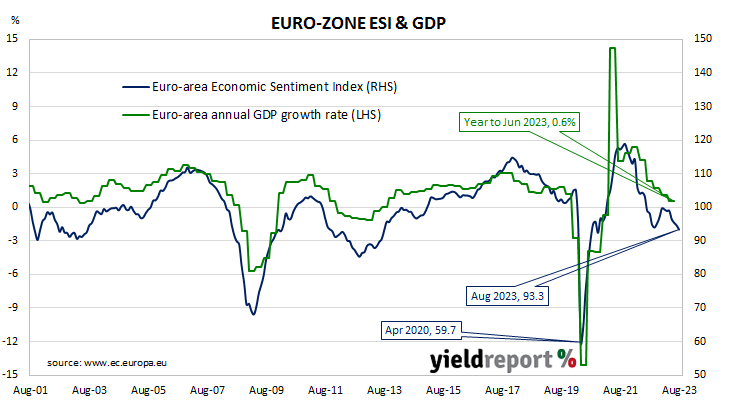
The European Commission’s Economic Sentiment Indicator (ESI) is a composite index comprising five differently weighted sectoral confidence indicators. It is heavily weighted towards confidence surveys from the business sector, with the consumer confidence sub-index only accounting for 20% of the ESI. However, it has a good relationship with euro-zone GDP growth rates, although not necessarily as a leading indicator.
The ESI posted a reading of 93.3 in August, slightly below the consensus expectation of 95.5 and down from July’s reading of 94.5. The average reading since 1985 is just under 100.
German and French 10-year bond yields finished the day moderately higher. By the close of business, German and French 10-year bond yields had both gained 4bps to 2.56% and 3.07% respectively.
Confidence deteriorated in all five sectors of the economy. On a geographical basis, the ESI decreased in three of the euro-zone’s four largest economies, Germany, France and Italy, but improved in Spain.
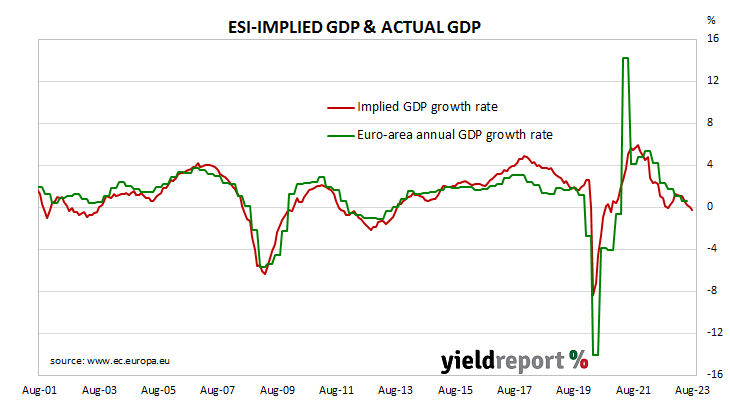
End-of-quarter ESI readings and annual euro-zone GDP growth rates are highly correlated. This latest reading corresponds to a year-to-August GDP growth rate of -0.2%, down from July’s implied growth rate of 0.1%.
June quarter construction growth wanes after strong March quarter
30 August 2023
Summary: Construction spending up 0.4%, less than expected; ANZ: growth wanes after strong March quarter; Westpac: strength in part due to earlier delays; residential sector flat, non-residential building up 0.6%, engineering up 0.7%.
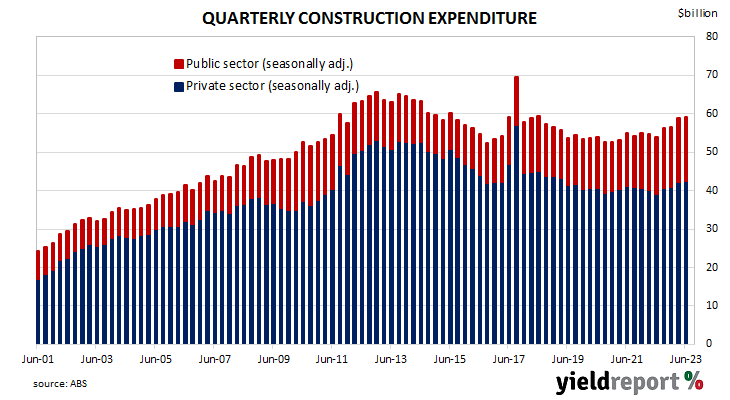
Construction expenditure increased substantially in Australia in the early part of last decade following a more-steady expansion through the 2000s. A large portion of the increase came from the commissioning of new projects and the expansion of existing ones to exploit a tripling in price of Australia’s mining exports in the previous decade. Growth rates began slowing in 2017 and the return to “normal” investment levels has now taken place.
According to the latest construction figures published by the ABS, total construction in the June quarter increased by 0.4%. The result was less than the 1.0% increase which had been generally expected as well as the March quarter’s 3.8% increase after revisions. On an annual basis, the growth rate accelerated from 7.3% to 9.3%.
“In short, growth in construction work done waned in the June quarter, albeit after a stronger March quarter result,” said ANZ senior economist Adelaide Timbrell.
The figures came out on the same day as the latest home approvals and Commonwealth Government bond yields mostly fell moderately. By the close of business, the 3-year ACGB yield had lost 4bps to 3.78%, the 10-year yield had fallen 3bps to 4.07% while the 20-year yield finished 1bp lower at 4.42%.
In the cash futures market, expectations regarding further rate rises eased. At the end of the day, contracts implied the cash rate would barely change from the current rate of 4.07% and average 4.07% in September and 4.095% in October. February 2024 contracts implied a 4.175% average cash rate, as did May 2024 contracts, 11bps more than the current rate.
“The medium-term theme is that the capital stock needs to expand to meet the requirements of a growing population,” observed Westpac senior economist Andrew Hanlan. “Overlaid on that, the pandemic delayed the start of some projects and delayed the work on some projects. Current strength in work is in part due to those earlier delays, with many of the disruptions having eased.” He also noted new dwelling work is being supported by a backlog while renovation work “continues to deflate.”
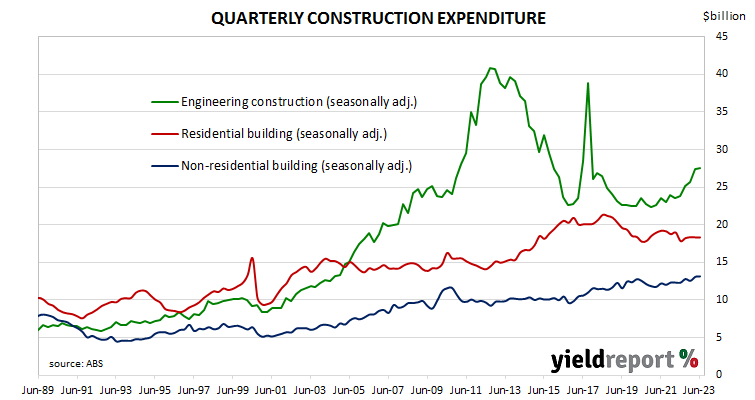
Residential building construction expenditures were essentially flat, slightly higher than the 0.1% decline in the March quarter after revisions. On an annual basis, expenditure in this segment was 2.7% higher than the June 2022 quarter, up from the March quarter’s comparable figure of -3.4%.
Non-residential building spending increased by 0.6%, down from the previous quarter’s 4.2% increase. On an annual basis, expenditures were 6.7% higher than the June 2022 quarter, whereas the March quarter’s comparable figure was 6.2% after revisions.
Engineering construction increased by 0.7% in the quarter, a considerably smaller increase than the 6.5% rise in the March quarter. On an annual basis, spending in this segment was 15.5% higher than the June 2022 quarter, down from the March quarter’s comparable figure of 16.4% after revisions.
Quarterly construction data compiled and released by the ABS are not considered to be of a “primary” nature, unlike unemployment (Labour Force) and inflation (CPI) figures. However, the figures are viewed by economists and analysts with interest as they directly feed into quarterly GDP figures.
Home approvals drop another 8.1% in July; “stabilising somewhat”
30 August 2023
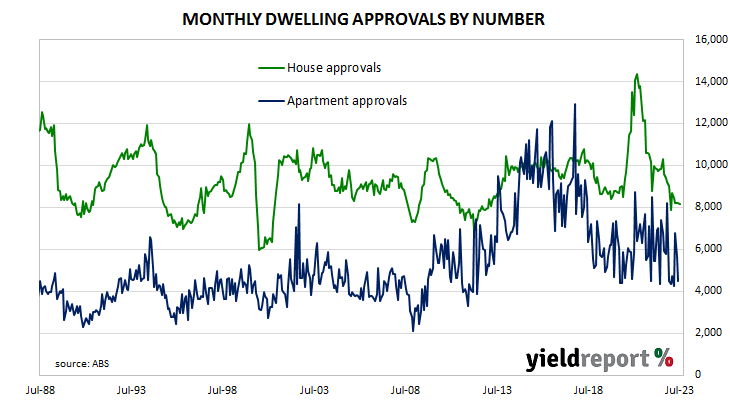
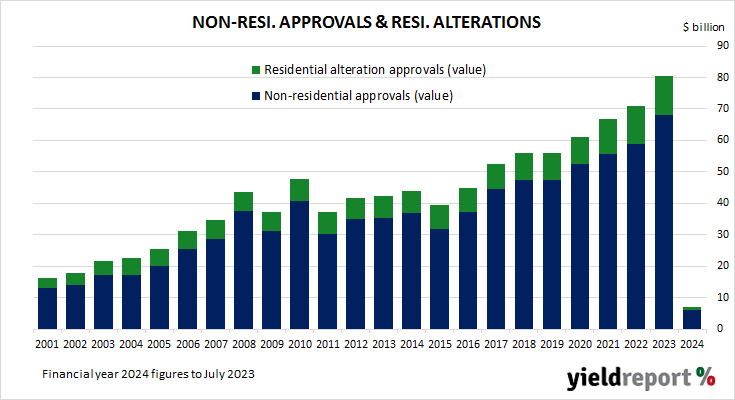
Summary: Home approval numbers down 8.1% in July, under expectations; 10.6% lower than July 2022; Westpac: “stabilising somewhat”; Westpac: approvals at very low level by historical standards; house approvals down 0.1%, apartments down 19.9%; non-residential approvals down 27.8% in dollar terms, residential alterations down 4.4%.
Building approvals for dwellings, that is apartments and houses, headed south after mid-2018. As an indicator of investor confidence, falling approvals had presented a worrying signal, not just for the building sector but for the overall economy. However, approval figures from late-2019 and the early months of 2020 painted a picture of a recovery taking place, even as late as April of that year. Subsequent months’ figures then trended sharply upwards before falling back in 2021, 2022 and the first half of 2023.
The Australian Bureau of Statistics has released the latest figures from July which show total residential approvals fell by 8.1% on a seasonally-adjusted basis. The fall was a greater one than the 1.0% decline which had been generally expected and slightly greater than June’s 7.9% fall after revisions. Total approvals fell by 10.6% on an annual basis, up from the previous month’s revised figure of -18.0%. Monthly growth rates are often volatile.
“Looking through recent volatility, approvals do look to be stabilising somewhat,” said Westpac senior economist Matthew Hassan. “Total approvals are still up 7.1% on a rolling 3-month basis, despite the back-to-back falls, with non-high rise approvals holding about flat since April.”
The figures came out on the same day as the latest quarter’s construction work done report. Commonwealth Government bond yields fell and, by the close of business, the 3-year ACGB yield had lost 4bps to 3.78%, the 10-year yield had fallen 3bps to 4.07% while the 20-year yield finished 1bp at 4.42%.
In the cash futures market, expectations regarding further rate rises eased. At the end of the day, contracts implied the cash rate would barely change from the current rate of 4.07% and average 4.07% in September and 4.095% in October. February 2024 contracts implied a 4.175% average cash rate, as did May 2024 contracts, 11bps more than the current rate.
“While the recent signs of an underlying stabilisation in activity may be comforting, approvals are at a very low level by historical standards, particularly when viewed relative to the size of the dwelling stock and pace of population growth,” Hassan added.
Approvals for new houses slipped by 0.1% over the month, up from June’s 0.8% fall. On a 12-month basis, house approvals were 16.8% lower than they were in July 2022, up from June’s comparable figure of -16.5%.
Apartment approval figures are usually a lot more volatile and July’s total fell by 19.9% after a 17.1% fall in June. The 12-month growth rate rose from June’s revised rate of -20.1% to 3.5%.
Non-residential approvals decreased by 27.8% in dollar terms over the month but were 45.9% higher on an annual basis. Figures in this segment also tend to be rather volatile.
Residential alteration approvals fell by 4.4% in dollar terms over the month and were 3.7% lower than in July 2022.
Conf. Board confidence index drops in August; consumers “preoccupied” with rising prices
29 August 2023
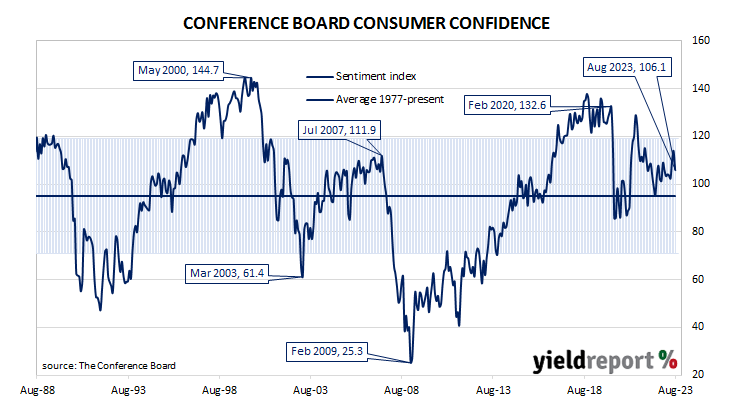
Summary: Conference Board Consumer Confidence Index falls in August, reading less than expected; consumers preoccupied with rising prices, especially groceries, gasoline; views of present conditions, short-term outlook both deteriorate.
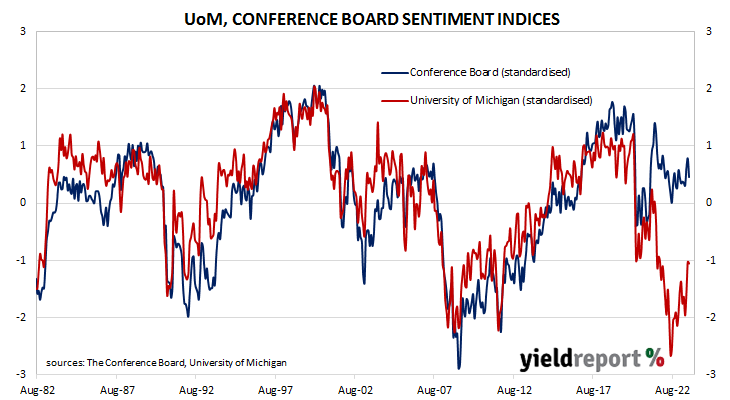
US consumer confidence clawed its way back to neutral over the five years after the GFC in 2008/2009 and then went from strength to strength until late 2018. Measures of consumer confidence then oscillated within a relatively narrow band at historically high levels until they plunged in early 2020. Subsequent readings then fluctuated around the long-term average until March 2021 when they returned to elevated levels. However, a noticeable gap has since emerged between the two most-widely followed surveys.
The latest Conference Board survey held during the first three weeks of August indicated US consumer confidence has deteriorated after improving for two consecutive months. August’s Consumer Confidence Index registered 106.1 on a preliminary basis, well below the generally-expected figure of 116.6 as well as July’s final figure of 117.0.
“August’s disappointing headline number reflected dips in both the current conditions and expectations indexes,” said Dana Peterson, Chief Economist at The Conference Board. “Write-in responses showed that consumers were once again preoccupied with rising prices in general, and for groceries and gasoline in particular.”
The figures were released on the same day as the latest JOLTS report and US Treasury yields finished the day significantly lower, especially at the short end of the curve. By the close of business, the 2-year Treasury bond yields had shed 15bps to 4.90%, the 10-year yield had lost 9bps to 4.12% while the 30-year yield finished 5bps lower at 4.23%.
In terms of US Fed policy, expectations of a lower federal funds rate in 2024 hardened. At the close of business, contracts implied the effective federal funds rate would average 5.34% in September, slightly above the current spot rate, and then average 5.365% in October. December futures contracts implied a 5.45% average effective federal funds rate while August 2024 contracts implied 4.82%, 51bps less than the current rate.
Consumers’ views of present conditions and of the near-future both deteriorated. The Present Situation Index decreased from July’s revised figure of 153.0 to 144.8 while the Expectations Index decreased from 88.0 to 80.2.
The Consumer Confidence Survey is one of two widely followed monthly US consumer sentiment surveys which produce sentiment indices. The Conference Board’s index is based on perceptions of current business and employment conditions, as well as respondents’ expectations of conditions six months in the future. The other survey, conducted by the University of Michigan, is similar and it is used to produce an Index of Consumer Sentiment. That survey differs in that it does not ask respondents explicitly about their views of the labour market and it also includes some longer-term questions.
US quit rate slips again, back in line with pre-pandemic readings
29 August 2023
Summary: US quit rate slips to 2.3% in July; ANZ: rate back in line with pre-pandemic readings; US Treasury yields fall significantly; expectations of Fed rate cuts in 2024 harden; Citi: very much in line with soft-landing view; quits, separations, openings all down.
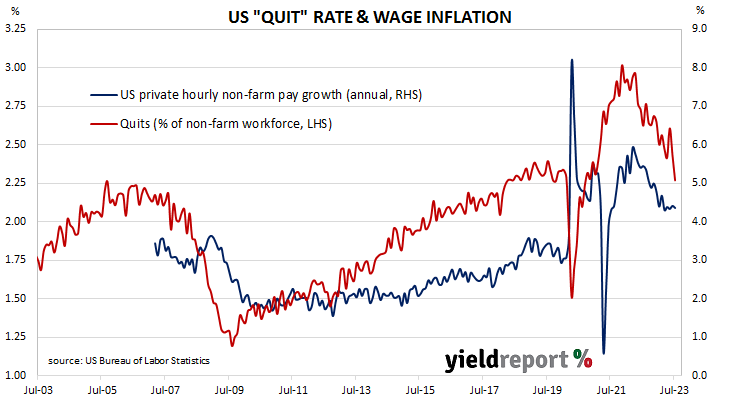
The number of US employees who quit their jobs as a percentage of total employment increased slowly but steadily after the GFC. It peaked in March 2019 and then tracked sideways until virus containment measures were introduced in March 2020. The quit rate then plummeted as alternative employment opportunities rapidly dried up. Following the easing of US pandemic restrictions, it proceeded to recover back to its pre-pandemic rate in the third quarter of 2020 and trended higher through 2021 before easing through 2022 and the first half of 2023.
Figures released as part of the latest Job Openings and Labor Turnover Survey (JOLTS) report show the quit rate slipped in July, maintaining its recent downtrend. 2.3% of the non-farm workforce left their jobs voluntarily, down from 2.4% in June. Quits in the month fell by 253,000 while an additional 187,000 people were employed in non-farm sectors.
“The quits rate, a gauge of voluntary separations and often seen as a barometer of buoyancy in the labour market, fell back to 2.3%,” said ANZ economist Kishti Sen. “That gauge is now in line with pre-pandemic readings and suggests that worker optimism at being able to leave their jobs and find another one easily has normalised.”
The figures were released on the same day as the latest conference Board consumer confidence report and US Treasury yields finished the day significantly lower, especially at the short end of the curve. By the close of business, the 2-year Treasury bond yields had shed 15bps to 4.90%, the 10-year yield had lost 9bps to 4.12% while the 30-year yield finished 5bps lower at 4.23%.
In terms of US Fed policy, expectations of a lower federal funds rate in 2024 hardened. At the close of business, contracts implied the effective federal funds rate would average 5.34% in September, slightly above the current spot rate, and then average 5.365% in October. December futures contracts implied a 5.45% average effective federal funds rate while August 2024 contracts implied 4.82%, 51bps less than the current rate.
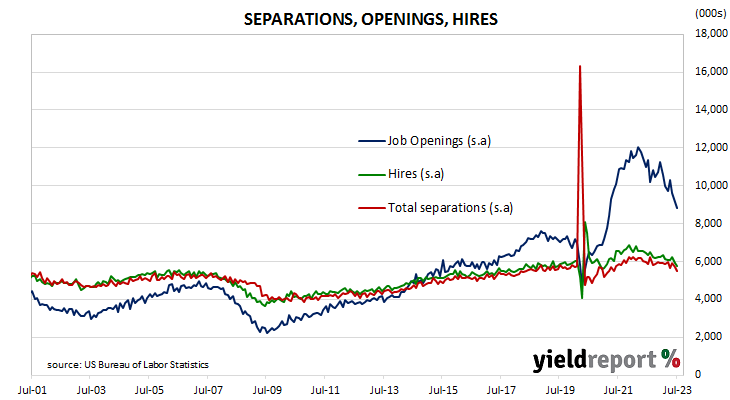
Citi senior economist Andrew Hollenhorst expanded on Sen’s point. “The combination of a pre-pandemic quit rate and a ratio of openings to unemployed individuals that is steadily falling back toward a pre-pandemic norm is very much in line with the dovish soft-landing view.”
The fall in total quits was led by 166,000 fewer resignations in the “Accommodation and food services” sector while the “Retail trade” sector experienced the largest gain, increasing by 41,000. Overall, the total number of quits for the month fell from June’s revised figure of 3.802 million to 3.549 million.
Total vacancies at the end of July dropped by 338,000, or 3.7%, from June’s revised figure of 9.165 million to 8.827 million. The fall was driven by a 198,000 loss in the “Professional and business services” sector while the “Information” sector experienced the single largest increase, rising by 101,000. Overall, 10 out of 18 sectors experienced fewer job openings than in the previous month.
Total separations decreased by 208,000, or 3.7%, from June’s revised figure of 5.691 million to 5.483 million. The fall was led by the “Accommodation and food services” sector where there were 132,000 fewer separations than in June. Separations decreased in 10 of the 18 sectors.
The “quit” rate time series produced by the JOLTS report is a leading indicator of US hourly pay. As wages account for around 55% of a product’s or service’s price in the US, wage inflation and overall inflation rates tend to be closely related. Former Federal Reserve chief and current Treasury Secretary Janet Yellen was known to pay close attention to it.
July retail sales reverse June fall; still weakening but not collapsing
28 August 2023
Summary: Retail sales up 0.5% in July, greater than expected; ANZ: little growth throughout 2023; ANZ: some upside in 2024; UBS: still weakening but not collapsing; largest influences on result from cafes/restaurants, department stores.
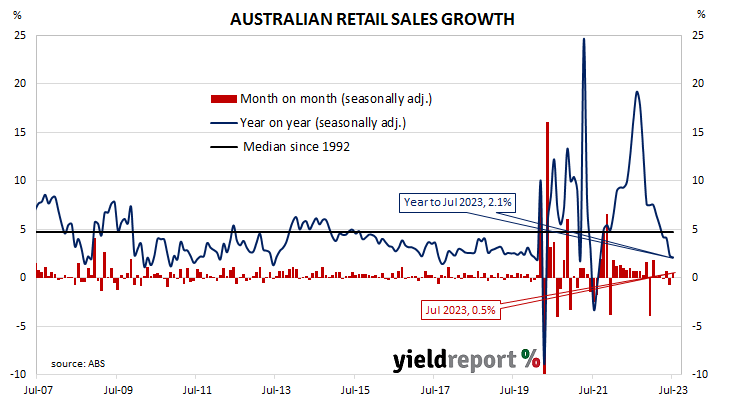
Growth figures of domestic retail sales spent most of the 2010s at levels below the post-1992 average. While economic conditions had been generally favourable, wage growth and inflation rates were low. Expenditures on goods then jumped in the early stages of 2020 as government restrictions severely altered households’ spending habits. Households mostly reverted to their usual patterns as restrictions eased in the latter part of 2020 and throughout 2021.
According to the latest ABS figures, total retail sales increased by 0.5% on a seasonally adjusted basis. The rise was greater than the generally-expected 0.2% increase and in contrast with an 0.8% fall in June. Sales increased by 2.1% on an annual basis, down from June’s figure of 2.3%.
“Despite rapid inflation, there’s been little growth in monthly retail sales throughout 2023, with the series only up 0.9% since January,” noted ANZ economist Madeline Dunk. “The underlying trend in retail sales along with our ANZ-observed spending data shows households are clearly cutting back.”
Long-term Commonwealth Government bond yields moved lower on the day, somewhat following movements of US Treasury yields overnight. By the close of business, the 3-year ACGB yield had inched up 1bp to 3.86%, the 10-year yield had lost 2bp to 4.14% while the 20-year yield finished 4bps lower at 4.45%.
In the cash futures market, expectations regarding further rate rises eased. At the end of the day, contracts implied the cash rate would barely change from the current rate of 4.07% and average 4.075% in September and 4.095% in October. February 2024 contracts implied a 4.185% average cash rate while May 2024 contracts implied 4.205%, 14bps more than the current rate.
Economists, including ANZ’s Dunk, generally expect spending to further weaken in the short term before recovering in 2024. “We think households will continue to tighten their spending throughout 2023. We do, however, see some upside to spending in 2024 as inflation moderates and real household incomes turn positive.”
UBS economist George Tharenou agreed, at least in part. “Overall, our assessment of the consumer outlook, for now, remains a trend which is still weakening but not collapsing.”
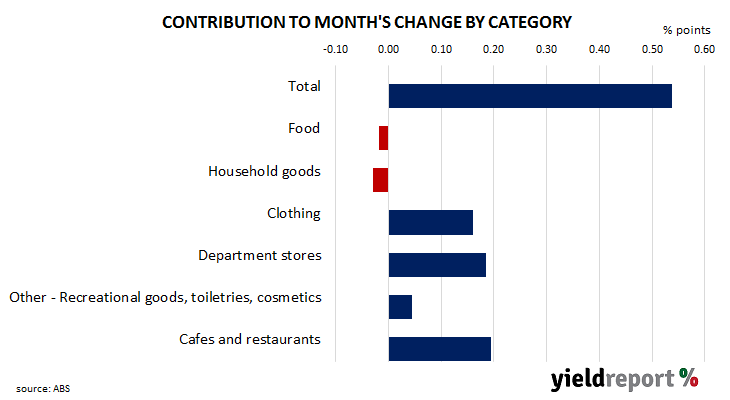
Retail sales are typically segmented into six categories (see below), with the “Food” segment accounting for 40% of total sales. However, the largest influences on the month’s total came from the “Cafes and restaurants” and “Department store” segments where sales rose by 1.3% and 3.6% respectively over the month.
German ifo index down in August; companies “increasingly pessimistic”
25 August 2023
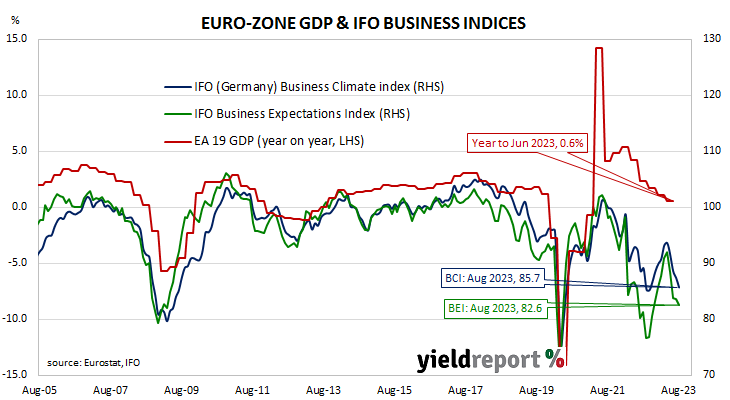
ifo business climate index falls again in August, below expected figure; “companies are increasingly pessimistic”; current conditions index, expectations index both down; expectations index implies euro-zone GDP contraction of 3.0% in year to November.
Following recessions in euro-zone economies in 2009/2010, the ifo Institute’s Business Climate Index largely ignored the European debt-crisis of 2010-2012, mostly posting average-to-elevated readings through to early-2020. However, the index was quick to react in the March 2020 survey, falling precipitously. Readings through much of 2021 generally fluctuated around the long-term average before dropping away in 2022.
According to the latest report released by ifo, German business sentiment has had a fourth consecutive month of decline after increasing in the six months prior to May. August’s Business Climate Index recorded a reading of 85.7, below the generally expected figure of 86.8 as well as July’s final reading of 87.4. The average reading since January 2005 is 96.5.
“Moreover, companies are increasingly pessimistic about the months ahead,” said Clemens Fuest, President of the ifo Institute. “The German economy is not out of the woods yet.”
German firms’ views of current conditions and their collective outlook both deteriorated again. The current situation index fell from July’s figure of 91.4 to 89.0 while the expectations index declined from 83.6 after revisions to 82.6.
German and French long-term bond yields finished higher on the day. By the close of business, the German 10-year yield had gained 5bps to 2.56% while the French 10-year OAT yield finished 3bps higher at 3.08%.
The ifo Institute’s business climate index is a composite index which combines German companies’ views of current conditions with their outlook for the next six months. It has similarities to consumer sentiment indices in the US such as the ones produced by The Conference Board and the University of Michigan.
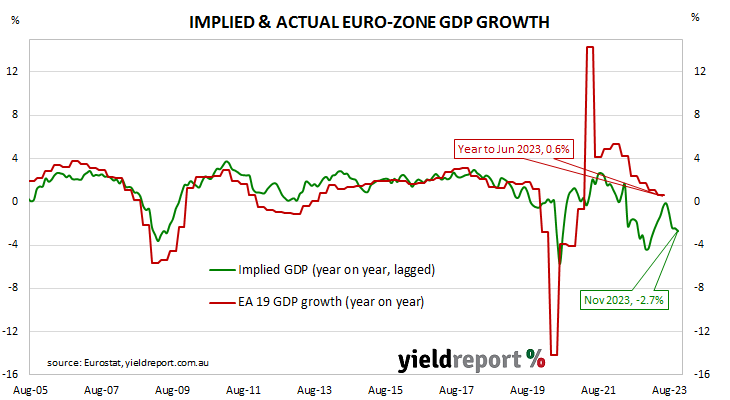
It also displays a solid correlation with euro-zone GDP growth rates. However, the expectations index is a better predictor as it has a higher correlation when lagged by one quarter. August’s expectations index implies a 2.7% year-on-year GDP contraction to the end of November.
US leading index continues falls in Q3; outlook “highly uncertain”
17 August 2023
Summary: Conference Board leading index down 0.4% in July, in line with expectations; outlook remains highly uncertain, currently in favourable growth environment; regression analysis implies 1.8% contraction in year to October.
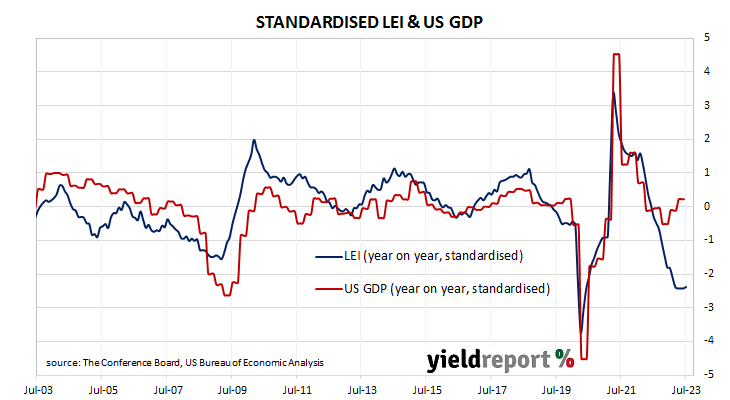
The Conference Board Leading Economic Index (LEI) is a composite index composed of ten sub-indices which are thought to be sensitive to changes in the US economy. The Conference Board describes it as an index which attempts to signal growth peaks and troughs; turning points in the index have historically occurred prior to changes in aggregate economic activity. Readings from March and April of 2020 signalled “a deep US recession” while subsequent readings indicated the US economy would recover rapidly. More recent readings have implied US GDP growth rates will turn negative sometime in 2023.
The latest reading of the LEI indicates it decreased by 0.4% in July. The result was in line with expectations but greater than June’s -0.7%.
“The US LEI, which tracks where the economy is heading, fell for the sixteenth consecutive month in July, signalling the outlook remains highly uncertain,” said Justyna Zabinska-La Monica of The Conference Board. However, she also noted The Conference Board’s coincident index “has continued to grow slowly but inconsistently…signalling that we are currently still in a favourable growth environment.”
Short-term US Treasury bond yields fell on the day while longer-term yields rose. By the close of business, the 2-year Treasury yield had lost 3bps to 4.93% while 10-year and 30-year yield both finished 3bps higher at 4.28% and 4.39% respectively.
In terms of US Fed policy, expectations of a lower federal funds rate in the first half of 2024 firmed. At the close of business, contracts implied the effective federal funds rate would average 5.34% in September, slightly above the current spot rate, and then average 5.36% in October. December futures contracts implied a 5.425% average effective federal funds rate while August 2024 contracts implied 4.785%, 54bps less than the current rate.
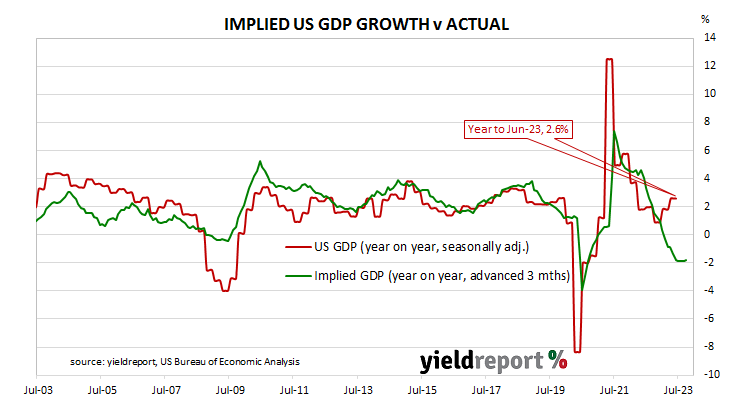
Regression analysis suggests the latest reading implies a -1.8% year-on-year growth rate in October, up from the -1.9% implied by the previous month’s LEI.
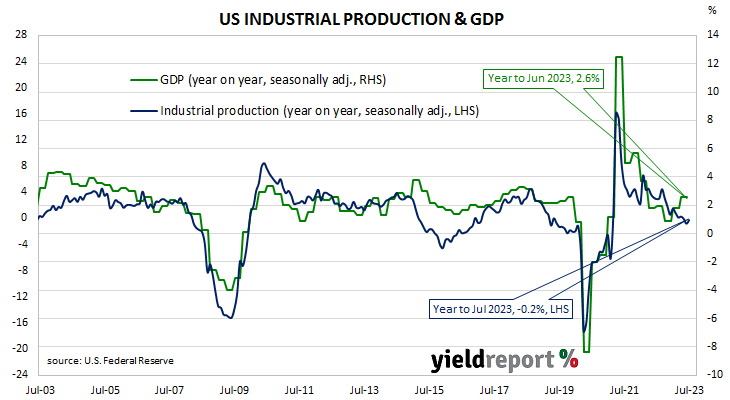
US industrial output up 1.0% in July, above expectations; down 0.2% over past 12 months; NAB: output ex-motor vehicles/parts up 0.1%; long-term Treasury yields rise; rate-cut expectations soften; capacity utilisation rate up 0.7ppts to 79.3%, still below long-term average.
The Federal Reserve’s industrial production (IP) index measures real output from manufacturing, mining, electricity and gas company facilities located in the United States. These sectors are thought to be sensitive to consumer demand and so some leading indicators of GDP use industrial production figures as a component. US production collapsed through March and April of 2020 before recovering the ground lost over the fifteen months to July 2021.
According to the Federal Reserve, US industrial production increased by 1.0% on a seasonally adjusted basis in July. The result was greater than the 0.4% expansion which had been generally expected and in contrast with June’s 0.8% contraction after revisions. On an annual basis the contraction rate slowed from June’s revised figure of 0.8% to 0.2%.
“Auto production was a support to the stronger monthly outcome. Ex-autos, output increased a smaller 0.1% following two consecutive months of declines,” said NAB economist Taylor Nugent.
Long-term US Treasury bond yields increased on the day. By the close of business, the 2-year Treasury yield had returned to its starting point at 4.96%, the 10-year yield had added 3bps to 4.25% while the 30-year yield finished 4bps higher at 4.36%.
In terms of US Fed policy, expectations of a lower federal funds rate in the first half of 2024 softened. At the close of business, contracts implied the effective federal funds rate would average 5.34% in September, slightly above the current spot rate, and then average 5.36% in October. December futures contracts implied a 5.425% average effective federal funds rate while August 2024 contracts implied 4.805%, 53bps less than the current rate.
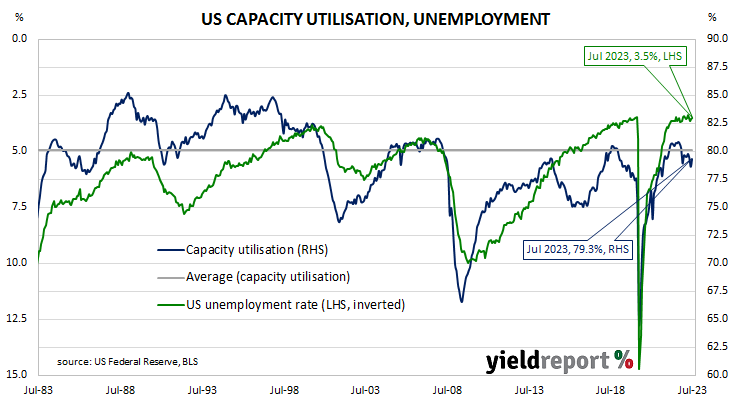
The same report includes US capacity utilisation figures which are generally accepted as an indicator of future investment expenditure and/or inflationary pressures. Capacity usage had hit a high for the last business cycle in early 2019 before it began a downtrend which ended with April 2020’s multi-decade low of 64.2%. July’s reading increased from June’s revised figure of 78.6% to 79.3%, still below the long-term average of 80.1%.
While the US utilisation rate’s correlation with the US jobless rate is solid, it is not as high as the comparable correlation in Australia.
Eurozone economy may be “a little better”; production beats expectations in June
16 August 2023
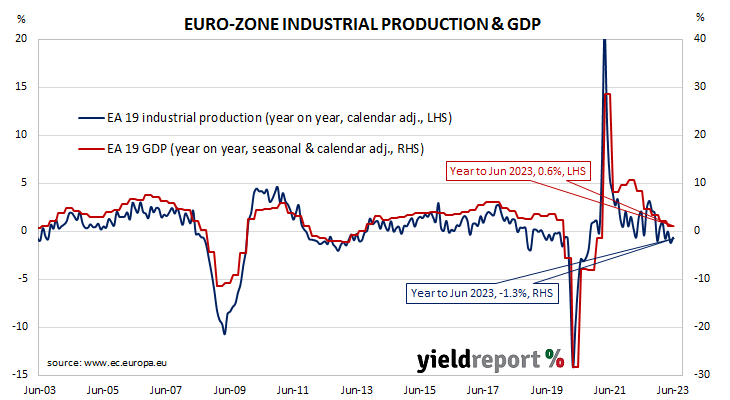
Summary: Euro-zone industrial production up 0.5% in June, contrasts with expected contraction; ANZ: indicates economy may be doing a little better; annual growth rate increases from -2.4% to -1.3%; German, French 10-year yields decline; output expands in just one of four largest euro economies.
Following a recession in 2009/2010 and the debt-crisis which flowed from it, euro-zone industrial production recovered and then reached a peak four years later in 2016. Growth rates then fluctuated for two years before beginning a steady and persistent slowdown from the start of 2018. That decline was transformed into a plunge in March and April of 2020 which then took over a year to claw back. Production levels in recent quarters have generally stagnated in trend terms.
According to the latest figures released by Eurostat, euro-zone industrial production expanded by 0.5% in June on a seasonally-adjusted and calendar-adjusted basis. The result contrasted with the 0.6% contraction which had been generally expected and was higher than May’s flat result. The calendar-adjusted contraction rate on an annual basis slowed, from May revised rate of -2.4% to -1.3% in June.
“This was stronger than expected and indicates the EU economy may be doing a little better,” said ANZ economist Madeline Dunk.
German and French sovereign bond yields declined on the day. By the close of business, German and French 10-year bund yield had both lost 2bps to 2.67% and 3.21% respectively.
Industrial production expanded in only one of the euro-zone’s four largest economies. Germany’s production fell by 1.3% over the month while the comparable figures for France, Spain and Italy were -0.9%, -0.9% and 0.5% respectively.