News

“Turning bleaker”; German ifo index falls for third consecutive month

25 July 2023

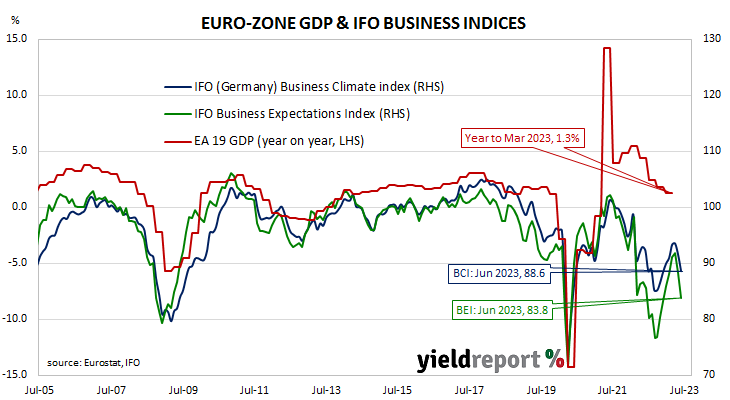
Summary: ifo business climate index falls again in July, slightly below expected figure; “turning bleaker”; current conditions index, expectations index both down; expectations index implies euro-zone GDP contraction of 2.7% in year to October.

Following recessions in euro-zone economies in 2009/2010, the ifo Institute’s Business Climate Index largely ignored the European debt-crisis of 2010-2012, mostly posting average-to-elevated readings through to early-2020. However, the index was quick to react in the March 2020 survey, falling precipitously. Readings through much of 2021 generally fluctuated around the long-term average before dropping away in 2022.

According to the latest report released by ifo, German business sentiment has had a third consecutive month of declines after increasing for the six months prior to May. July’s Business Climate Index recorded a reading of 87.3, slightly below the generally expected figure of 88.0 as well as June’s final reading of 88.6. The average reading since January 2005 is just under 97.

“This is its third consecutive fall. In particular, companies were notably less satisfied with their current business,” said Clemens Fuest, President of the ifo Institute. “The situation in the German economy is turning bleaker.”

German firms’ views of current conditions and their collective outlook both deteriorated. The current situation index fell from June’s figure of 93.7 to 91.3 while the expectations index slipped from 83.8 after revisions to 83.5.

German and French long-term bond yields finished steady on the day. By the close of business, the German and French 10-year yields had both returned to their respective starting points at 2.39% and 2.96%.

The ifo Institute’s business climate index is a composite index which combines German companies’ views of current conditions with their outlook for the next six months. It has similarities to consumer sentiment indices in the US such as the ones produced by The Conference Board and the University of Michigan.

It also displays a solid correlation with euro-zone GDP growth rates. However, the expectations index is a better predictor as it has a higher correlation when lagged by one quarter. July’s expectations index implies a 2.7% year-on-year GDP contraction to the end of October.

“Longest streak of consecutive decreases since 2007/08”; CB leading index down again

20 July 2023

Summary: Conference Board leading index down 0.7% in June, slightly worse than expected; longest streak of consecutive decreases since 2007/2008; regression analysis implies 2% contraction in year to September.

The Conference Board Leading Economic Index (LEI) is a composite index composed of ten sub-indices which are thought to be sensitive to changes in the US economy. The Conference Board describes it as an index which attempts to signal growth peaks and troughs; turning points in the index have historically occurred prior to changes in aggregate economic activity. Readings from March and April of 2020 signalled “a deep US recession” while subsequent readings indicated the US economy would recover rapidly. More recent readings have implied US GDP growth rates will turn negative sometime in 2023.

The latest reading of the LEI indicates it decreased by 0.7% in June. The result was slightly worse than the expected -0.6% as well as May’s revised figure of -0.6%.

“The Leading Index has been in decline for fifteen months, the longest streak of consecutive decreases since 2007/08, during the run-up to the Great Recession,” said Justyna Zabinska-La Monica of The Conference Board. “Taken together, June’s data suggests economic activity will continue to decelerate in the months ahead.”

US Treasury bond yields rose considerably on the day. By the close of business, the 2-year Treasury yield had gained 8bps to 4.86%, the 10-year yield had increased by 10bps to 3.85% while the 30-year yield finished 7bps higher at 3.91%.

In terms of US Fed policy, expectations of a lower federal funds rate in the first half of 2024 softened. At the close of business, contracts implied the effective federal funds rate would average 5.115% in July, 4bps more than the current spot rate, and then increase to an average of 5.315% in August. December futures contracts implied a 5.39% average effective federal funds rate while June 2024 contracts implied 4.84%, 24bps less than the current rate.

Regression analysis suggests the latest reading implies a -2.0% year-on-year growth rate in September, down slightly from the -1.9% implied by the previous month’s LEI.

Back to normal; euro household sentiment up for fourth month

20 July 2023

Summary: Euro-zone household pessimism improves in July; consumer confidence index still noticeably below long-term average, just within lower bound of “normal” readings; euro-zone yields increase materially.

EU consumer confidence plunged during the GFC and again in 2011/12 during the European debt crisis. After bouncing back through 2013 and 2014, it fell back significantly in late 2018 but only to a level which corresponds to significant optimism among households. Following the plunge which took place in April 2020, a recovery began a month later, with household confidence returning to above-average levels from March 2021. However, readings subsequent to early 2022 were extremely low by historical standards until just recently.

Consumer confidence improved for a fourth consecutive month in July according to the latest survey conducted by the European Commission. Its Consumer Confidence Indicator recorded a reading of -15.1, above the generally expected figure of -15.8 as well as June’s -16.1. This latest reading is still noticeably below the long-term average of -10.4 and just inside the lower end of the range in which “normal” readings usually occur.

Sovereign bond yields in major euro-zone bond markets increased materially on the day. By the close of business, the German 10-year bund yield had gained 5bps to 2.45% while the French 10-year OAT yield finished 7bps higher at 3.02%.

Westpac-MI leading index improves in June; 11 months in negative territory

19 July 2023

Summary: Leading index growth rate rises in June; in negative territory for eleventh consecutive month; reading implies annual GDP growth of around 2.25%; ACGB yields fall noticeably; rate-rise expectations soften; US industrial production, dwelling approvals and yield curve main drivers.

Westpac and the Melbourne Institute describe their Leading Index as a composite measure which attempts to estimate the likely pace of Australian economic growth in the short-term. After reaching a peak in early 2018, the index trended lower through 2018 and 2019 before plunging to recessionary levels in the second quarter of 2020. Subsequent readings spiked towards the end of 2020 but then trended lower through 2021, 2022 and the first half of 2023.

The June reading of the six month annualised growth rate of the indicator registered -0.51%, up from May’s revised figure of -1.01%.

“Despite a welcome improvement in the growth rate of the Index in June it remains in negative territory for the eleventh consecutive month,” said Westpac Chief Economist Bill Evans.

Index figures represent rates relative to “trend” GDP growth, which is generally thought to be around 2.75% per annum in Australia. The index is said to lead GDP by “three to nine months into the future” but the highest correlation between the index and actual GDP figures occurs with a three-month lead. The current reading thus represents an annual GDP growth rate of around 2.25% in the next quarter.

Domestic Treasury bond yields fell noticeably on the day, outpacing the falls of US Treasury bonds yields overnight. By the close of business the 3-year ACGB yield had lost 9bps to 3.78%, the 10-year yield had shed 11bps to 3.86% while the 20-year yield finished 12bps lower at 4.15%.

In the cash futures market, expectations regarding further rate rises generally softened. At the end of the day, contracts implied the cash rate would rise from the current rate of 4.07% to average 4.16% in August and then to 4.205% in September. February 2024 contracts implied a 4.345% average cash rate while May 2024 contracts implied 4.32%, 25bps more than the current rate.

Evans noted most of the improvement over the month came from changes in US industrial production, dwelling approvals and the yield curve.

US retail sales creep up in June; consumers rein in spending

18 July 2023

Summary: US retail sales up 0.2% in June, less than expected; annual growth rate slows to 1.5%; ANZ: excess savings may be starting to run dry; Treasury yields rise at short end, fall elsewhere; rate-cut expectations soften; ANZ: spending being reined in; higher sales in seven of thirteen retail categories; online segment largest single influence on month’s result.

US retail sales had been trending up since late 2015 but, commencing in late 2018, a series of weak or negative monthly results led to a drop-off in the annual growth rate below 2.0%. Growth rates then increased in trend terms through 2019 and into early 2020 until pandemic restrictions sent it into negative territory. A “v-shaped” recovery then took place which was followed by some short-term spikes as federal stimulus payments hit US households in the first and second quarters of 2021.

According to the latest “advance” numbers released by the US Census Bureau, total retail sales increased by 0.2% in June. The result was less than the 0.5% increase which had been generally expected as well as May 0.5% rise after it was revised up from 0.3%. On an annual basis, the growth rate slowed from May’s revised rate of 2.0% to 1.5%.

ANZ economist Kishti Sen said the increase “…was not as large as the markets were expecting, indicating excess savings may be starting to run dry.”

The figures came out the same morning as the latest industrial production figures and shorter-term US Treasury bond yields increased while longer-terms yields declined. By the close of business, the 2-year Treasury yield had added 2bps to 4.76%, the 10-year yield had lost 2bps to 3.79% while the 30-year yield finished 3bps lower at 3.90%.

In terms of US Fed policy, expectations of a lower federal funds rate in the first half of 2024 softened slightly. At the close of business, contracts implied the effective federal funds rate would average 5.12% in July, 4bps more than the current spot rate, and then increase to an average of 5.315% in August. December futures contracts implied a 5.37% average effective federal funds rate while June 2024 contracts implied 4.75%, 33bps less than the current rate.

“Sales excluding auto and gas lifted 0.3%” added Sen. “These data underscore consumer resilience although we are starting to see spending being reined in a tad.”

Seven of the thirteen categories recorded higher sales over the month. The “Non-store retailers” segment provided the largest single influence on the overall result, rising by 1.9% over the month and contributing 0.32 percentage points to the total.  

The non-store segment includes vending machine sales, door-to-door sales and mail-order sales but nowadays this segment has become dominated by online sales. It now accounts for over 16% of all US retail sales and it is the second-largest segment after vehicles and parts.

US industrial output falls in June; confirms well-known weakness

18 July 2023

US industrial output down 0.5% in June, below expectations; down 0.4% over past 12 months; NAB: nothing new, figures confirm well-known weakness in US manufacturing; Treasury yields rise at short end, fall elsewhere; rate-cut expectations soften; capacity utilisation rate down 0.5ppts to 78.9%, further below long-term average.

The Federal Reserve’s industrial production (IP) index measures real output from manufacturing, mining, electricity and gas company facilities located in the United States. These sectors are thought to be sensitive to consumer demand and so some leading indicators of GDP use industrial production figures as a component. US production collapsed through March and April of 2020 before recovering the ground lost over the fifteen months to July 2021.

According to the Federal Reserve, US industrial production decreased by 0.5% on a seasonally adjusted basis in June. The contraction contrasted with the flat outcome which had been generally expected and it was in line with the 0.5% contraction in May after revisions. On an annual basis the growth rate slowed from May’s revised figure of 0.0% to -0.4%.

“Not much to see there given already well-known weakness in the manufacturing sector which doesn’t appear to be spilling over to the services side,” said NAB Head of Market Economics Tapas Strickland.

The figures came out the same morning as the latest retail sales figures and shorter-term US Treasury bond yields increased while longer-terms yields declined. By the close of business, the 2-year Treasury yield had added 2bps to 4.76%, the 10-year yield had lost 2bps to 3.79% while the 30-year yield finished 3bps lower at 3.90%.

In terms of US Fed policy, expectations of a lower federal funds rate in the first half of 2024 softened slightly. At the close of business, contracts implied the effective federal funds rate would average 5.12% in July, 4bps more than the current spot rate, and then increase to an average of 5.315% in August. December futures contracts implied a 5.37% average effective federal funds rate while June 2024 contracts implied 4.75%, 33bps less than the current rate.

The same report includes US capacity utilisation figures which are generally accepted as an indicator of future investment expenditure and/or inflationary pressures. Capacity usage had hit a high for the last business cycle in early 2019 before it began a downtrend which ended with April 2020’s multi-decade low of 64.2%. June’s reading decreased from May’s revised figure of 79.4% to 78.9%, a little further below the long-term average of 80.1%.

While the US utilisation rate’s correlation with the US jobless rate is solid, it is not as high as the comparable correlation in Australia.

US household sentiment improves for third consecutive month

14 July 2023

Summary: University of Michigan consumer confidence index improves again, well-above expectations; views of present conditions, future conditions improve; sentiment improves for all demographic groups except lower-income consumers; ANZ: difficult to put comforting spin on lift in 1-year-ahead inflation expectations.

US consumer confidence started 2020 at an elevated level but, after a few months, surveys began to reflect a growing unease with the global spread of COVID-19 and its reach into the US. Household confidence plunged in April 2020 and then recovered in a haphazard fashion, generally fluctuating at below-average levels according to the University of Michigan. The University’s measure of confidence had recovered back to the long-term average by April 2021 but then it plunged again in the September quarter and then remained at historically low levels through 2022 and first half of 2023.

The latest survey conducted by the University indicates confidence among US households has improved on average for a second consecutive month, albeit to a low level. The preliminary reading of the Index of Consumer Sentiment registered 72.6 in July, well-above the generally expected figure of 65.5 as well as June’s final figure of 64.4. Consumers’ views of current conditions and future conditions both improved relative to those held at the time of the June survey.

“Overall, sentiment climbed for all demographic groups except for lower-income consumers,” said the University’s Surveys of Consumers Director Joanne Hsu. “The sharp rise in sentiment was largely attributable to the continued slowdown in inflation along with stability in labour markets.”

US Treasury bond yields rose on the day. By the close of business, the 2-year Treasury yield had gained 9bps to 4.74%, the 10-year yield had added 6bps to 3.83% while the 30-year yield finished 3bps higher at 3.93%.

In terms of US Fed policy, expectations of a lower federal funds rate in the first half of 2024 softened. At the close of business, contracts implied the effective federal funds rate would average 5.115% in July, 4bps more than the current spot rate, and then increase to an average of 5.31% in August. December futures contracts implied a 5.365% average effective federal funds rate while June 2024 contracts implied 4.735%, 35bps less than the current rate.

“The fall in consumer confidence as inflation has risen has overstated the weakness in retail, and any rise that’s related to the anticipated fall in headline inflation is corresponding likely to overstate the impetus to spending,” said ANZ rates strategist Gregorius Steven. “However, it’s difficult to put any comforting spin on the lift in US household 1-year-ahead inflation expectations from 3.3% to 3.4% when the consensus had been for a fall, and the key longer-run expectations measure also ticked higher.”

It was once thought less-confident households are generally inclined to spend less and save more; some decline in household spending could be expected to follow. However, recent research suggests the correlation between household confidence and retail spending is quite weak.

US PPI up just 0.1% in June, cements disinflation narrative

13 July 2023

Summary: US producer price index (PPI) up 0.1% in June, less than expected; annual rate slows to 0.2%; “core” PPI up 0.1%; ANZ: helps cement disinflation narrative; Treasury yields fall noticeably; 2024 rate-cut expectations harden; goods prices steady, services prices up 0.2%.

Around the end of 2018, the annual inflation rate of the US producer price index (PPI) began a downtrend which continued through 2019. Months in which producer prices increased suggested the trend may have been coming to an end, only for it to continue, culminating in a plunge in April 2020. Figures returned to “normal” towards the end of that year but were well above the long-term average through 2021, 2022 and the first quarter of 2023.

The latest figures published by the Bureau of Labor Statistics indicate producer prices increased by 0.1% after seasonal adjustments in June. The result was less than the 0.2% rise which had been generally expected but it also contrasted with May’s 0.4% fall. On a 12-month basis, the rate of producer price inflation after seasonal adjustments and revisions slowed from 1.0% in May to 0.2%.

Producer prices excluding foods and energy, or “core” PPI, increased by 0.1% after seasonal adjustments. The result was also less than expected 0.2% increase but it was in line with increases in April and May. The annual rate slowed from May’s revised figure of 2.6% to 2.4%.

“Taken together with yesterday’s below-expectations CPI data, this has helped to cement the disinflation narrative within markets and make them question how many more hikes will be needed,” said ANZ economist Jack Chambers.

US Treasury bond yields fell noticeably on the day. By the close of business, the 2-year Treasury yield had shed 10bps to 4.65%, the 10-year yield had lost 9bps to 3.77% while the 30-year yield finished 5bps lower at 3.90%.

In terms of US Fed policy, expectations of a lower federal funds rate in the first half of 2024 hardened. At the close of business, contracts implied the effective federal funds rate would average 5.11% in July, 3bps more than the current spot rate, and then increase to an average of 5.30% in August. December futures contracts implied a 5.32% average effective federal funds rate while June 2024 contracts implied 4.60%, 47bps less than the current rate.

The BLS stated higher prices for final demand goods remained unchanged on average. Prices of final demand services increased by 0.2%.

The producer price index is a measure of prices received by producers for domestically produced goods, services and construction. It is put together in a fashion similar to the consumer price index (CPI) except it measures prices received from the producer’s perspective rather than from the perspective of a retailer or a consumer. It is another one of the various measures of inflation tracked by the US Fed, along with core personal consumption expenditure (PCE) price data. 

Soft result for May euro-zone industrial production

13 July 2023

Summary: Euro-zone industrial production up 0.2% in May, less than expected; annual growth rate decreases from +0.1% to -2.2%; German, French 10-year yields move substantially lower; output expands in three of four largest euro economies.

Following a recession in 2009/2010 and the debt-crisis which flowed from it, euro-zone industrial production recovered and then reached a peak four years later in 2016. Growth rates then fluctuated for two years before beginning a steady and persistent slowdown from the start of 2018. That decline was transformed into a plunge in March and April of 2020 which then took over a year to claw back. Production levels in recent quarters have generally stagnated in trend terms.

According to the latest figures released by Eurostat, euro-zone industrial production expanded by 0.2% in May on a seasonally-adjusted and calendar-adjusted basis. The result was a little less than the 0.3% expansion which had been generally expected and down from April’s 1.0% increase. The calendar-adjusted growth rate on an annual basis went into reverse, from April revised rate of 0.1% to -2.2% in May.

German and French sovereign bond yields moved substantially lower on the day. By the close of business, the German 10-year bund yield had shed 10bps to 2.44% while the French 10-year OAT yield finished 11bps lower at 3.00%.

Industrial production expanded in three of the euro-zone’s four largest economies. Germany’s production declined by 0.2% over the month while the comparable figures for France, Spain and Italy were 1.3%, 0.7% and 1.6% respectively.

“A clear downtrend”; US CPI up 0.2% in June

12 July 2023

Summary: US CPI up 0.2% in June, less than expected; “core” rate up 0.2%; ANZ: confirms clear downtrend in core inflation; Treasury yields fall materially; rate-cut expectations harden; NAB: core result dominated by airfares, travel, used vehicle prices; non-energy services prices again main driver, adds 0.18 ppts.

The annual rate of US inflation as measured by changes in the consumer price index (CPI) halved from nearly 3% in the period from July 2018 to February 2019. It then fluctuated in a range from 1.5% to 2.0% through 2019 before rising above 2.0% in the final months of that year. Substantially lower rates were reported from March 2020 to May 2020 and they remained below 2% until March 2021. Rates have since risen significantly, although they have been declining since mid-2022.

The latest US CPI figures released by the Bureau of Labor Statistics indicated seasonally-adjusted consumer prices also increased by 0.2% on average in June. The result was less than the 0.3% increase which had been generally expected but more than May’s 0.1% rise. On a 12-month basis, the inflation rate slowed from 4.1% to 3.1%.

“Headline” inflation is known to be volatile and so references are often made to “core” inflation for analytical purposes. The core prices index, the index which excludes the more variable food and energy components, increased by 0.2% on a seasonally-adjusted basis over the month. The rise was less than the expected 0.3% increase as well as May’s 0.4% increase and the annual growth rate slowed from 5.3% to 4.9%.

“Overall, the report confirms a clear downtrend in core inflation is evident in the US,” said ANZ economist Madeline Dunk.

US Treasury bond yields fell materially on the day By the close of business, the 2-year Treasury yield had shed 12bps to 4.75%, the 10-year yield had lost 11bps to 3.86% while the 30-year yield finished 6bps lower at 3.95%.

In terms of US Fed policy, expectations of a lower federal funds rate in the first half of 2024 hardened. At the close of business, contracts implied the effective federal funds rate would average 5.11% in July, 3bps more than the current spot rate, and then increase to an average of 5.30% in August. December futures contracts implied a 5.35% average effective federal funds rate while June 2024 contracts implied 4.745%, 33bps less than the current rate.

“The soft print was dominated by a few factors such as airfares, travel and used vehicle prices,” noted NAB Senior Interest Rate Strategist (Markets) Ken Crompton. “The core service ex-rents measure was steady and, annualising at 2.9% for the three months to June, is still running fairly hot.  However it’s well down on the 4.8% pace for the annualised three months to March.”

The largest influence on headline results is often the change in fuel prices. Prices of “Energy commodities”, the segment which contains vehicle fuels, increased by 0.8% and contributed 0.03 percentage points to the total. However, prices of non-energy services, the segment which includes actual and implied rents, again had the largest effect on the total, adding 0.18 percentage points after increasing by 0.3% on average.

The Federal Reserve Bank of New York publishes an unofficial estimate of underlying inflation, known as the Underlying Inflation Gauge (UIG) and it was updated shortly after these latest CPI figures. While the Federal Reserve states the UIG does not represent an official estimate, the UIG does appear to lead the core CPI measure. June’s UIG registered an annual rate of 3.2%, down from May’s figure of 3.6%.

Click for more news