News

Westpac-MI July survey: consumer sentiment improves, still low

11 July 2023

Summary: Household sentiment improves for second consecutive month; “remains at deeply pessimistic levels”; main drags on sentiment “surging cost of living”, “sharply higher interest rates”; four of five sub-indices higher; fewer respondents expecting higher jobless rate.

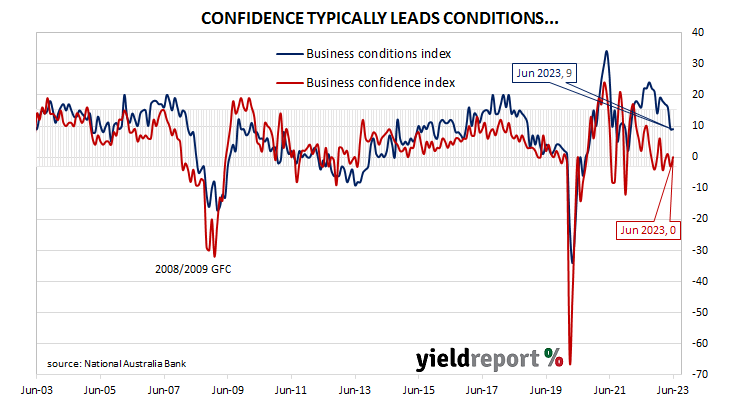
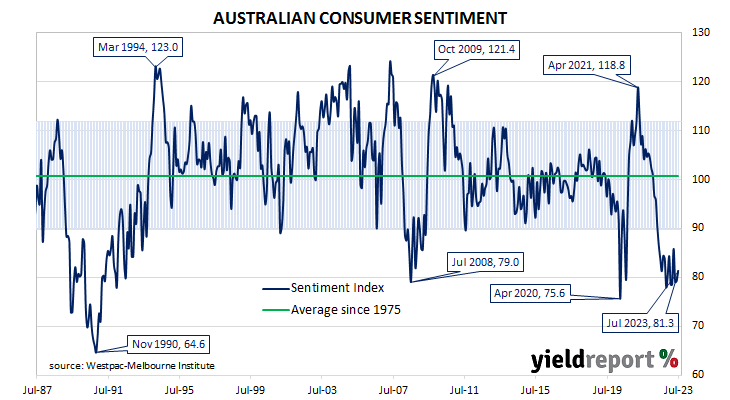
After a lengthy divergence between measures of consumer sentiment and business confidence in Australia which began in 2014, confidence readings of the two sectors converged again in mid-July 2018. Both measures then deteriorated gradually in trend terms, with consumer confidence leading the way. Household sentiment fell off a cliff in April 2020 but, after a few months of to-ing and fro-ing, it then staged a full recovery. However, consumer sentiment has deteriorated significantly over the past two years, while business sentiment has been more robust.

According to the latest Westpac-Melbourne Institute survey conducted in the first week of July, household sentiment has improved for a second consecutive month, albeit to a level which is still quite depressed.  Their Consumer Sentiment Index increased from June’s reading of 79.2 to 81.3, a reading which is well below the “normal” range and significantly lower than the long-term average reading of just over 101.

Sentiment remains at the deeply pessimistic levels that have prevailed for just over a year now,” said Westpac Chief Economist Bill Evans. “The Index plunged 17% over the first half of 2022 and has barely budged since then, holding in the very weak 78-86 range.”

Any reading of the Consumer Sentiment Index below 100 indicates the number of consumers who are pessimistic is greater than the number of consumers who are optimistic.

The report was released on the same day as the latest NAB business survey and Commonwealth Government bond yields fell on the day. By the close of business, the 3-year ACGB yield had shed 10bps to 4.11%, the 10-year yield had lost 11bps to 4.18% while the 20-year yield finished 8bps lower at 4.41%.

In the cash futures market, expectations regarding further rate rises softened. At the end of the day, contracts implied the cash rate would rise from the current rate of 4.07% to average 4.20% in August and then to 4.27% in September. February 2024 contracts implied a 4.545% average cash rate as did May 2024 contracts, 47bps more than the current rate.

“The main drags on sentiment throughout this period of depressingly low consumer sentiment have been the surging cost of living and sharply higher interest rates,” Evans added. “Our research suggests inflation has been the more dominant factor.”

Four of the five sub-indices registered higher readings, with the “Family finances – next 12 months” sub-index posting the largest monthly percentage gain.

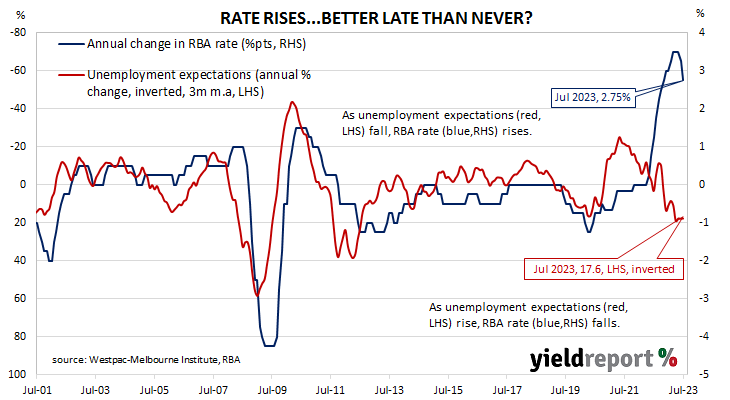
The Unemployment Expectations index, formerly a useful guide to RBA rate changes, eased from 131.3 to 131.2. Lower readings result from more respondents expecting a lower unemployment rate in the year ahead.

June business indices hold up; “softness ahead”

11 July 2023

Summary: Business conditions steady in June; business less pessimistic, still below average; NAB: leading indicators in the survey point to softness ahead; Westpac: sharp weakening of business conditions evident in May confirmed in June; capacity utilisation rate declines, remains elevated.

NAB’s business survey indicated Australian business conditions were robust in the first half of 2018, with a cyclical-peak reached in April of that year. Readings from NAB’s index then began to slip and forecasts of a slowdown in the domestic economy began to emerge in the first half of 2019 as the index trended lower. It hit a nadir in April 2020 as pandemic restrictions were introduced but then conditions improved markedly over the next twelve months. Subsequent readings were generally in a historically-normal range until the second half of 2022.

According to NAB’s latest monthly business survey of around 500 firms conducted in last week-and-a-half of June, business conditions have remained steady at a level which is slightly above average. NAB’s conditions index registered 9 points, unchanged from May’s revised reading.

Business confidence improved.  NAB’s confidence index rose from May’s revised reading of -3 points to zero, still below the long-term average.  Typically, NAB’s confidence index leads the conditions index by one month, although some divergences have appeared from time to time.

“The resilience came despite warning signs of slowing growth elsewhere in the survey in recent months,” said NAB Chief Economist Alan Oster, “and leading indicators in the June survey continued to point to softness ahead with confidence at 0 index points and forward orders remaining in negative territory.”

The report was released on the same day as the latest Westpac-Melbourne Institute consumer sentiment survey and Commonwealth Government bond yields fell on the day. By the close of business, the 3-year ACGB yield had shed 10bps to 4.11%, the 10-year yield had lost 11bps to 4.18% while the 20-year yield finished 8bps lower at 4.41%.

In the cash futures market, expectations regarding further rate rises softened. At the end of the day, contracts implied the cash rate would rise from the current rate of 4.07% to average 4.20% in August and then to 4.27% in September. February 2024 contracts implied a 4.545% average cash rate as did May 2024 contracts, 47bps more than the current rate.

Westpac senior economist Andrew Hanlan took a similar line to NAB’s Oster. “The sharp weakening of business conditions evident in May was confirmed in June, as forward orders record back-to-back declines, while business confidence remains soft and fragile.”

NAB’s measure of national capacity utilisation declined from May’s revised reading of 84.5% to 83.5%, remaining at a historically-elevated level. All eight sectors of the economy were reported to be operating above or at their respective long-run averages.

Capacity utilisation is generally accepted as an indicator of future investment expenditure and it also has a strong inverse relationship with Australia’s unemployment rate.

US non-farm payrolls numbers suggest modest slowing

07 July 2023

Summary: Non-farm payrolls up 209,000 in June, greater than expected; previous two months’ figures revised down by 110,000; jobless rate ticks down to 3.6%, participation rate steady; NAB: suggestive of modest trend slowing of net hiring; employed-to-population ratio steady; underutilisation rate up; annual hourly pay growth steady at 4.4%.

The US economy ceased producing jobs in net terms as infection controls began to be implemented in March 2020. The unemployment rate had been around 3.5% but that changed as job losses began to surge through March and April of 2020. The May 2020 non-farm employment report represented a turning point and subsequent months provided substantial employment gains. Changes in recent months have been generally more modest but still above the average of the last decade.

According to the US Bureau of Labor Statistics, the US economy created an additional 209,000 jobs in the non-farm sector in June. The increase was slightly higher than the 200,000 which had been generally expected and but less than the 306,000 jobs which had been added in May after revisions. Employment figures for April and May were revised down by a total of 110,000.

The total number of unemployed decreased by 140,000 to 5.957 million while the total number of people who were either employed or looking for work increased by 133,000 to 166.951 million. These changes led to the US unemployment rate ticking down from May’s figure of 3.7% to 3.6% as the participation rate remained steady at 62.6%.

NAB economist Taylor Nugent said the figures were “suggestive of modest trend slowing in the pace of net hiring but still robust pace of employment gains.”

Shorter-term US Treasury yields fell on the day but longer-term yield rose. By the close of business, the 2-year yield had shed 5bps to 4.95%, the 10-year yield had gained 3bps to 4.07% while the 30-year yield finished 4bps higher at 4.04%.

In terms of US Fed policy, expectations of a lower federal funds rate in the first half of 2024 firmed. At the close of business, contracts implied the effective federal funds rate would average 5.11% in July, 3bps more than the current spot rate, and then increase to an average of 5.30% in August. December futures contracts implied a 5.40% average effective federal funds rate while June 2024 contracts implied 4.965%, 10bps less than the current rate.

One figure which is indicative of the “spare capacity” of the US employment market is the employment-to-population ratio. This ratio is simply the number of people in work divided by the total US population. It hit a cyclical-low of 58.2 in October 2010 before slowly recovering to just above 61% in late-2019. June’s reading remained steady at 60.3%, some way from the April 2000 peak reading of 64.7%.

Apart from the unemployment rate, another measure of tightness in the labour market is the underutilisation rate and the latest reading of it registered 6.9%, up from 6.7% in May. Wage inflation and the underutilisation rate usually have an inverse relationship and hourly pay growth in the year to June remained steady after revisions at 4.4%.

US quit rate bounces in May, suggests “increased confidence”

06 July 2023

Summary: US quit rate rises to 2.6% in May; NAB: higher quit rate suggests increased confidence in labour market; US Treasury yields up; expectations of lower Fed rates in 2024 soften; quits and separations up, openings down; ANZ: quits rate also trending lower.

The number of US employees who quit their jobs as a percentage of total employment increased slowly but steadily after the GFC. It peaked in March 2019 and then tracked sideways until virus containment measures were introduced in March 2020. The quit rate then plummeted as alternative employment opportunities rapidly dried up. Following the easing of US pandemic restrictions, it proceeded to recover back to its pre-pandemic rate in the third quarter of 2020 and trended higher through 2021 before easing through 2022 and early 2023.

Figures released as part of the latest Job Openings and Labor Turnover Survey (JOLTS) report show the quit rate bounced in May after declining for two consecutive months. 2.6% of the non-farm workforce left their jobs voluntarily, up from 2.4% in April. Quits in the month rose by 250,000 while an additional 339,000 people were employed in non-farm sectors.

NAB Head of Market Economics Tapas Strickland said the rise in the quits rate suggested “increased confidence in the labour market.”

US Treasury yields moved higher on the day, aided by ADP payroll and ISM services reports which were stronger than expected. By the close of business, the 2-year had added 5bps to 5.00%, the 10-year yield had gained 10bps to 4.04% while the 30-year yield finished 7bps higher at 4.00%.

In terms of US Fed policy, expectations of a lower federal funds rate in the first half of 2024 softened. At the close of business, contracts implied the effective federal funds rate would average 5.11% in July, 3bps more than the current spot rate, and then increase to an average of 5.295% in August. December futures contracts implied a 5.43% average effective federal funds rate while June 2024 contracts implied 5.035%, 4bps less than the current rate.

ANZ’s Head of FX Research, Mahjabeen Zaman, took a different message from the figures. “The quits rate rose by 0.2% points but is also trending lower, suggesting weaker wage growth ahead.”

The rise in total quits was led by 69,000 more resignations in the “Health care and social assistance” sector while the “Wholesale trade” sector experienced the largest loss, decreasing by 18,000. Overall, the total number of quits for the month rose from April’s revised figure of 3.765 million to 4.015 million.

Total vacancies at the end of May dropped by 0.496 million, or 4.8%, from April’s revised figure of 10.320 million to 9.824 million. The fall was driven by a 285,000 loss in the “Health care and social assistance” sector while the “Professional and business services” sector experienced the single largest increase, rising by 94,000. Overall, 10 out of 18 sectors experienced fewer job openings than in the previous month.  

Total separations increased by 211,000, or 3.7%, from April’s revised figure of 5.660 million to 5.871 million. The rise was led by the “Retail trade” sector where there were 113,000 more separations than in April. Separations increased in 11 of the 18 sectors.

The “quit” rate time series produced by the JOLTS report is a leading indicator of US hourly pay. As wages account for around 55% of a product’s or service’s price in the US, wage inflation and overall inflation rates tend to be closely related. Former Federal Reserve chief and current Treasury Secretary Janet Yellen was known to pay close attention to it.

June ADP report surprises; non-farm forecasts raised

06 July 2023

Summary: ADP payrolls up 497,000 in June, more than double consensus expectations; May increase revised down by 11,000; NAB: report has raised June non-farm payroll forecasts; positions up in small and medium businesses, down in large ones; little over 75% of gains in services sector, led by leisure/hospitality sector.

The ADP National Employment Report is a monthly report which provides an estimate of US non-farm workers in the private sector. Publishing of the report began in 2006 and its figures exhibited a high correlation with official non-farm payroll figures even though large differences arose in individual months. A major revamp of the ADP report took place in mid-2022, materially altering the data. However, month-on-month changes in both the non-farm payroll data and ADP series are still highly correlated.

The latest ADP report indicated private sector employment increased by 497,000 in June, more than double the 225,000 increase which had been generally expected. May’s rise was revised down by 11,000 to 267,000.

NAB Head of Market Economics Tapas Strickland said the figures should have some effect on forecasts for the upcoming June non-farm payrolls report. “On the back of the data a few analysts have lifted their Payroll expectations tonight; consensus sits at 230,000.”

US Treasury yields moved higher on the day, aided by the latest ISM services report which was also stronger than expected. By the close of business, the 2-year had added 5bps to 5.00%, the 10-year yield had gained 10bps to 4.04% while the 30-year yield finished 7bps higher at 4.00%.

In terms of US Fed policy, expectations of a lower federal funds rate in the first half of 2024 softened. At the close of business, contracts implied the effective federal funds rate would average 5.11% in July, 3bps more than the current spot rate, and then increase to an average of 5.295% in August. December futures contracts implied a 5.43% average effective federal funds rate while June 2024 contracts implied 5.035%, 4bps less than the current rate.

Employment numbers in net terms increased at in small and medium-sized large businesses while contracting large enterprises. Firms with less than 50 employees gained a net 299,000 positions, mid-sized firms (50-499 employees) added183,000 positions while large businesses (500 or more employees) accounted for 8,000 fewer employees.

Employment at service providers accounted for a little over 75% of the total net increase, or 373,000 positions. The “Leisure and hospitality” sector was the largest single source of gains, with 232,000 more positions. Total jobs among goods producers increased by a net 124,000 positions.

Prior to the ADP report, the consensus estimate of the change in June’s official non-farm employment figure was +200,000. The non-farm payroll report will be released by the Bureau of Labor Statistics this coming Friday night (AEST), 7 July.

US manufacturing in “de facto recession”: ISM PMI falls in June

03 July 2023

Summary: ISM PMI down in June, below expectations; ISM: indicates seventh month of contraction; US Treasury yields rise modestly; expectations of Fed rate cuts in 2024 soften; NAB: figures highlight “de facto recession” in US manufacturing; ISM: reading corresponds to 1.0% US GDP contraction annualised.

The Institute of Supply Management (ISM) manufacturing Purchasing Managers Index (PMI) reached a cyclical peak in September 2017. It then started a downtrend which ended in March 2020 with a contraction in US manufacturing which lasted until June 2020. Subsequent month’s readings implied growth had resumed, with the index becoming stronger through to March 2021. Readings have since declined fairly steadily.

According to the ISM’s June survey, its PMI recorded a reading of 46.0%,  below the generally expected figure of 47.1% as well as May’s 46.9%. The average reading since 1948 is 53.0% and any reading below 50% implies a contraction in the US manufacturing sector relative to the previous month.

“Regarding the overall economy, this figure indicates a seventh month of contraction after a 30-month period of expansion,” said Timothy Fiore, Chair of the ISM’s Manufacturing Business Survey Committee.

US Treasury yields finished the day modestly higher. By the close of business, the 2-year Treasury bond yields had gained 3bps to 4.92%, the 10-year yield had added 2bps to 3.86% while the 30-year yield finished 1bp higher at 3.87%.

In terms of US Fed policy, expectations of a lower federal funds rate in the first half of 2024 softened. At the close of business, contracts implied the effective federal funds rate would average 5.11% in July, 3bps more than the current spot rate, and then increase to an average of 5.285% in August. December futures contracts implied a 5.385% average effective federal funds rate while June 2024 contracts implied 4.955%, 12bps less than the current rate.

“All key components are now in contractionary territory and highlight the de facto recession being seen in the manufacturing sector,’ said NAB Head of Market Economics Tapas Strickland.

Purchasing managers’ indices (PMIs) are economic indicators derived from monthly surveys of executives in private-sector companies. They are diffusion indices, which means a reading of 50% represents no change from the previous period, while a reading under 50% implies respondents reported a deterioration on average. A reading “above 48.7%, over a period of time, generally indicates an expansion of the overall economy” according to the ISM.    

The ISM’s manufacturing PMI figures appear to lead US GDP by several months despite a considerable error in any given month. The chart below shows US GDP on a “year on year” basis (and not the BEA annualised basis) against US GDP implied by monthly PMI figures. 

According to the ISM and its analysis of past relationships between the PMI and US GDP, June’s PMI corresponds to an annualised contraction rate of 1.0%, or about 0.25% over a quarter. However, regression analysis on a year-on-year basis still suggests a 12-month GDP growth rate of 1.4% five months after this latest report.

The ISM index is one of two monthly US PMIs, the other being an index published by S&P Global. S&P Global produces a “flash” estimate in the last week of each month which comes out about a week before the ISM index is published. The S&P Global flash June manufacturing PMI registered 46.3%, 2.1 percentage points lower than May’s final figure.

“Direction of change is clear”;  job ads index down 2.5% in June

03 July 2023

Summary: Job ads down 2.5% in June; 10.0% lower than June 2022; ANZ: still 47.5% higher than pre-pandemic levels; ACGB yields down noticeably; rate-rise expectations soften; ANZ: direction of change is clear; ad index-to-workforce ratio falls to 0.98.

From mid-2017 onwards, year-on-year growth rates in the total number of Australian job advertisements consistently exceeded 10%. That was until mid-2018 when the annual growth rate fell back markedly. 2019 was notable for its reduced employment advertising and this trend continued into the first quarter of 2020. Advertising plunged in April and May of 2020 as pandemic restrictions took effect but then recovered quite quickly to historically-high levels.

According to the latest ANZ-Indeed figures, total advertisements fell by 2.5% in June on a seasonally adjusted basis. The result followed 0.1% gain and a 0.9% loss in May and April respectively. On a 12-month basis, total job advertisements were 10.0% lower than in June 2022, down from May’s revised figure of -5.9%.

“Despite the dip, Job Ads are still 47.5% higher than pre-pandemic levels and the labour market remains very tight,” said ANZ economist Madeline Dunk.

The figures came out on the same day as several other reports and Commonwealth Government bond yields fell noticeably. By the close of business, 3-year and 10-year ACGB yields had both decreased by 6bps to 3.93% and 3.96% respectively while the 20-year yield finished 8bps lower at 4.22%.

In the cash futures market, expectations regarding further rate rises softened. At the end of the day, contracts implied the cash rate would rise from the current rate of 4.07% to average 4.135% in July and then to 4.275% in August. February 2024 contracts implied a 4.505% average cash rate while May 2024 contracts implied 4.45%, 38bps more than the current rate.

“Businesses continue to report that labour is the biggest constraint on their output and there were 432,000 job vacancies in Q2,” Dunk added. “It will take time for the labour market tightness to ease. But the direction of change is clear and we expect an ongoing and orderly moderation in Job Ads.”

The inverse relationship between job advertisements and the unemployment rate has been quite strong (see below chart), although ANZ themselves called the relationship between the two series into question in early 2019.  A lower job advertisement index as a proportion of the labour force is suggestive of higher unemployment rates in the near future while a rising ratio suggests lower unemployment rates will follow. June’s ad index-to-workforce ratio fell from 1.00 in May to 0.98 after revisions.

In 2008/2009, advertisements plummeted and Australia’s unemployment rate jumped from 4% to nearly 6% over a period of 15 months. When a more dramatic fall in advertisements took place in April 2020, the unemployment rate responded much more quickly.

Private inflation index slows, up 0.1% in June

03 July 2023

Summary: Melbourne Institute Inflation Gauge index up 0.1% in June; up 5.7% on annual basis; ACGB yields down; rate-rise expectations soften.

The Melbourne Institute’s Inflation Gauge is an attempt to replicate the ABS consumer price index (CPI) on a monthly basis. It has turned out to be a reliable leading indicator of the CPI, although there are periods in which the Inflation Gauge and the CPI have diverged for as long as twelve months. On average, the Inflation Gauge’s annual rate tends to overestimate the ABS rate by around 0.1%, at least until recently.

The Melbourne Institute’s latest reading of its Inflation Gauge index indicates consumer prices increased by just 0.1% in June, following increases of 0.9% and 0.2% in May and April respectively. The index rose by 5.7% on an annual basis, down from May’s comparable figure of 5.9%.

The figures came out on the same day as several other reports and Commonwealth Government bond yields fell noticeably. By the close of business, 3-year and 10-year ACGB yields had both decreased by 6bps to 3.93% and 3.96% respectively while the 20-year yield finished 8bps lower at 4.22%.

In the cash futures market, expectations regarding further rate rises softened. At the end of the day, contracts implied the cash rate would rise from the current rate of 4.07% to average 4.135% in July and then to 4.275% in August. February 2024 contracts implied a 4.505% average cash rate while May 2024 contracts implied 4.45%, 38bps more than the current rate.

Given the Inflation Gauge’s tendency to overestimate, the latest figures imply an official CPI reading of 0.4% (seasonally adjusted) for the June quarter or 5.6% in annual terms. However, it is worth noting the annual CPI rate to the end of March was 7.1% while the Inflation Gauge had implied a 5.6% annual rate at the time.

Home loan approvals bounce in May; more weakness expected

03 July 2023

Summary: Value of loan commitments up 4.8% in May; 20.5% lower than May 2022; UBS: figures imply housing credit growth will ease further; ANZ: average owner-occupier mortgage for existing homeowners a touch higher, average first home buyer mortgage sharply lower; value of owner-occupier loan approvals up 4.0%; investor approvals up 6.2%; number of home loan approvals up 5.1%.

The number and value of home-loan approvals began to noticeably increase after the RBA reduced its cash rate target in a series of cuts beginning in mid-2019, potentially ending the downtrend which had been in place since mid-2017. Figures from February through to May of 2020 provided an indication the downtrend was still intact but subsequent figures then pushed both back to elevated levels in 2021. However, there has been a considerable pullback since then.

May’s housing finance figures have now been released and total loan approvals excluding refinancing increased by 4.8% In dollar terms over the month, slightly more than the 4.0% increase which had been generally expected and in contrast with April’s 1.0% fall. On a year-on-year basis, total approvals excluding refinancing fell by 20.5%, up from the previous month’s comparable figure of -25.1%.

“Home loans have bounced in recent months but still imply housing credit growth will ease a bit further over coming months towards [about] 4% year-on-year,” said UBS economist George Tharenou.

The figures came out on the same day as several other reports and Commonwealth Government bond yields fell noticeably. By the close of business, 3-year and 10-year ACGB yields had both decreased by 6bps to 3.93% and 3.96% respectively while the 20-year yield finished 8bps lower at 4.22%.

In the cash futures market, expectations regarding further rate rises softened. At the end of the day, contracts implied the cash rate would rise from the current rate of 4.07% to average 4.135% in July and then to 4.275% in August. February 2024 contracts implied a 4.505% average cash rate while May 2024 contracts implied 4.45%, 38bps more than the current rate.

“Compared to a year ago, the average owner occupier mortgage for existing homeowners is a touch higher while the average first home buyer mortgage is sharply lower, likely due to affordability constraints for those who had not benefitted from previous housing price increases,” said ANZ senior economist Adelaide Timbrell. “External refinancing is just 1% off its March 2023 peak and may signal that borrowers are shopping around on mortgage rates, reducing the impact of monetary tightening on interest payments.”

The total value of owner-occupier loan commitments excluding refinancing increased by 4.0%, a turnaround from April’s 1.4% fall. On an annual basis, owner-occupier loan commitments were 20.2% lower than in May 2022, above April’s comparable figure of -23.5%.

The total value of investor commitments excluding refinancing arrangements increased by 6.2%. The rise followed a 0.2% decline in April, slowing the contraction rate over the previous 12 months from 28.1% after revisions to 20.9%.

The total number of loan commitments to owner-occupiers excluding refinancing increased by 5.1% to 26,253 on a seasonally adjusted basis. The rise was larger than April’s 0.5% increase and the annual contraction rate slowed from 19.9% to 16.2%.

NSW apartment spike behind May home approvals jump

03 July 2023

Summary: Home approval numbers up 20.6% in May, much larger than expected; 9.8% lower than May 2022; Westpac: 150% spike in NSW apartment approvals; ANZ: expect limited further upside; house approvals up 0.3%, apartments up 59.3%; non-residential approvals up 6.8% in dollar terms, residential alterations up 4.3%.

Building approvals for dwellings, that is apartments and houses, headed south after mid-2018. As an indicator of investor confidence, falling approvals had presented a worrying signal, not just for the building sector but for the overall economy. However, approval figures from late-2019 and the early months of 2020 painted a picture of a recovery taking place, even as late as April of that year. Subsequent months’ figures then trended sharply upwards before falling back in 2021 and 2022.

The Australian Bureau of Statistics has released the latest figures from May which show total residential approvals jumped by 20.6% on a seasonally-adjusted basis. The rise was much larger than the 4.0% increase which had been generally expected and in contrast with April’s 6.8% fall after revisions. Total approvals fell by 9.8% on an annual basis, up from the previous month’s figure of -18.7%. Monthly growth rates are often volatile.

“The May gain is largely due to a huge 150% spike in apartment developments in New South Wales,” said Westpac senior economist Matthew Hassan. “The bottom line is that, once we strip out what is very likely volatile high rise ‘noise’, the underlying picture is much more subdued, pointing to, at best, approvals flattening out at weak levels through April/May.”

The figures came out on the same day as several other reports and Commonwealth Government bond yields fell noticeably. By the close of business, 3-year and 10-year ACGB yields had both decreased by 6bps to 3.93% and 3.96% respectively while the 20-year yield finished 8bps lower at 4.22%.

In the cash futures market, expectations regarding further rate rises softened. At the end of the day, contracts implied the cash rate would rise from the current rate of 4.07% to average 4.135% in July and then to 4.275% in August. February 2024 contracts implied a 4.505% average cash rate while May 2024 contracts implied 4.45%, 38bps more than the current rate.

ANZ senior economist Adelaide Timbrell largely agreed with her Westpac counterpart regarding the outlook for approvals. “We expect limited further upside in building approvals in the shorter term given developer funding constraints and still-elevated backlogs.”        

Approvals for new houses increased by 0.3% over the month, a turnaround from April 2.8% rise. On a 12-month basis, house approvals were 15.6% lower than they were in May 2022, up from April’s comparable figure of -16.9%.                                      

Apartment approval figures are usually a lot more volatile and May’s total rose by 59.3% after a 13.6% fall in April. The 12-month growth rate rose from April’s revised rate of -22.0% to -1.7%.

Non-residential approvals increased by 6.8% in dollar terms over the month and were 19.1% higher on an annual basis. Figures in this segment also tend to be rather volatile.

Residential alteration approvals increased by 4.3% in dollar terms over the month and were 4.5% higher than in May 2022.

Click for more news