News

May core PCE: smallest increase in six months

30 June 2023

Summary: US core PCE price index up 0.3% in May, less than expected; annual rate slows from 4.7% to 4.6%; ANZ: smallest monthly increase in six months; short-term Treasury yields rise; Fed rate-cut expectations for 2024 firm.

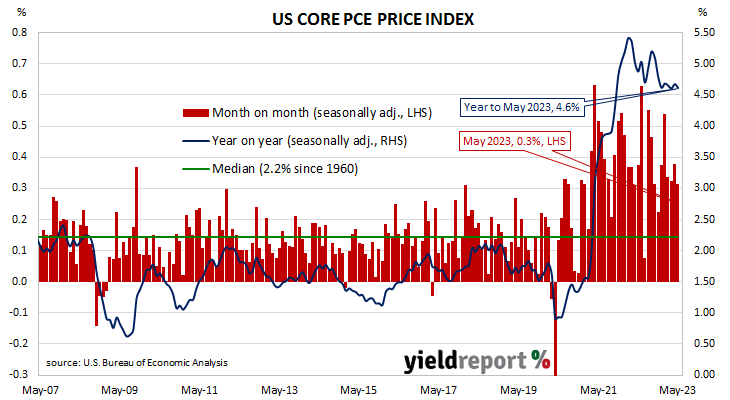
One of the US Fed’s favoured measures of inflation is the change in the core personal consumption expenditures (PCE) price index. After hitting the Fed’s target at the time of 2.0% in mid-2018, the annual rate then hovered in a range between 1.8% and 2.0% before it eased back to a range between 1.5% and 1.8% through 2019. It then plummeted below 1.0% in April 2020 before rising back to around 1.5% in the September quarter of that year. It has since increased significantly and remains above the Fed’s target.

The latest figures have now been published by the Bureau of Economic Analysis as part of the May personal income and expenditures report. Core PCE prices rose by 0.3% over the month, less than expected as well as April’s 0.4% increase. On a 12-month basis, the core PCE inflation rate slowed from April’s rate of 4.7% to 4.6%.

“The annual growth rate is showing little improvement from January [but] it was the smallest monthly increase in six months and core services excluding rents was up just 0.2%,” observed ANZ economist Gregorius Steven.

Short-term US Treasury bond yields rose on the day, while longer-term yields fell. By the close of business, the 2-year Treasury bond yield had gained 3bps to 4.89%, the 10-year yield had returned to its starting point at 3.84% while the 30-year yield finished 4bps lower at 3.86%.

In terms of US Fed policy, expectations of a lower federal funds rate in 2024 firmed. At the close of business, contracts implied the effective federal funds rate would average 5.105% in July, 3bps more than the current spot rate, and then increase to an average of 5.28% in August. December futures contracts implied a 5.385% average effective federal funds rate while June 2024 contracts implied 4.90%, 18bps less than the current rate.

The core version of PCE strips out energy and food components, which are volatile from month to month, in an attempt to identify the prevailing trend. It is not the only measure of inflation used by the Fed; the Fed also tracks the Consumer Price Index (CPI) and the Producer Price Index (PPI) from the Department of Labor. However, it is the one measure which is most often referred to in FOMC minutes.

May private credit up 0.4%; growth broadly stabilised

30 June 2023

Summary: Private sector credit up 0.4% in May, in line with expectations; annual growth rate slows to 6.2%; Westpac: credit growth broadly stabilised at subdued pace; bond yields rise considerably; rate-rise expectations firm; owner-occupier lending segment accounts for 45% of net growth.

The pace of lending growth in the non-bank private sector by financial institutions in Australia followed a steady-but-gradual downtrend from late-2015 through to early 2020 before hitting what appears to be a nadir in March 2021. That downtrend ended later in the same year and annual growth rates shot up through 2022, peaking in October.

According to the latest RBA figures, private sector credit increased by 0.4% in May. The result was in line with  expectations but lees than April’s 0.6% rise. On an annual basis, the growth rate slowed from 6.7% to 6.2%.

“Over the past seven months to May 2023, credit growth has broadly stabilised…at a subdued pace….including a 0.4% outcome for May,” said Westpac senior economist Andrew Hanlan.

Commonwealth Government bond yields moved considerably higher on the day following significant rises of US Treasury yields on Thursday night. By the close of business, 3-year and 10-year ACGB yields had both gained 12bps to 3.99% and 4.02% respectively while the 20-year yield finished 11bps higher to 4.30%.

In the cash futures market, expectations regarding further rate rises generally firmed. At the end of the day, contracts implied the cash rate would rise from the current rate of 4.07% to average 4.17% in July and then to 4.32% in August. February 2024 contracts implied a 4.56% average cash rate while May 2024 contracts implied 4.50%, 43bps more than the current rate.

Owner-occupier lending accounted for about 45% of the net growth over the month, while lending in the business segment accounted for about 33%. Investor lending accounted for most of the balance.

The traditional driver of overall loan growth, the owner-occupier segment, grew by 0.4% over the month, the same rate as in April. The sector’s 12-month growth rate slowed again, this time from 5.8% to 5.6%.

Total lending in the non-financial business sector increased by 0.5%, half the rate of increase recorded in the previous month. Growth on an annual basis slowed from 10.6% to 9.7%.

Monthly growth in the investor-lending segment slowed to a near-halt in early 2018 and essentially stayed that way until mid-2021. In May, net lending grew by 0.2%, down from April’s 0.3%, taking the 12-month growth rate from 4.2% to 3.8%.

Total personal loans rose by 0.2%, in line with April’s growth figure, taking the annual growth rate from -0.3% to 0.2%. This category of debt includes fixed-term loans for large personal expenditures, credit cards and other revolving credit facilities.

June euro-zone composite sentiment index weakens again

29 June 2023

Summary: Euro-zone composite sentiment indicator down in June, slightly below expectations; readings down in four of five sectors; down in three of four largest euro-zone economies; German, French 10-year yields considerably higher after US GDP revisions; index implies annual GDP growth rate of 0.2%.

The European Commission’s Economic Sentiment Indicator (ESI) is a composite index comprising five differently weighted sectoral confidence indicators.  It is heavily weighted towards confidence surveys from the business sector, with the consumer confidence sub-index only accounting for 20% of the ESI. However, it has a good relationship with euro-zone GDP growth rates, although not necessarily as a leading indicator.

The ESI posted a reading of 95.3 in June, slightly below the consensus expectation of 95.7 as well as May’s revised reading of 96.4. The average reading since 1985 is just under 100.

German and French 10-year bond yields finished the day considerably higher, pushed up by higher US Treasury yields after US GDP figures were revised. By the close of business, the German 10-year bund yield had gained 10bps to 2.41% while the French 10-year OAT yield finished 11bps higher at 2.95%.

Confidence deteriorated in four of the five sectors of the economy, consumer confidence the exception. On a geographical basis, the ESI decreased in three of the euro-zone’s four largest economies, Germany, Italy and Spain, but improved again in France.

End-of-quarter ESI readings and annual euro-zone GDP growth rates are highly correlated. This latest reading corresponds to a year-to-June GDP growth rate of 0.2%, down from May’s implied growth rate of 0.5%.

Retail sales spike in May; inflation, population boosting figures

29 June 2023

Summary: Retail sales up 0.7% in May, more than expected; ANZ: does not mark start of rebound; Westpac: declining per capita volumes after inflation, population growth; largest influences on result from “other” (recreational goods, toiletries, cosmetics) sales.

Growth figures of domestic retail sales spent most of the 2010s at levels below the post-1992 average. While economic conditions had been generally favourable, wage growth and inflation rates were low. Expenditures on goods then jumped in the early stages of 2020 as government restrictions severely altered households’ spending habits. Households mostly reverted to their usual patterns as restrictions eased in the latter part of 2020 and throughout 2021.

According to the latest ABS figures, total retail sales increased by 0.7% on a seasonally adjusted basis. The result was above the generally-expected figure of 0.1% as well as April’s flat result. Sales increased by 4.2% on an annual basis, down slightly from April’s revised figure of 4.3%.

“Retail sales surprised to the upside, rising 0.7% in May, but we don’t think the strong May figure marks the start of a rebound in household spending,” said ANZ economist Madeline Dunk. “Households face a range of pressures on their balance sheets and, as such, may be thinking more about how and when to spend money.”

Commonwealth Government bond yields moved higher on the day, ignoring falls in US Treasury yields overnight. By the close of business, the 3-year ACGB yield had gained 6bps to 3.87%, the 10-year yield had added 3bps to 3.90% while the 20-year yield finished 6bps higher at 4.19%.

In the cash futures market, expectations regarding further rate rises firmed. At the end of the day, contracts implied the cash rate would rise from the current rate of 4.07% to average 4.16% in July and then to 4.31% in August. February 2024 contracts implied a 4.495% average cash rate while May 2024 contracts implied 4.47%, 40bps more than the current rate.

“While it goes some way towards easing fears of a contraction in spending in Q2, much of the retail gain still looks to be price-led with volumes tracking a flat quarterly result at best,” said Westpac senior economist Matthew Hassan. He noted “any monthly sales gain below 0.5% likely indicates declining per capita volumes” once inflation and population growth were taken into account.

Retail sales are typically segmented into six categories (see below), with the “Food” segment accounting for 40% of total sales. However, the largest influences on the month’s total came from the “Other” segment where sales increased by 2.2% on average over the month.

Conf. Board confidence index hits 18-month high; consumers still “anticipating recession”

27 June 2023

Summary: Conference Board Consumer Confidence Index rises in June, reading more than expected; highest level since January 2022; consumers still anticipating recession; views of present conditions, short-term outlook both improve.

US consumer confidence clawed its way back to neutral over the five years after the GFC in 2008/2009 and then went from strength to strength until late 2018. Measures of consumer confidence then oscillated within a relatively narrow band at historically high levels until they plunged in early 2020. Subsequent readings then fluctuated around the long-term average until March 2021 when they returned to elevated levels. However, a noticeable gap has since emerged between the two most-widely followed surveys.

The latest Conference Board survey held during the first three weeks of June indicated US consumer confidence has improved. June’s Consumer Confidence Index registered 109.7 on a preliminary basis, above the generally-expected figure of 103.5 as well as May’s final figure of 102.5.

“Consumer confidence improved in June to its highest level since January 2022, reflecting improved current conditions and a pop in expectations,” said Dana Peterson, Chief Economist at The Conference Board.

US Treasury yields moved higher on the day, especially at the short end of the curve. By the close of business, the 2-year Treasury bond yield had jumped 15bps to 4.88%, the 10-year yield had gained 4bps to 3.76% while the 30-year yield finished 3bps higher at 3.84%.

In terms of US Fed policy, expectations of a lower federal funds rate in 2024 softened. At the close of business, contracts implied the effective federal funds rate would average 5.105% in July, 3bps more than the current spot rate, and then increase to an average of 5.26% in August. December futures contracts implied a 5.33% average effective federal funds rate while June 2024 contracts implied 4.78%, 30bps less than the current rate.

Peterson noted the greatest improvements in confidence came from respondents aged under 35 and respondents with incomes over $35,000. However, she also observed “…the expectations gauge continued to signal consumers anticipating a recession at some point over the next 6 to 12 months.”

Consumers’ views of present conditions and of the near-future both improved. The Present Situation Index increased from May’s revised figure of 148.9 to 155.3 while the Expectations Index increased from 71.5 to 79.3.

The Consumer Confidence Survey is one of two widely followed monthly US consumer sentiment surveys which produce sentiment indices. The Conference Board’s index is based on perceptions of current business and employment conditions, as well as respondents’ expectations of conditions six months in the future. The other survey, conducted by the University of Michigan, is similar and it is used to produce an Index of Consumer Sentiment. That survey differs in that it does not ask respondents explicitly about their views of the labour market and it also includes some longer-term questions.

“Steering into turbulent waters”; German ifo index falls again

26 June 2023

Summary: ifo business climate index falls again in June, below expected figure; “steering the German economy into turbulent waters”; current conditions index, expectations index both down; expectations index implies euro-zone GDP contraction of 2.7% in year to September.

Following recessions in euro-zone economies in 2009/2010, the ifo Institute’s Business Climate Index largely ignored the European debt-crisis of 2010-2012, mostly posting average-to-elevated readings through to early-2020. However, the index was quick to react in the March 2020 survey, falling precipitously. Readings through much of 2021 generally fluctuated around the long-term average before dropping away in 2022.

According to the latest report released by ifo, German business sentiment has had a second consecutive month of declines after increasing for the six months prior to May. June’s Business Climate Index recorded a reading of 88.5, below the generally expected figure of 90.7 as well as May’s final reading of 91.5. The average reading since January 2005 is just under 97.

“Sentiment in the German economy has clouded over considerably,” said Clemens Fuest, President of the ifo Institute. “Above all, the weakness in the manufacturing sector is steering the German economy into turbulent waters.”

German firms’ views of current conditions and their collective outlook both deteriorated. The current situation index slipped from May’s figure of 94.8 to 93.7 while the expectations index decreased from 88.3 after revisions to 83.6.

German and French long-term bond yields fell on the day. By the close of business, the German 10-year bund yield had shed 7bps to 2.30% while the French 10-year OAT yield finished 5bps lower at 2.84%.

ANZ economist Jack Chambers noted specific service segments are being affected. “Manufacturing is continuing to weaken and the effects of that are spreading to the service sector, particularly transportation and logistics,”

The ifo Institute’s business climate index is a composite index which combines German companies’ views of current conditions with their outlook for the next six months. It has similarities to consumer sentiment indices in the US such as the ones produced by The Conference Board and the University of Michigan.

It also displays a solid correlation with euro-zone GDP growth rates. However, the expectations index is a better predictor as it has a higher correlation when lagged by one quarter. June’s expectations index implies a 2.7% year-on-year GDP contraction to the end of September.

14 months in a row: Conference Board leading index down again in May

22 June 2023

Summary: Conference Board leading index down 0.7% in May, fall slightly better than expected; index down for  14 consecutive months; regression analysis implies 2% contraction in year to August.

The Conference Board Leading Economic Index (LEI) is a composite index composed of ten sub-indices which are thought to be sensitive to changes in the US economy. The Conference Board describes it as an index which attempts to signal growth peaks and troughs; turning points in the index have historically occurred prior to changes in aggregate economic activity. Readings from March and April of 2020 signalled “a deep US recession” while subsequent readings indicated the US economy would recover rapidly. More recent readings have implied US GDP growth rates will turn negative sometime in 2023.

The latest reading of the LEI indicates it decreased by 0.7% in May. The result was slightly better than the expected -0.8% but it was also below April’s -0.6%.

“The US Leading Index has declined in each of the last fourteen months and continues to point to weaker economic activity ahead,” said Justyna Zabinska-La Monica of The Conference Board. “Rising interest rates paired with persistent inflation will continue to further dampen economic activity.”  

US Treasury bond yields rose on the day, as Fed chief Jerome Powell continued his testimony to the US Congress. By the close of business, 2-year and 10-year Treasury yields had both gained 7bps to 4.79% and 3.80% respectively while the 30-year yield finished 6bps higher at 3.87%.

In terms of US Fed policy, expectations of a lower federal funds rate in 2024 softened noticeably. At the close of business, contracts implied the effective federal funds rate would average 5.11% in July, 3bps more than the current spot rate, and then increase to an average of 5.26% in August. December futures contracts implied a 5.31% average effective federal funds rate while June 2024 contracts implied 4.745%, 33bps less than the current rate.

“While we revised our Q2 GDP forecast from negative to slight growth, we project that the US economy will contract over the Q3 2023 to Q1 2024 period,” said Zabinska-La Monica. “The recession likely will be due to continued tightness in monetary policy and lower government spending.”

Regression analysis suggests the latest reading implies a -2.0% year-on-year growth rate in August, unchanged from July’s figure.

Euro household sentiment improves again in June

22 June 2023

Summary: Euro-zone household pessimism improves in June; consumer confidence index still well below long-term average, lower bound of “normal” readings; euro-zone yields increase materially.

EU consumer confidence plunged during the GFC and again in 2011/12 during the European debt crisis. After bouncing back through 2013 and 2014, it fell back significantly in late 2018 but only to a level which corresponds to significant optimism among households. Following the plunge which took place in April 2020, a recovery began a month later, with household confidence returning to above-average levels from March 2021. However, readings subsequent to early 2022 were extremely low by historical standards until just recently.

Consumer confidence improved modestly in June according to the latest survey conducted by the European Commission. Its Consumer Confidence Indicator recorded a reading of -16.1, above the generally expected figure of -17.0 as well as May’s -17.4. This latest reading is still well below the long-term average of -10.4 and outside the lower end of the range in which “normal” readings usually occur.

Sovereign bond yields in major euro-zone bond markets increased materially on the day. By the close of business, the German 10-year bund yield had gained 5bps to 2.148% while the French 10-year OAT yield finished 7bps higher at 3.02%.

Lowest reading since pandemic; Westpac-MI leading index continues fall in May

21 June 2023

Summary: Leading index growth rate falls in May; lowest reading since pandemic; reading implies annual GDP growth of around 1.75%; ACGB yields fall; rate-rise expectations firm slightly for third quarter, ease for subsequent quarters; Westpac lowers growth forecasts, GDP growth of 0.6%, 1.0% in 2023, 2024.

Westpac and the Melbourne Institute describe their Leading Index as a composite measure which attempts to estimate the likely pace of Australian economic growth in the short-term. After reaching a peak in early 2018, the index trended lower through 2018 and 2019 before plunging to recessionary levels in the second quarter of 2020. Subsequent readings spiked towards the end of 2020 but then trended lower through 2021, 2022 and the first half of 2023.

The May reading of the six month annualised growth rate of the indicator registered -1.09%, down from April’s figure of -0.78%.

“This is the lowest read of the growth rate of the Leading Index since the pandemic,” said Westpac Chief Economist Bill Evans. “It continues the run of negative growth rates which began last August and is entirely consistent with the disappointing growth rates which have been reported for the December and March quarters.”

Index figures represent rates relative to “trend” GDP growth, which is generally thought to be around 2.75% per annum in Australia. The index is said to lead GDP by “three to nine months into the future” but the highest correlation between the index and actual GDP figures occurs with a three-month lead. The current reading thus represents an annual GDP growth rate of around 1.75% in the next quarter.

Domestic Treasury bond yields fell on the day but lagged the falls of US Treasury bonds yields overnight. By the close of business the 3-year ACGB yield had lost 4bps to 3.89% while 10-year and 20-year yields both finished 5bps lower at 3.98% and 4.23% respectively.

In the cash futures market, expectations regarding further rate rises in the third quarter of 2023 firmed slightly while expectations regarding rises in subsequent quarter eased a little. At the end of the day, contracts implied the cash rate would rise from the current rate of 4.07% to average 4.16% in July and then to 4.32% in August. February 2024 contracts implied a 4.48% average cash rate while May 2024 contracts implied 4.39%, 32bps more than the current rate.

Evans noted Westpac had recently downgraded its GDP growth forecasts, expecting 0.6% growth and 1.0% growth for calendar years 2023 and 2024 respectively. These forecasts are now noticeably below the RBA’s latest figures of 1.25% and 1.75% for 2023 and 2024 respectively.

US industrial output outlook “fragile, mixed”; falls 0.2% in May

15 June 2023

Summary: US industrial output down 0.2% in May, below expectations; up 0.2% over past 12 months; ANZ: sector outlook fragile, mixed; Treasury yields fall, rate-cut expectations firm; capacity utilisation rate down 0.2ppts to 79.6%, not far below long-term average.

The Federal Reserve’s industrial production (IP) index measures real output from manufacturing, mining, electricity and gas company facilities located in the United States. These sectors are thought to be sensitive to consumer demand and so some leading indicators of GDP use industrial production figures as a component. US production collapsed through March and April of 2020 before recovering the ground lost over the fifteen months to July 2021.

According to the Federal Reserve, US industrial production decreased by 0.2% on a seasonally adjusted basis in May. The result contrasted with the 0.1% rise which had been generally expected as well as April’s figure of 0.5%. On an annual basis the growth rate slowed from April’s revised figure of 0.4% to 0.2%.

“Strong gains were recorded for aerospace but motor vehicle manufacturing increased by just 0.2%,” said ANZ economist Jack Chambers. “The outlook for the manufacturing sector is fragile and mixed.”

The figures came out the same morning as the latest retail sales figures and US Treasury bond yields fell on the day. By the close of business, the 2-year Treasury yield had lost 6bps to 4.65%, the 10-year yield had shed 7bps to 3.72% while the 30-year yield finished 6bps lower at 3.84%.

In terms of US Fed policy, expectations of a lower federal funds rate in 2024 firmed.  At the close of business, contracts implied the effective federal funds rate would average 5.11% in July, 3bps more than the current spot rate, and then increase to an average of 5.245% in August. December futures contracts implied a 5.22% average effective federal funds rate while June 2024 contracts implied 4.575%, 50bps less than the current rate.

The same report includes US capacity utilisation figures which are generally accepted as an indicator of future investment expenditure and/or inflationary pressures. Capacity usage had hit a high for the last business cycle in early 2019 before it began a downtrend which ended with April 2020’s multi-decade low of 64.2%. May’s reading decreased from April’s revised figure of 79.8% to 79.6%, not far below the long-term average of 80.1%.

While the US utilisation rate’s correlation with the US jobless rate is solid, it is not as high as the comparable correlation in Australia.’

Click for more news