Summary: US industrial output down 0.2% in May, below expectations; up 0.2% over past 12 months; ANZ: sector outlook fragile, mixed; Treasury yields fall, rate-cut expectations firm; capacity utilisation rate down 0.2ppts to 79.6%, not far below long-term average.
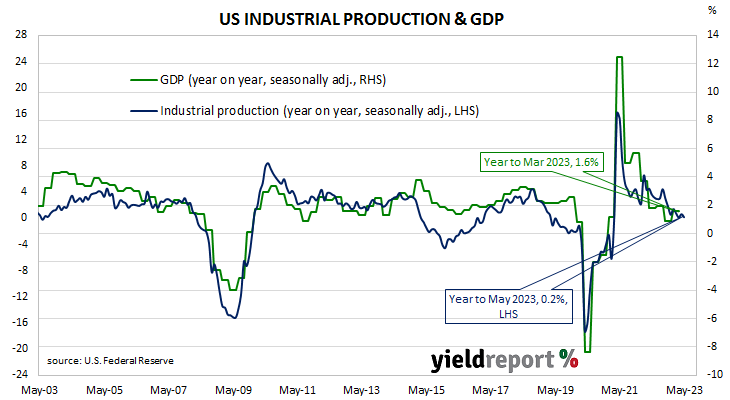
The Federal Reserve’s industrial production (IP) index measures real output from manufacturing, mining, electricity and gas company facilities located in the United States. These sectors are thought to be sensitive to consumer demand and so some leading indicators of GDP use industrial production figures as a component. US production collapsed through March and April of 2020 before recovering the ground lost over the fifteen months to July 2021.
According to the Federal Reserve, US industrial production decreased by 0.2% on a seasonally adjusted basis in May. The result contrasted with the 0.1% rise which had been generally expected as well as April’s figure of 0.5%. On an annual basis the growth rate slowed from April’s revised figure of 0.4% to 0.2%.
“Strong gains were recorded for aerospace but motor vehicle manufacturing increased by just 0.2%,” said ANZ economist Jack Chambers. “The outlook for the manufacturing sector is fragile and mixed.”
The figures came out the same morning as the latest retail sales figures and US Treasury bond yields fell on the day. By the close of business, the 2-year Treasury yield had lost 6bps to 4.65%, the 10-year yield had shed 7bps to 3.72% while the 30-year yield finished 6bps lower at 3.84%.
In terms of US Fed policy, expectations of a lower federal funds rate in 2024 firmed. At the close of business, contracts implied the effective federal funds rate would average 5.11% in July, 3bps more than the current spot rate, and then increase to an average of 5.245% in August. December futures contracts implied a 5.22% average effective federal funds rate while June 2024 contracts implied 4.575%, 50bps less than the current rate.
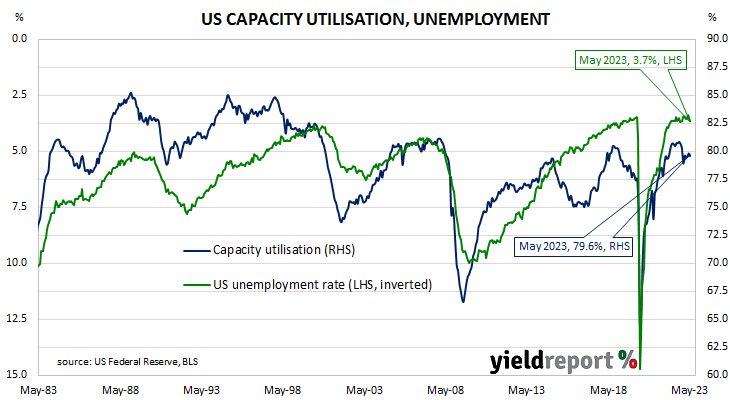
The same report includes US capacity utilisation figures which are generally accepted as an indicator of future investment expenditure and/or inflationary pressures. Capacity usage had hit a high for the last business cycle in early 2019 before it began a downtrend which ended with April 2020’s multi-decade low of 64.2%. May’s reading decreased from April’s revised figure of 79.8% to 79.6%, not far below the long-term average of 80.1%.
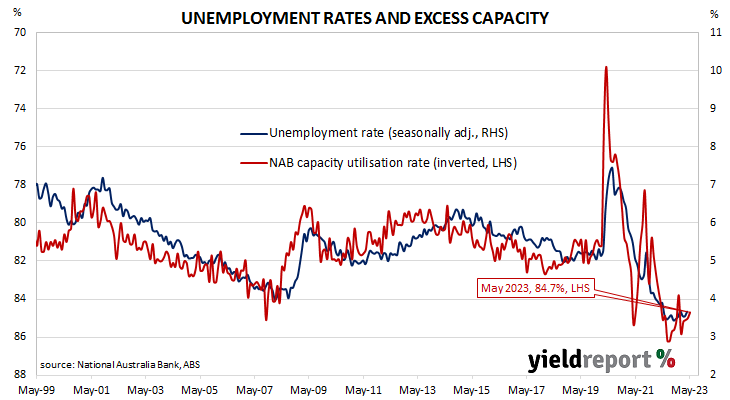
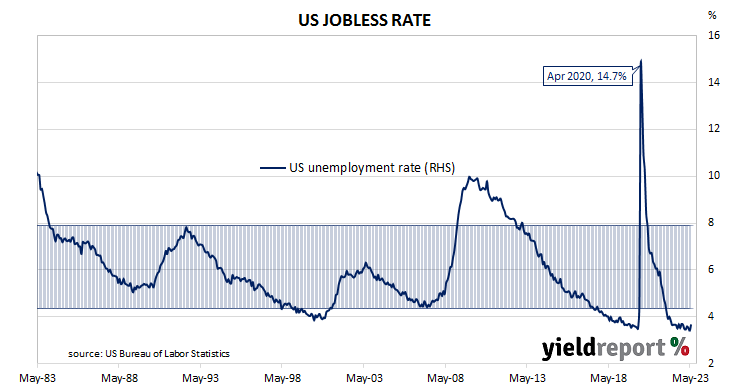
While the US utilisation rate’s correlation with the US jobless rate is solid, it is not as high as the comparable correlation in Australia.’