Summary: ISM PMI down slightly in May, slightly below expectations; ISM: US manufacturing shrinks again, faster rate of contraction; US Treasury yields fall; expectations of Fed rate cuts harden; NAB: favourable in terms of inflation outlook; ISM: reading corresponds to 0.6% US GDP contraction annualised.
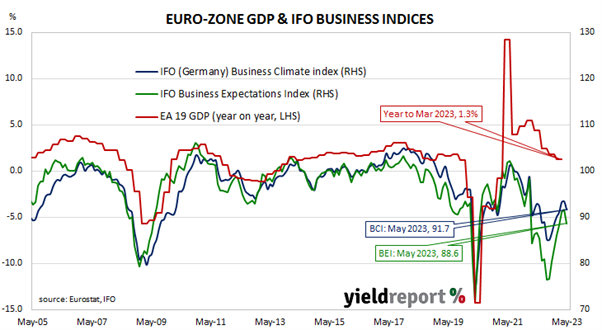
The Institute of Supply Management (ISM) manufacturing Purchasing Managers Index (PMI) reached a cyclical peak in September 2017. It then started a downtrend which ended in March 2020 with a contraction in US manufacturing which lasted until June 2020. Subsequent month’s readings implied growth had resumed, with the index becoming stronger through to March 2021. Readings then declined fairly steadily through to the second quarter of 2023.
According to the ISM’s May survey, its PMI recorded a reading of 46.9%, a touch below the generally expected figure of 47.0% as well as April’s 47.1. The average reading since 1948 is 53.0% and any reading below 50% implies a contraction in the US manufacturing sector relative to the previous month.
“The US manufacturing sector shrank again, with the Manufacturing PMI losing a bit of ground compared to the previous month, indicating a faster rate of contraction,” said Timothy Fiore, Chair of the ISM’s Manufacturing Business Survey Committee.
US Treasury yields finished the day lower. By the close of business, 2-year and 10-year Treasury bond yields had both lost 3bps to 4.34% and 3.61% respectively while the 30-year yield finished 1bp lower at 3.83%.
In terms of US Fed policy, expectations of lower federal funds rates in 2024 hardened. At the close of business, contracts implied the effective federal funds rate would average 5.12% in June, 4bps higher than the current spot rate, and then move up to average 5.16% in July. September futures contracts implied a 5.22% average effective federal funds rate while May 2024 contracts implied 4.17%, 91bps less than the current rate.
“Although close to the consensus, the details were less favourable with New Orders slipping to 42.6 from 45.7,” said NAB Head of Market Economics Tapas Strickland. “On the other hand in terms of inflation it was favourable with Prices Paid falling to 44.2 from 53.2 and Supplier Deliveries [falling to] 43.5 from 44.6, the lowest since 2009.”
Purchasing managers’ indices (PMIs) are economic indicators derived from monthly surveys of executives in private-sector companies. They are diffusion indices, which means a reading of 50% represents no change from the previous period, while a reading under 50% implies respondents reported a deterioration on average. A reading “above 48.7%, over a period of time, generally indicates an expansion of the overall economy” according to the ISM.
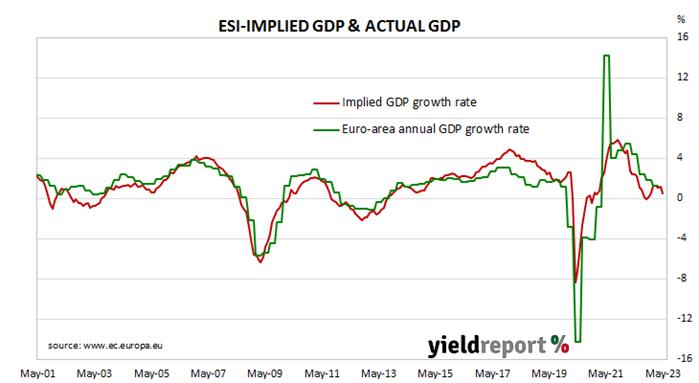
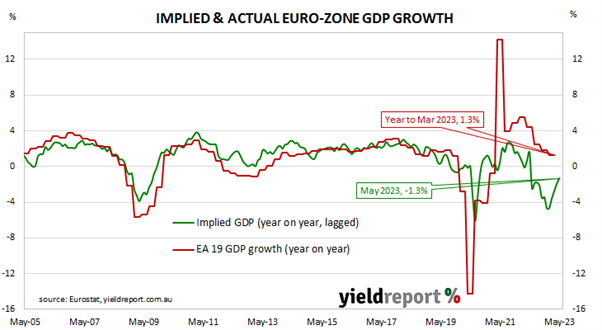
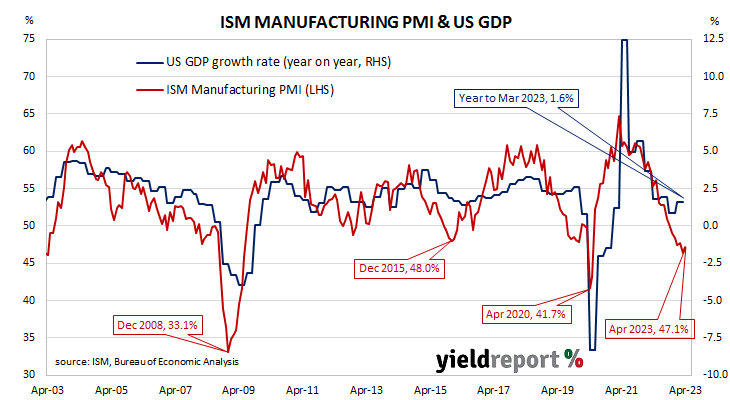
The ISM’s manufacturing PMI figures appear to lead US GDP by several months despite a considerable error in any given month. The chart below shows US GDP on a “year on year” basis (and not the BEA annualised basis) against US GDP implied by monthly PMI figures.
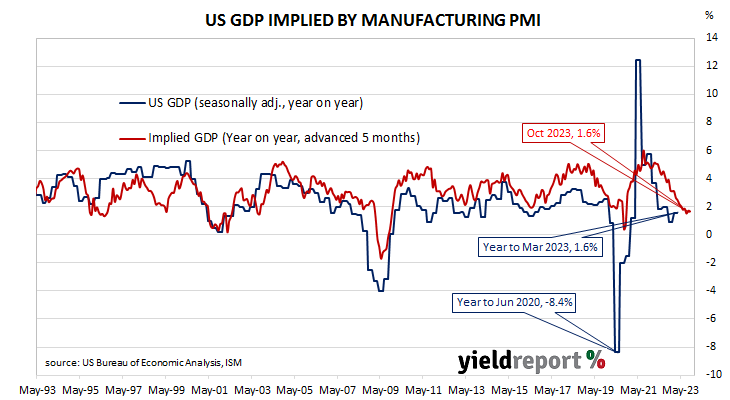
According to the ISM and its analysis of past relationships between the PMI and US GDP, May’s PMI corresponds to an annualised contraction rate of 0.6%, or 0.2% over a quarter. However, regression analysis on a year-on-year basis suggests a 12-month GDP growth rate of 1.6% five months after this latest report.
The ISM index is one of two monthly US PMIs, the other being an index published by S&P Global. S&P Global produces a “flash” estimate in the last week of each month which comes out about a week before the ISM index is published. The S&P Global flash May manufacturing PMI registered 48.5%, 1.7 percentage points lower than April’s final figure.