News

Euro household sentiment at highest since October

22 May 2023

Summary: Euro-zone household pessimism essentially unchanged in May; consumer confidence index still well below long-term average, lower bound of “normal” readings; confidence has improved steadily since October; euro-zone yields barely move.

EU consumer confidence plunged during the GFC and again in 2011/12 during the European debt crisis. After bouncing back through 2013 and 2014, it fell back significantly in late 2018 but only to a level which corresponds to significant optimism among households. Following the plunge which took place in April 2020, a recovery began a month later, with household confidence returning to above-average levels from March 2021. However, readings subsequent to early 2022 have been extremely low by historical standards.

Consumer confidence remained essentially unchanged in May according to the latest survey conducted by the European Commission. Its Consumer Confidence Indicator recorded a reading of -17.4, below the generally expected figure of -16.9 but ever-so-slightly above April’s -17.5. This latest reading is still well below the long-term average of -10.4 as well as the lower end of the range in which “normal” readings usually occur.

“Consumer confidence has improved steadily since October and is at its highest level since February 2022, although stubbornly high inflation may stall the recovery,” said ANZ senior economist Felicity Emmett.

Sovereign bond yields barely moved in major euro-zone bond markets on the day. By the close of business, the German 10-year bund yield had returned its starting point at 2.46% while the French 10-year OAT yield finished 1bp higher at 3.03%.

Conference Board leading index continues slide; down 0.6% in April

18 May 2023

Summary: Conference Board leading index down 0.6% in April, fall slightly worse than expected; CB: LEI continues to warn of economic downturn this year; regression analysis implies 2% contraction in year to July.

The Conference Board Leading Economic Index (LEI) is a composite index composed of ten sub-indices which are thought to be sensitive to changes in the US economy. The Conference Board describes it as an index which attempts to signal growth peaks and troughs; turning points in the index have historically occurred prior to changes in aggregate economic activity. Readings from March and April of 2020 signalled “a deep US recession” while subsequent readings indicated the US economy would recover rapidly. More recent readings have implied US GDP growth rates will turn negative sometime in 2023.

The latest reading of the LEI indicates it decreased by 0.6% in April. The result was slightly worse than the expected -0.5% but above March’s -1.2%.

“Weaknesses among underlying components were widespread but less so than in March’s reading, which resulted in a smaller decline,” said Justyna Zabinska-La Monica of The Conference Board. “Importantly, the LEI continues to warn of an economic downturn this year.

US Treasury bond yields rose noticeably on the day, especially at the short end of the yield curve. By the close of business, the 2-year Treasury yield had gained 11bps to 4.26%, the 10-year yield had added 7bps to 3.65% while the 30-year yield finished 4bps higher at 3.91%.

In terms of US Fed policy, expectations of lower federal funds rates in 2024 softened significantly.  At the close of business, contracts implied the effective federal funds rate would average 5.125% in June, 4bps higher than the current spot rate, and then inch up to an average of 5.16% in July. September futures contracts implied a 5.115% average effective federal funds rate while May 2024 contracts implied 4.005%, 107bps less than the current rate.

Regression analysis suggests the latest reading implies a -2.0% year-on-year growth rate in July, unchanged from June’s revised figure.     

US April retail sales up 0.4%; “brisk start” for June quarter

16 May 2023

Summary: US retail sales up 0.4% in April, less than expected; annual growth rate slows to 1.6%; ANZ: indicates brisk start to private consumption in June quarter; Treasury bond yields rise; rate-cut expectations soften; rises in seven of thirteen retail categories; non-store retailers segment largest single influence on month’s result.

US retail sales had been trending up since late 2015 but, commencing in late 2018, a series of weak or negative monthly results led to a drop-off in the annual growth rate below 2.0%. Growth rates then increased in trend terms through 2019 and into early 2020 until pandemic restrictions sent it into negative territory. A “v-shaped” recovery then took place which was followed by some short-term spikes as federal stimulus payments hit US households in the first and second quarters of 2021.

According to the latest “advance” numbers released by the US Census Bureau, total retail sales increased by 0.4% in April. The result was less than the 0.7% increase which had been generally expected but it was in contrast to March’s -0.7%. On an annual basis, the growth rate slowed from 2.4% to 1.6%.

“The data indicate a brisk start to private consumption for Q2 and will have a positive impact on early GDP estimates for this quarter,” said ANZ senior economist Adelaide Timbrell. “Retail sales account for around 35% of private consumption in the US and the rise in control group sales, which is used to calculate GDP, implied that demand is not yet slowing sufficiently to alleviate underlying inflation imbalances.”

The figures came out the same morning as the latest industrial production figures and US Treasury bond yields rose on the day, especially at the short end of the yield curve. By the close of business, the 2-year Treasury yield had gained 7bps to 4.07%, the 10-year yield had added 4bps to 3.54% while the 30-year yield finished 2bps higher at 3.86%.

In terms of US Fed policy, expectations of a lower federal funds rate through the remainder of 2023 and into 2024 softened a little.  At the close of business, contracts implied the effective federal funds rate would average 5.095% in June, essentially unchanged from the current spot rate, and then creep up a touch to an average of 5.105% in July. September futures contracts implied a 5.005% average effective federal funds rate while May 2024 contracts implied 3.75%, 133bps less than the current rate.

Seven of the thirteen categories recorded higher sales over the month. The “Non-store retailers” segment provided the largest single influence on the overall result, rising by 1.2% over the month and contributing around 0.20 percentage points.

The non-store segment includes vending machine sales, door-to-door sales and mail-order sales but nowadays this segment has become dominated by online sales. It now accounts for over 16% of all US retail sales and it is the second-largest segment after vehicles and parts.

US industrial output surprises in April; previous months revised down

16 May 2023

Summary: US industrial output up 0.5% in April, above expectations; up 0.2% over past 12 months; manufacturing output up on vehicle production; Treasury yields rise, rate-cut expectations soften; capacity utilisation rate up 0.3ppts to 79.7%, just below long-term average.

The Federal Reserve’s industrial production (IP) index measures real output from manufacturing, mining, electricity and gas company facilities located in the United States. These sectors are thought to be sensitive to consumer demand and so some leading indicators of GDP use industrial production figures as a component. US production collapsed through March and April of 2020 before recovering the ground lost over the fifteen months to July 2021.

According to the Federal Reserve, US industrial production increased by 0.5% on a seasonally adjusted basis in April. The result was greater than the zero change which had been generally expected as well as March’s unchanged figure after it was revised down from 0.4%. On an annual basis the growth rate ticked up from March’s revised figure of  0.1% to 0.2%.

“Manufacturing output defied the softness in manufacturing indicators, rising 1% on strength in auto production, though revisions to recent months, means the April rise overstates the strength a little,” said NAB economist Taylor Nugent.

The figures came out the same morning as the latest retail sales figures and US Treasury bond yields rose on the day, especially at the short end of the yield curve. By the close of business, the 2-year Treasury yield had gained 7bps to 4.07%, the 10-year yield had added 4bps to 3.54% while the 30-year yield finished 2bps higher at 3.86%.

In terms of US Fed policy, expectations of a lower federal funds rate through the remainder of 2023 and into 2024 softened a little.  At the close of business, contracts implied the effective federal funds rate would average 5.095% in June, essentially unchanged from the current spot rate, and then creep up a touch to an average of 5.105% in July. September futures contracts implied a 5.005% average effective federal funds rate while May 2024 contracts implied 3.75%, 133bps less than the current rate.

The same report includes US capacity utilisation figures which are generally accepted as an indicator of future investment expenditure and/or inflationary pressures. Capacity usage had hit a high for the last business cycle in early 2019 before it began a downtrend which ended with April 2020’s multi-decade low of 64.2%. April’s reading increased from March’s revised figure of 79.4% to 79.7%, just below the long-term average of 80.1%.

While the US utilisation rate’s correlation with the US jobless rate is solid, it is not as high as the comparable correlation in Australia.

May Budget, RBA drag Westpac-MI sentiment index lower

16 May 2023

Summary: Household sentiment deteriorates in May; back to just above the dismal levels; 60% of fall attributable to May budget, remaining 40% to RBA increase and other factors; all five sub-indices lower; more respondents expecting higher jobless rate.

After a lengthy divergence between measures of consumer sentiment and business confidence in Australia which began in 2014, confidence readings of the two sectors converged again in mid-July 2018. Both measures then deteriorated gradually in trend terms, with consumer confidence leading the way. Household sentiment fell off a cliff in April 2020 but, after a few months of to-ing and fro-ing, it then staged a full recovery. However, consumer sentiment has deteriorated significantly over the past year, while business sentiment has been more robust.

According to the latest Westpac-Melbourne Institute survey conducted in the week before Easter, household sentiment has deteriorated and is at a level which is very depressed. Their Consumer Sentiment Index decreased from April’s reading of 85.8 to 79.0, a reading which is well below the “normal” range and significantly lower than the long-term average reading of just over 101.

“The Index has fallen back to just above the dismal levels seen back in March, which recorded the lowest monthly read since the COVID outbreak in 2020 and, before that, since the deep recession of the early 1990s,” said Westpac Chief Economist Bill Evans.

Any reading of the Consumer Sentiment Index below 100 indicates the number of consumers who are pessimistic is greater than the number of consumers who are optimistic.

Commonwealth Government bond yields fell modestly on the day. By the close of business, the 3-year ACGB yield had slipped 1bp to 3.09% while 10-year and 20-year yields both finished 2bps lower at 3.41% and 3.87% respectively.

In the cash futures market, expectations regarding rate cuts in 2024 softened slightly. At the end of the day, contracts implied the cash rate would remain essentially steady at the current rate of 3.82% to average 3.845% in June and 3.895% in July. February 2024 contracts implied a 3.695% average cash rate while May 2024 contracts implied 3.49%, 33bps less than the current rate.

Evans noted a big difference between respondents surveyed before the Budget and those surveyed afterwards. “Sentiment amongst those surveyed before the Budget announcement showed an index read of 81.3, down 5.3% compared to April. Sentiment amongst those surveyed after the announcement came in at 75.3, down an additional 7.4%. A strict interpretation would attribute about 60% of the May fall to the Federal budget and the remaining 40% to the interest rate decision and other factors.”

All five sub-indices registered lower readings, with the “Family finances – next 12 months” sub-index posting the largest monthly percentage loss.

The Unemployment Expectations index, formerly a useful guide to RBA rate changes, rose from 118.9 to 123.2. Higher readings result from more respondents expecting a higher unemployment rate in the year ahead.

Tiny Ireland a big drag on euro-zone output in March

15 May 2023

Summary: Euro-zone industrial production down 4.1% in March, significantly less than expected; annual growth rate reverses from 1.0% to -1.4%; driven by 26.3% fall in Irish output; German, French 10-year yields creep higher; output contracts in three of four largest euro economies.

Following a recession in 2009/2010 and the debt-crisis which flowed from it, euro-zone industrial production recovered and then reached a peak four years later in 2016. Growth rates then fluctuated for two years before beginning a steady and persistent slowdown from the start of 2018. That decline was transformed into a plunge in March and April of 2020 which then took over a year to claw back. Production levels in more-recent months have generally stagnated in trend terms.

According to the latest figures released by Eurostat, euro-zone industrial production contracted by 4.1% in March on a seasonally-adjusted and calendar-adjusted basis. The result was significantly less than the 2.8% contraction which had been generally expected and in contrast with February’s 1.5% increase. The calendar-adjusted growth rate on an annual basis reversed from February’s revised rate of +2.0% to -1.4%.

ANZ senior economist Catherine Birch noted the fall was driven by 26.3% fall in Irish industrial production which subtracted over 3.0 percentage points. Overall, production of capital goods and intermediate goods both fell while consumer goods production increased.

German and French sovereign bond yields crept a little higher on the day despite the figures. By the close of business, German and French 10-year yields had both added 1bp to 2.30% and 2.87%  respectively.

Industrial production contracted in three of the euro-zone’s four largest economies. Germany’s production decreased by 3.1% over the month while the comparable figures for France, Spain and Italy were -1.1%, +1.4% and -0.6% respectively.

US PPI annual rates down again in April

11 May 2023

Summary: US producer price index (PPI) up 0.2% in April, less than expected; annual rate slows to 2.4%; “core” PPI also up 0.2%; ANZ: ongoing price pressures in core services; Treasury yields down; rate-fall expectations soften; goods prices up 0.2%, services prices up 0.3%.

Around the end of 2018, the annual inflation rate of the US producer price index (PPI) began a downtrend which continued through 2019. Months in which producer prices increased suggested the trend may have been coming to an end, only for it to continue, culminating in a plunge in April 2020. Figures returned to “normal” towards the end of that year but annual rates through 2021 and 2022 were well above the long-term average.

The latest figures published by the Bureau of Labor Statistics indicate producer prices increased by 0.2% after seasonal adjustments in April. The rise was less than the 0.3% increase which had been generally expected but in contrast with March’s 0.4% fall after it was revised up from -0.5%. On a 12-month basis, the rate of producer price inflation after seasonal adjustments and revisions slowed from 2.8% in March to 2.4%.

Producer prices excluding foods and energy, or “core” PPI, also increase by 0.2% after seasonal adjustments. The result was in line with the expectations but above March’s flat result and the annual rate slowed from March’s figure of 3.4% to 3.2%.

“Petrol prices in the US lifted more slowly than expected, while food prices actually fell,” said ANZ Head of FX Research Mahjabeen Zaman. However, she also noted “ongoing price pressures in core services.”

US Treasury bond yields fell on the day. By the close of business, the 2-year Treasury yield had slipped 1bp to 3.90%, the 10-year yield had lost 6bps to 3.38% while the 30-year yield finished 7bps lower at 3.73%.

In terms of US Fed policy, expectations of a lower federal funds rate through the remainder of 2023 and into 2024 softened slightly.  At the close of business, contracts implied the effective federal funds rate would average 5.075% in June, essentially unchanged from the current spot rate, and then slip a touch to an average of 5.065% in July. September futures contracts implied a 4.915% average effective federal funds rate while May 2024 contracts implied 3.54%, 154bps less than the current rate.

The BLS stated higher prices for final demand goods rose by 0.2% on average. Prices of final demand services increased by 0.3%.

The producer price index is a measure of prices received by producers for domestically produced goods, services and construction. It is put together in a fashion similar to the consumer price index (CPI) except it measures prices received from the producer’s perspective rather than from the perspective of a retailer or a consumer. It is another one of the various measures of inflation tracked by the US Fed, along with core personal consumption expenditure (PCE) price data. 

Market greets April US CPI figures with lower bond yields, Fed pause expectations

10 May 2023

Summary: US CPI up 0.4% in April, as expected; “core” rate up 0.4%; NAB: seen as supportive for expectations of Fed pause; Treasury yields fall; rate-cut expectations harden; NAB: report detail “less convincing”; Citi: consistently too-strong pace of underlying inflation likely not be encouraging to Fed officials; non-energy services prices again main driver, adds 0.23 ppts.

The annual rate of US inflation as measured by changes in the consumer price index (CPI) halved from nearly 3% in the period from July 2018 to February 2019. It then fluctuated in a range from 1.5% to 2.0% through 2019 before rising above 2.0% in the final months of that year. Substantially lower rates were reported from March 2020 to May 2020 and they remained below 2% until March 2021. Rates have since risen significantly, although they have been declining since mid-2022.

The latest US CPI figures released by the Bureau of Labor Statistics indicated seasonally-adjusted consumer prices increased by 0.4% on average in April. The result was in line with expectations but higher than March’s 0.1% rise. On a 12-month basis, the inflation rate remained unchanged at 5.0%.

“Headline” inflation is known to be volatile and so references are often made to “core” inflation for analytical purposes. The core prices index, the index which excludes the more variable food and energy components, also increased by 0.4% on a seasonally-adjusted basis over the month. The rise was in line with expectations as well as March’s increase. The annual growth rate ticked down from 5.6% to 5.5%, reversing the previous month’s rise.

“The headline numbers were in line with expectations and price action would suggest that this was seen as supporting expectations of a pause by the Fed at the next meeting,” said NAB Head of Markets Strategy Skye Masters.

US Treasury bond yields fell noticeably on the day, especially at the short end of the curve. By the close of business, the 2-year Treasury yield had shed 13bps to 3.91%, the 10-year yield had lost 9bps to 3.44% while the 30-year yield finished 5bps lower at 3.80%.

In terms of US Fed policy, expectations of a lower federal funds rate through the remainder of 2023 and into 2024 hardened considerably.  At the close of business, contracts implied the effective federal funds rate would average 5.065% in June, 1bp less than the current spot rate, and then slip a touch to an average of 5.045% in July. September futures contracts implied a 4.90% average effective federal funds rate while May 2024 contracts implied 3.53%, 155bps less than the current rate.

While Masters thinks markets will see the headline figures as indicative of a declining inflation rate, she also noted “the detail though the inflation story is less convincing…” She pointed to a Federal Reserve Bank of Atlanta economist who, after the report’s release, stated “…it looks like underlying inflation has stepped down from extremely elevated to just really elevated.”

Citi economist Veronica Clark shared her sentiments. “We would caution that the consistently too-strong pace of underlying inflation around 5% will likely not be encouraging to Fed officials. While prices for some travel services were softer in April, other non-shelter services remain very strong.”

The largest influence on headline results is often the change in fuel prices. Prices of “Energy commodities”, the segment which contains vehicle fuels, increased by 2.7% and contributed 0.10 percentage points to the total. However, prices of non-energy services, the segment which includes actual and implied rents, again had the largest effect on the total, adding 0.23 percentage points after increasing by 0.4% on average.  

NAB April business survey: “resilient” but “fragile”?

08 May 2023

Summary: Business conditions slip again in April; survey shows “economy remains resilient”; confidence improves again; Westpac: “business mood remains fragile”; capacity utilisation rate steady, remains elevated.

NAB’s business survey indicated Australian business conditions were robust in the first half of 2018, with a cyclical-peak reached in April of that year. Readings from NAB’s index then began to slip and forecasts of a slowdown in the domestic economy began to emerge in the first half of 2019 as the index trended lower. It hit a nadir in April 2020 as pandemic restrictions were introduced but then conditions improved markedly over the next twelve months. Subsequent readings were generally in a historically-normal range until the second half of 2022.

According to NAB’s latest monthly business survey of over 400 firms conducted in last week of April, business conditions have slipped modestly for a third consecutive month while remaining at a historically high level. NAB’s conditions index registered 14 points, down 2 points from March’s reading.

In contrast, business confidence improved a little more after March’s modest increase.  NAB’s confidence index rose from March’s reading of -1 point to zero, still below the long-term average.  Typically, NAB’s confidence index leads the conditions index by one month, although some divergences have appeared from time to time.

“Overall, the survey shows the economy remains resilient,” said NAB Chief Economist Alan Oster. “We continue to expect consumption growth to slow as the effect of higher rates further impacts households, but how quickly and how sharply this occurs remains uncertain.”

Commonwealth Government bond yields rose materially on the day following strong rises in US Treasury yields on Friday night. By the close of business, the 3-year ACGB yield had gained 11bps to 3.05%, the 10-year yield had added 8bps to 3.40%, while the 20-year yield finished 6bps higher at 3.86%.

In the cash futures market, expectations regarding rate cuts in 2024 softened. At the end of the day, contracts implied the cash rate would remain essentially steady at the current rate of 3.82% to average 3.83% in June and 3.86% in July. February 2024 contracts implied a 3.63% average cash rate while May 2024 contracts implied 3.46%, 36bps less than the current rate.

Westpac senior economist Andrew Hanlan sounded somewhat less positive in his view of the figures. “The cooling of business conditions has extended into the June quarter and the business mood remains fragile and soft as the flow of new orders dries up.”

NAB’s measure of national capacity utilisation remained at the historically-elevated level of 85.1%. All eight sectors of the economy were reported to be operating above their respective long-run averages.

Capacity utilisation is generally accepted as an indicator of future investment expenditure and it also has a strong inverse relationship with Australia’s unemployment rate.

Home approvals slip in March; economy continues to slow

08 May 2023

Summary: Home approval numbers down 0.1% in March, contrasts with expectations; 17.3% lower than March 2022; MSA: economy slowing from strong starting point; ANZ: rising housing prices, population growth encouraging for approvals, construction backlogs, higher rates discouraging; house approvals down 2.9%, apartments up 5.7%; non-residential approvals down 5.1% in dollar terms, residential alterations down 7.4%.

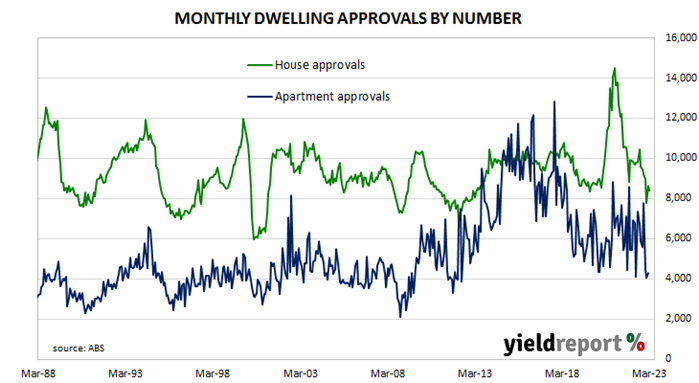
Building approvals for dwellings, that is apartments and houses, headed south after mid-2018. As an indicator of investor confidence, falling approvals had presented a worrying signal, not just for the building sector but for the overall economy. However, approval figures from late-2019 and the early months of 2020 painted a picture of a recovery taking place, even as late as April of that year. Subsequent months’ figures then trended sharply upwards before falling back in 2021 and 2022.

The Australian Bureau of Statistics has released the latest figures from March which show total residential approvals slipped by 0.1% on a seasonally-adjusted basis. The small decline contrasted with the 3.0% increase which had been generally expected as well as February’s 3.9% fall after revisions. Total approvals fell by 17.3% on an annual basis, up from the previous month’s figure of -31.4%. Monthly growth rates are often volatile.

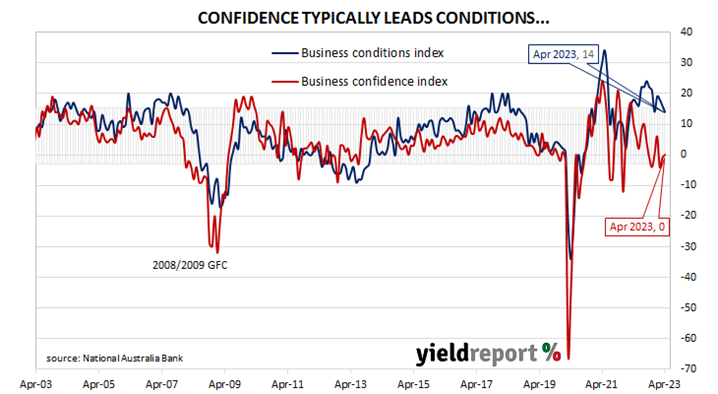
“Overall, today’s data confirm the economy continues to slow from a strong starting point but highlights the construction industry as a key source of downside risk, understandable given its interest rate sensitivity,” said Morgan Stanley Australia economist Chris Read.

Commonwealth Government bond yields rose materially on the day following strong rises in US Treasury yields on Friday night. By the close of business, the 3-year ACGB yield had gained 11bps to 3.05%, the 10-year yield had added 8bps to 3.40%, while the 20-year yield finished 6bps higher at 3.86%.

In the cash futures market, expectations regarding rate cuts in 2024 softened. At the end of the day, contracts implied the cash rate would remain essentially steady at the current rate of 3.82% to average 3.83% in June and 3.86% in July. February 2024 contracts implied a 3.63% average cash rate while May 2024 contracts implied 3.46%, 36bps less than the current rate.

“Rising housing prices in March and April may provide some much-needed appetite for new housing developments, though it’s too early to see this in the approvals data so far, particularly for unit developments which take longer to flow through,” said ANZ economist Madeline Dunk. “Strong population growth is also a support, while elevated construction backlogs and the recent RBA cash rate increase to 3.85% are negatives for approvals.”

Approvals for new houses fell by 2.9% over the month, a turnaround from February’s 11.1% rise. On a 12-month basis, house approvals were 15.0% lower than they were in March 2022, down from February’s comparable figure of -12.9%.              

Apartment approval figures are usually a lot more volatile and March’s total rose by 5.7% after an 8.7% fall in February. The 12-month growth rate rose from February’s revised rate of -52.8% to -21.5%.

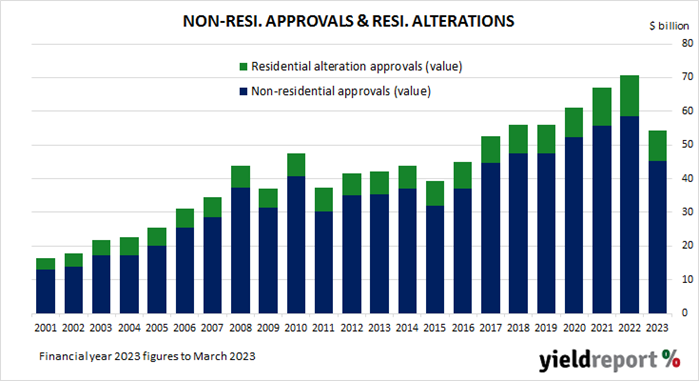
Non-residential approvals fell by 5.1% in dollar terms over the month and were 7.4% lower on an annual basis. Figures in this segment also tend to be rather volatile.

Residential alteration approvals decreased by 7.4% in dollar terms over the month and were 4.0% lower than in March 2022.

Click for more news