News

US April job increase beats estimates; revisions cut Feb, Mar numbers

05 May 2023

Summary: Non-farm payrolls up 253,000 in April, greater than expected; previous two months’ figures revised down by 149,000; jobless rate down from 3.5% to 3.4%, participation rate unchanged at 62.6%; NAB: evidence of easing in US labour market conditions; employed-to-population ratio unchanged; underutilisation rate down from 6.7% to 6.6%; annual hourly pay growth accelerates to 4.4%.

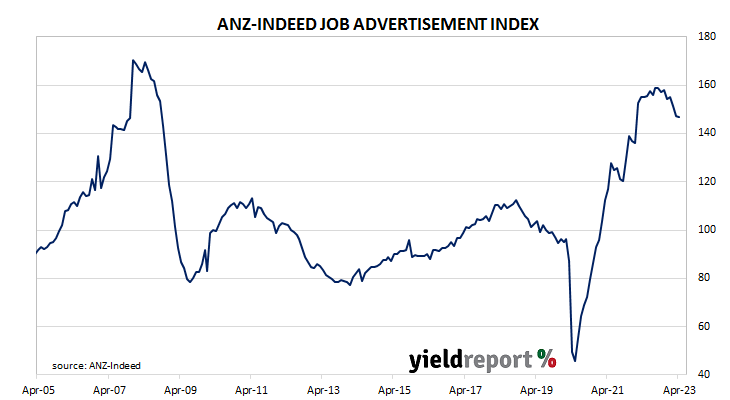
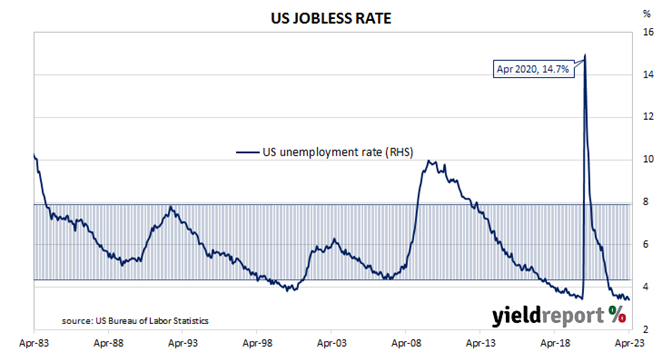
The US economy ceased producing jobs in net terms as infection controls began to be implemented in March 2020. The unemployment rate had been around 3.5% but that changed as job losses began to surge through March and April of 2020. The May 2020 non-farm employment report represented a turning point and subsequent months provided substantial employment gains. Changes in recent months have been generally more modest but still above the average of the last decade.

According to the US Bureau of Labor Statistics, the US economy created an additional 253,000 jobs in the non-farm sector in April. The increase was greater than the 175,000 rise which had been generally expected as well as the 165,000 jobs which had been added in March after revisions. Employment figures for February and March were revised down by a total of 149,000.

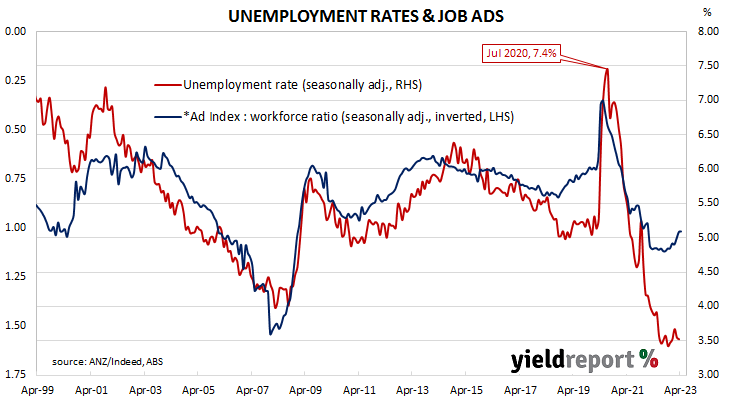
The total number of unemployed decreased by 182,000 to 5.657 million while the total number of people who were either employed or looking for work decreased by 43,000 to 166.688 million. These changes led to the US unemployment rate declining from March’s figure of 3.5% to 3.4% as the participation rate remained unchanged at 62.6%.

“The latest US payrolls report reflects a labour market which remains solid, albeit there is evidence of an easing in conditions,” said NAB Head of Markets Strategy Skye Masters. “Payrolls was up 253,000 vs forecasts of 185,000 but this monthly rise needs to be put in the context that there were downward revisions to the previous two months of 71,000 and 78,000 respectively.

US Treasury yields rose noticeably on the day, especially at the short end of the curve. By the close of business, the 2-year yield had jumped 14bps to 3.90%, the 10-year yield had added 8bps to 3.44% while the 30-year yield finished 3bps higher at 3.75%.

In terms of US Fed policy, expectations of a lower federal funds rate through the remainder of 2023 and into 2024 softened considerably.  At the close of business, contracts implied the effective federal funds rate would average 5.07% in June, 1bp less than the current spot rate, and then move up to an average of 5.06% in July. September futures contracts implied a 4.925% average effective federal funds rate while May 2024 contracts implied 3.58%, 150bps less than the current rate.

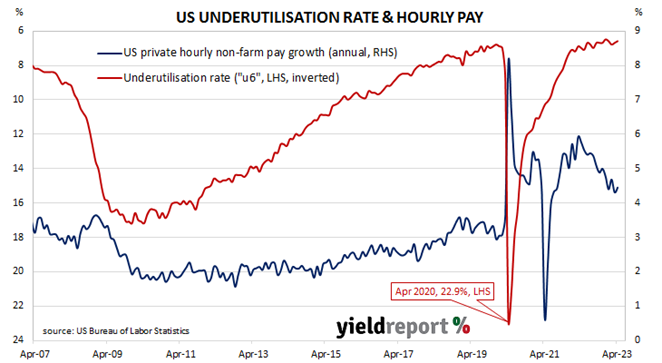
One figure which is indicative of the “spare capacity” of the US employment market is the employment-to-population ratio. This ratio is simply the number of people in work divided by the total US population. It hit a cyclical-low of 58.2 in October 2010 before slowly recovering to just above 61% in late-2019. April’s reading remained at 60.4%, still some way from the April 2000 peak reading of 64.7%.

Apart from the unemployment rate, another measure of tightness in the labour market is the underutilisation rate and the latest reading of it registered 6.6%, down from 6.7% in March. Wage inflation and the underutilisation rate usually have an inverse relationship and hourly pay growth in the year to April accelerated from March’s revised figure 4.3% to 4.4%.

March loan approvals up; housing market stabilising

05 May 2023

Summary: Value of loan commitments up 4.9% in March; 26.3 lower than March 2022; Westpac: evidence of clear stabilisation in housing markets; value of owner-occupier loan approvals up 5.5%; investor approvals up 3.7%; number of home loan approvals up 6.5%.

The number and value of home-loan approvals began to noticeably increase after the RBA reduced its cash rate target in a series of cuts beginning in mid-2019, potentially ending the downtrend which had been in place since mid-2017. Figures from February through to May of 2020 provided an indication the downtrend was still intact but subsequent figures then pushed both back to elevated levels in 2021. However, there has been a considerable pullback since then.

March’s housing finance figures have now been released and total loan approvals excluding refinancing increased by 4.9% In dollar terms over the month, in contrast with the 0.2% decline which had been generally expected as well as February’s -1.0%. On a year-on-year basis, total approvals excluding refinancing fell by 26.3%, up from the previous month’s comparable figure of -30.8%.

“Overall, new finance approvals add to the evidence of a clear stabilisation in housing markets, the latest gain consistent with a clear lift in the total value of sales over the last 3 months, coming off both firmer prices and turnover volumes,” said Westpac senior economist Matthew Hassan.  

Commonwealth Government bond yields slipped at the short end while longer-term yield rose modestly. By the close of business, the 3-year ACGB yield had lost 2bps to 2.94% while 10-year and 20-year yields both finished 1bp higher at 3.32% and 3.80% respectively.

In the cash futures market, expectations regarding rate cuts in 2024 firmed. At the end of the day, contracts implied the cash rate would remain essentially steady at the current rate of 3.82% to average 3.83% in June and 3.85% in July. February 2024 contracts implied a 3.54% average cash rate while May 2024 contracts implied 3.35%.

The total value of owner-occupier loan commitments excluding refinancing increased by 5.5%, a turnaround from February’s -1.2%. On an annual basis, owner-occupier loan commitments were 24.8% lower than in March 2022, above February’s comparable figure of -29.9%.

The total value of investor commitments excluding refinancing arrangements rose by 3.7%. The rise followed a 0.6% decline in February, slowing the contraction rate over the previous 12 months from 32.5% after revisions to 29.2%.

The total number of loan commitments to owner-occupiers excluding refinancing increased by 6.5% to 24,888 on a seasonally adjusted basis. The rise contrasted with February’s 2.0% decline and the annual contraction rate slowed from 28.8% to 22.4%.

“Material slowing in momentum”; retail sales up 0.4% in March

03 May 2023

Summary: Retail sales up 0.4% in March, above expectations; Westpac: momentum slowing materially; ANZ: expects subdued spending growth this year; largest influence on result from food.

Growth figures of domestic retail sales spent most of the 2010s at levels below the post-1992 average. While economic conditions had been generally favourable, wage growth and inflation rates were low. Expenditures on goods then jumped in the early stages of 2020 as government restrictions severely altered households’ spending habits. Households mostly reverted to their usual patterns as restrictions eased in the latter part of 2020 and throughout 2021.

According to the latest ABS figures, total retail sales rose by 0.4% in March on a seasonally adjusted basis. The rise was above the generally-expected figure of 0.4% as well as February’s 0.2% increase. Sales increased by 5.4% on an annual basis, down from February’s comparable figure of 6.4%.

“The key message continues to be of a material slowing in momentum, flat nominal sales for Q1 as a whole, pointing to a material contraction in real, inflation-adjusted terms,” said Westpac senior economist Matthew Hassan.

Commonwealth Government bond yields moved lower on the day following large falls in US Treasury yields overnight. By the close of business, the 3-year ACGB yield had shed 6bps to 3.11%, the 10-year yield had lost 4bps to 3.41% while the 20-year  yield finished 1bp lower at 3.87%.

In the cash futures market, expectations regarding rate cuts in 2024 firmed. At the end of the day, contracts implied the cash rate would remain essentially steady at the current rate of 3.82% to average 3.835% in June and 3.875% in July. February 2024 contracts implied a 3.835% average cash rate while May 2024 contracts implied 3.565%.

“We continue to expect subdued spending growth this year, as high rates and inflation eat into household budgets,” said ANZ economist Madeline Dunk, “though some of the retail sales weakness reflects a shift away from the retail sector into other services.”

Retail sales are typically segmented into six categories (see below), with the “Food” segment accounting for nearly 40% of total sales. The largest influence on the month’s total came from this category where sales increased by 1.0% on average over the month and accounted for 0.38 percentage points of the net result.

Aggressive rate rises curbing worker demand; US quit rate down up March

02 May 2023

Summary: US quit rate falls to 2.5% in March; NAB: diminishing prospects of switching to higher paying jobs; US Treasury yields down considerably ; expectations of lower rates firm; quits, openings down, separations up; ANZ: aggressive rate tightening starting to curb demand for workers.

The number of US employees who quit their jobs as a percentage of total employment increased slowly but steadily after the GFC. It peaked in March 2019 and then tracked sideways until virus containment measures were introduced in March 2020. The quit rate then plummeted as alternative employment opportunities rapidly dried up. Following the easing of US pandemic restrictions, it proceeded to recover back to its pre-pandemic rate in the third quarter of 2020 and trended higher through 2021 before easing through 2022 and early 2023.

Figures released as part of the latest Job Openings and Labor Turnover Survey (JOLTS) report show the quit rate decreased in March. 2.5% of the non-farm workforce left their jobs voluntarily, down from 2.6% in February. Quits in the month fell by 129,000 while an additional 236,000 people were employed in non-farm sectors.

NAB Head of Market Economics (Markets), Tapas Strickland said the numbers suggest “employees are seeing diminishing prospects of switching to higher paying jobs, although the quit rate remains above its 2.3% pre-pandemic average.”

US Treasury yields moved considerably lower on the day. By the close of business, 2-year and 10-year yields had both shed 16bps to 3.99% and 3.43% respectively while the 30-year yields finished 12bps lower at 3.71%.

In terms of US Fed policy, expectations of a higher federal funds rate in the short-term softened while expectations of rate cuts further out hardened. At the close of business, contracts implied the effective federal funds rate would average 5.02% in May, 19bps higher than the current spot rate, and then move up to an average of 5.04% in June. July futures contracts implied a 5.02% average effective federal funds rate while May 2024 contracts implied 3.73%, 110bps less than the current rate.

The fall in total quits was led by 178,000 fewer resignations in the “Accommodation and food services” sector while the “State and local government” sector experienced the largest gain, increasing by 20,000. Overall, the total number of quits for the month fell from February’s revised figure of 3.980 million to 3.851 million.             

Total vacancies at the end of March decreased by 0.384 million, or 3.9%, from February’s revised figure of 9.974 million to 9.590 million. The fall was driven by a 144,000 drop in the “Transportation, warehousing and utilities” sector while the “Accommodation and food services” sector experienced the single largest increase, rising by 75,000. Overall, 9 out of 18 sectors experienced fewer job openings than in the previous month.  

“Job openings are now at their lowest level in two years,” observed ANZ senior economist Adelaide Timbrell. “Demand for labour is continuing to soften, indicating the aggressive tightening in rates is starting to curb demand for workers.”

Total separations increased by 91,000, or 1.6%, from February’s revised figure of 5.841 million to 5.932 million. The rise was led by the “Construction” sector where there were 104,000 more separations than in February. Separations increased in 8 of the 18 sectors.

The “quit” rate time series produced by the JOLTS report is a leading indicator of US hourly pay. As wages account for around 55% of a product’s or service’s price in the US, wage inflation and overall inflation rates tend to be closely related. Former Federal Reserve chief and current Treasury Secretary Janet Yellen was known to pay close attention to it.

ISM PMI up in April; still in contraction territory

01 May 2023

Summary: ISM PMI up in April, above expectations; ISM: reading reflects companies continuing to manage outputs to better match demand; US Treasury yields up considerably; expectations of Fed rate rise firms; NAB: does not allay concerns about the inflation outlook ; ISM: reading corresponds to 0.6% US GDP contraction annualised.

The Institute of Supply Management (ISM) manufacturing Purchasing Managers Index (PMI) reached a cyclical peak in September 2017. It then started a downtrend which ended in March 2020 with a contraction in US manufacturing which lasted until June 2020. Subsequent month’s readings implied growth had resumed, with the index becoming stronger through to March 2021. Readings then declined fairly steadily through to the first quarter of 2023.

According to the ISM’s April survey, its PMI recorded a reading of 47.1%, above the generally expected figure of 46.8% as well as March’s 46.3. The average reading since 1948 is 53.0% and any reading below 50% implies a contraction in the US manufacturing sector relative to the previous month.

“The April composite index reading reflects companies continuing to manage outputs to better match demand for the first half of 2023 and prepare for growth in the late summer/early fall period,” said Timothy Fiore, Chair of the ISM’s Manufacturing Business Survey Committee.

US Treasury yields finished the day considerably higher. By the close of business, the 2-year Treasury bond yield had gained 15bps to 4.15%, the 10-year yield had added 17bps to 3.59% while the 30-year yield finished 15bsp higher at 3.83%.

In terms of US Fed policy, expectations of a higher federal funds rate in the short-term firmed while expectations of rate cuts further out softened. At the close of business, contracts implied the effective federal funds rate would average 5.04% in May, 21bps higher than the current spot rate, and then move up to an average of 5.105% in June. July futures contracts implied a 5.13% average effective federal funds rate while May 2024 contracts implied 3.915%, 91bps less than the current rate.

“Manufacturing is a small share of the US economy but the combination of higher prices paid and the rebound in employment don’t allay concerns about the inflation outlook,” NAB economist Taylor Nugent said.

Purchasing managers’ indices (PMIs) are economic indicators derived from monthly surveys of executives in private-sector companies. They are diffusion indices, which means a reading of 50% represents no change from the previous period, while a reading under 50% implies respondents reported a deterioration on average. A reading “above 48.7%, over a period of time, generally indicates an expansion of the overall economy” according to the ISM.     

The ISM’s manufacturing PMI figures appear to lead US GDP by several months despite a considerable error in any given month. The chart below shows US GDP on a “year on year” basis (and not the BEA annualised basis) against US GDP implied by monthly PMI figures. 

According to the ISM and its analysis of past relationships between the PMI and US GDP, April’s PMI corresponds to an annualised contraction rate of 0.6%, or 0.2% over a quarter. However, regression analysis on a year-on-year basis suggests a 12-month GDP growth rate of 1.6% five months after this latest report.

The ISM index is one of two monthly US PMIs, the other being an index published by S&P Global. S&P Global produces a “flash” estimate in the last week of each month which comes out about a week before the ISM index is published. The S&P Global flash April manufacturing PMI registered 50.4%, 1.2 percentage points higher than March’s final figure.

Inflation Gauge up 0.2% in April; annual rate accelerates to 6.1%

01 May 2023

Summary: Melbourne Institute Inflation Gauge index up 0.2% in April; up 6.1% on annual basis; ACGB yields up modestly; rate cut expectations soften.

The Melbourne Institute’s Inflation Gauge is an attempt to replicate the ABS consumer price index (CPI) on a monthly basis. It has turned out to be a reliable leading indicator of the CPI, although there are periods in which the Inflation Gauge and the CPI have diverged for as long as twelve months. On average, the Inflation Gauge’s annual rate tends to overestimate the ABS rate by around 0.1%, at least until recently.

The Melbourne Institute’s latest reading of its Inflation Gauge index indicates consumer prices increased by 0.2% in April, following increases of 0.3% and 0.4% in March and February respectively. The index rose by 6.1% on an annual basis, down from March’s figure of 5.7%.

The figures came out on the same day as ANZ’s latest Job Ads report and Commonwealth Government bond yields increased modestly on the day, ignoring movements in US Treasury yields on Friday night. By the close of business, the 3-year ACGB yield had inched up 1bp to 2.99%, the 10-year yield had added 2bps to 3.36% while the 20-year yield finished 3bp higher at 3.81%.

In the cash futures market, expectations regarding future rate cuts softened. At the end of the day, contracts implied the cash rate would rise from the current rate of 3.57% to average 3.59% in May and then increase to an average of 3.625% through June. August 2023 contracts implied a 3.695% average cash rate while May 2024 contracts implied 3.385%, about 18bps below the current cash rate.

Central bankers desire a certain level of inflation which is “sufficiently low that it does not materially distort economic decisions in the community” but high enough so it does not constrain “a central bank’s ability to combat recessions.”

Job ads index still “very high” after 0.3% decline in April

01 May 2023

Summary: Job ads down 0.3% in April; 5.4% lower than April 2022; “consistent with solid employment gains”; ACGB yields up modestly; rate-cut expectations soften; ad index-to-workforce ratio steady at 1.02.

From mid-2017 onwards, year-on-year growth rates in the total number of Australian job advertisements consistently exceeded 10%. That was until mid-2018 when the annual growth rate fell back markedly. 2019 was notable for its reduced employment advertising and this trend continued into the first quarter of 2020. Advertising plunged in April and May of 2020 as pandemic restrictions took effect but then recovered quite quickly.

According to the latest ANZ-Indeed figures, total advertisements decreased by 0.3% in April on a seasonally adjusted basis. The decline followed a 2.7% loss in March and a 2.6% loss in February. On a 12-month basis, total job advertisements were 5.4% lower than in April 2022, down from March’s revised figure of -5.2%.

ANZ senior economist Catherine Birch said “…the level remains very high, signalling significant unfilled labour demand, and is consistent with solid employment gains.”

The figures came out on the same day as the Melbourne Institute’s latest reading of its Inflation Gauge and Commonwealth Government bond yields increased modestly on the day, ignoring movements in US Treasury yields on Friday night. By the close of business, the 3-year ACGB yield had inched up 1bp to 2.99%, the 10-year yield had added 2bps to 3.36% while the 20-year yield finished 3bp higher at 3.81%.

In the cash futures market, expectations regarding future rate cuts softened. At the end of the day, contracts implied the cash rate would rise from the current rate of 3.57% to average 3.59% in May and then increase to an average of 3.625% through June. August 2023 contracts implied a 3.695% average cash rate while May 2024 contracts implied 3.385%, about 18bps below the current cash rate.

The inverse relationship between job advertisements and the unemployment rate has been quite strong (see below chart), although ANZ themselves called the relationship between the two series into question in early 2019.  A lower job advertisement index as a proportion of the labour force is suggestive of higher unemployment rates in the near future while a rising ratio suggests lower unemployment rates will follow. April’s ad index-to-workforce ratio remained unchanged at 1.02 after revisions.

In 2008/2009, advertisements plummeted and Australia’s unemployment rate jumped from 4% to nearly 6% over a period of 15 months. When a more dramatic fall in advertisements took place in April 2020, the unemployment rate responded much more quickly.

US core PCE in line in March; Fed cuts expected later in 2023

28 April 2023

Summary: US core PCE price index up 0.3% in March, in line with expectations; annual rate slows from 4.7% to 4.6%; ANZ: “Fed will remain guarded”; Treasury yields fall; Fed rate-rise expectations for next two months unchanged.

One of the US Fed’s favoured measures of inflation is the change in the core personal consumption expenditures (PCE) price index. After hitting the Fed’s target at the time of 2.0% in mid-2018, the annual rate then hovered in a range between 1.8% and 2.0% before it eased back to a range between 1.5% and 1.8% through 2019. It then plummeted below 1.0% in April 2020 before rising back to around 1.5% in the September quarter of that year. It has since increased significantly above the Fed’s target.

The latest figures have now been published by the Bureau of Economic Analysis as part of the March personal income and expenditures report. Core PCE prices rose by 0.3% over the month, in line with expectations as well as February’s increase. On a 12-month basis, the core PCE inflation rate slowed from February’s revised rate of 4.7% to 4.6%.

 “The trend in ex-shelter services PCE data suggest that the Fed will remain guarded,” said ANZ rates strategist Jack Chambers.

US Treasury bond yields fell on the day. By the close of business, the 2-year Treasury bond yield had lost 7bps to 4.00%, the 10-year yield had shed 5bps to 3.42% while the 30-year yield finished 7bps lower at 3.68%.

In terms of US Fed policy, expectations of a higher federal funds rate over the next two months remained unchanged while expectations of rate cuts further out hardened. At the close of business, contracts implied the effective federal funds rate would average 5.03% in May, 20bps higher than the current spot rate, and then move up to an average of 5.08% in June. July futures contracts implied a 5.10% average effective federal funds rate while May 2024 contracts implied 3.82%, 101bps less than the current rate.

The core version of PCE strips out energy and food components, which are volatile from month to month, in an attempt to identify the prevailing trend. It is not the only measure of inflation used by the Fed; the Fed also tracks the Consumer Price Index (CPI) and the Producer Price Index (PPI) from the Department of Labor. However, it is the one measure which is most often referred to in FOMC minutes.

Credit growth stuck in “slow lane”; up 0.3% in March

28 April 2023

Summary: Private sector credit up 0.3% in March, in line with expectations; annual growth rate slows from 7.2% to 6.8%; credit growth stuck in “slow lane”; bond yields down, rate-cut expectations soften; business lending segment account for 45% of net growth.

The pace of lending growth in the non-bank private sector by financial institutions in Australia followed a steady-but-gradual downtrend from late-2015 through to early 2020 before hitting what appears to be a nadir in March 2021. That downtrend ended later in the same year and annual growth rates shot up through 2022, peaking in October.

According to the latest RBA figures, private sector credit increased by 0.3% in March. The result was in line with expectations but less than February’s 0.4% rise. On an annual basis, the growth rate slowed from 7.2% to 6.8%.

“Over the past six months to March 2023, credit growth has been stuck in the slow lane, with the monthly pace holding relatively steady,” said Westpac senior economist Andrew Hanlan.

Commonwealth Government bond yields moved lower on the day, ignoring noticeable upward movements of US Treasury yields overnight. By the close of business, the 3-year ACGB yield had slipped 1bp to 2.98%, the 10-year yield had lost 3bps to 3.34% while the 20-year  yield finished 5bps lower at 3.78%.

In the cash futures market, expectations regarding rate cuts in 2024 softened. At the end of the day, contracts implied the cash rate would move from the current rate of 3.57% to average 3.59% in May and then increase to an average of 3.62% through June. November contracts implied a 3.605% average cash rate while May 2024 contracts implied 3.38%, 19bps below the current cash rate.

Business lending accounted for about 45% of the net growth over the month, while lending in the owner-occupier segment accounted for about 25%. Investor lending accounted for the balance.

The traditional driver of overall loan growth, the owner-occupier segment, grew by 0.3% over the month, down from the 0.4% growth rate of the previous four months. The sector’s 12-month growth rate slowed again, this time from 6.3% to 6.0%.

Total lending in the non-financial business sector increased by 0.4%, down from the 0.6% increase recorded in the previous month. Growth on an annual basis slowed from 11.3% to 10.6%.

Monthly growth in the investor-lending segment slowed to a near-halt in early 2018 and essentially stayed that way until mid-2021. In March, net lending grew by 0.3%, up from 0.2% in February, taking the 12-month growth rate from 4.8% to 4.5%.

Total personal loans fell by 0.3%, down from February’s revised figure of -0.1%, taking the annual growth rate from 0.3% to 0.0%. This category of debt includes fixed-term loans for large personal expenditures, credit cards and other revolving credit facilities.

Euro composite sentiment index creeps higher in April

27 April 2023

Summary: Euro-zone composite sentiment index up slightly in April, below expectations; readings up in three of five  sectors; up in three of four largest euro-zone economies; German, French 10-year yields noticeably higher; index implies annual GDP growth rate of 1.2%.

The European Commission’s Economic Sentiment Indicator (ESI) is a composite index comprising five differently weighted sectoral confidence indicators.  It is heavily weighted towards confidence surveys from the business sector, with the consumer confidence sub-index only accounting for 20% of the ESI. However, it has a good relationship with euro-zone GDP, although not necessarily as a leading indicator.

The ESI posted a reading of 99.3 in April, below the consensus expectation of 99.9 but slightly higher than March’s revised reading of 99.2. The average reading since 1985 is just under 100.

German and French 10-year bond yields finished the day noticeably higher. By the close of business, the German 10-year bund yield had gained 7bps to 2.45% while the French 10-year OAT yield also finished 7bps higher at 3.04%.

Confidence improved in three of the five sectors of the economy. On a geographical basis, the ESI increased in three of the euro-zone’s four largest economies, Germany, Italy and Spain, but deteriorated noticeably in France.

End-of-quarter ESI readings and annual euro-zone GDP growth rates are highly correlated. This latest reading corresponds to a year-to-April GDP growth rate of 1.2%, unchanged from March’s implied growth rate.

Click for more news