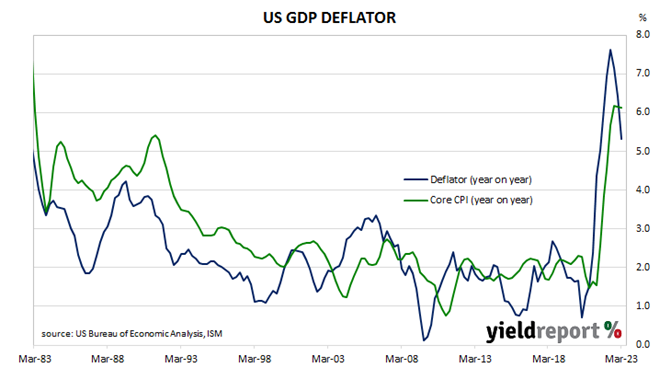
Summary: US GDP up 0.3% (1.1% annualised) in March quarter, below expectations; “ugly” headline figure driven by slower inventory growth; core PCE deflator up 4.9% (annual rate), above consensus; GDP price deflator rate slows from 6.4% to 5.3%.
US GDP growth slowed in the second quarter of 2019 before stabilising at about 0.5% per quarter. At the same time, US bond yields suggested future growth rates would be below trend. The US Fed agreed and it reduced its federal funds range three times in the second half of 2019. Pandemic restrictions in the June quarter of 2020 sent parts of the US economy into hibernation; the lifting of those same restrictions sparked a rapid recovery which lasted until 2022.
The US Bureau of Economic Analysis has now released the March quarter’s “advance” GDP estimates and they indicate the US economy expanded by 0.3% or at an annualised rate of 1.1%. The increase was less than the 0.5% increase (2.0% annualised) which had been generally expected as well as the December quarter’s 0.6% after revisions.
“The detail wasn’t as ugly as the headline, with slower inventory building subtracting 2.3 percentage points from the result,” said NAB economist Taylor Nugent. “Elsewhere, a weather boost earlier in the quarter helped consumption up 3.7% and domestic final demand up 3.2%, though business capex growth was soft.”
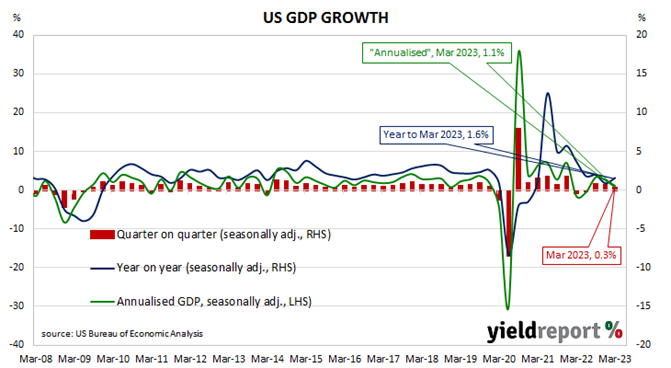
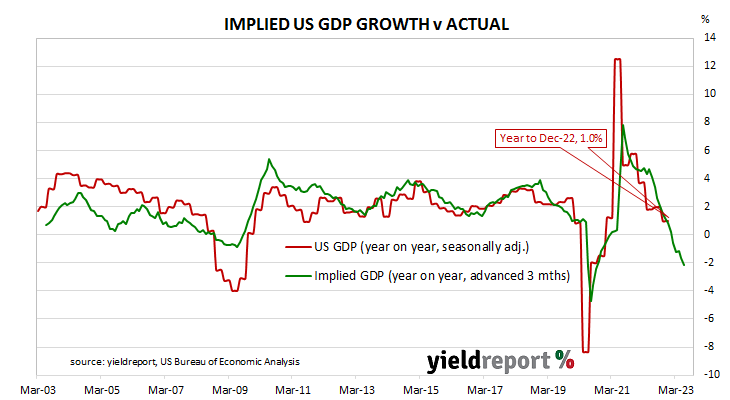
US GDP numbers are published in a manner which is different to most other countries; quarterly figures are compounded to give an annualised figure. In countries such as Australia and the UK, an annual figure is calculated by taking the latest number and comparing it with the figure from the same period in the previous year. The diagram above shows US GDP once it has been expressed in the normal manner, as well as the annualised figure.
US Treasury bond yields rose on the day, especially at the front of the yield curve. By the close of business, the 2-year Treasury bond yield had gained 12bps to 4.07%, the 10-year yield had added 7bps to 3.52% while the 30-year yield finished 4bps higher at 3.75%.
In terms of US Fed policy, expectations of a higher federal funds rate over the next few months firmed while expectations of rate cuts further out softened. At the close of business, contracts implied the effective federal funds rate would average 5.03% in May, 20bps higher than the current spot rate, and then move up to an average of 5.085% in June. July futures contracts implied a 5.11% average effective federal funds rate while May 2024 contracts implied 3.84%, 99bps less than the current rate.
Nugent noted attention had focussed not on the softer-than-expected result but the personal consumption expenditures deflator. “The core PCE deflator rose at a 4.9% annual rate in the quarter, above consensus for a 4.7% gain. Mechanically assuming no revisions to January and February…that would imply a 0.5% outcome for tonight’s March core PCE deflator, where the consensus is for a 0.3% gain.”
One part of the report which is often overlooked are the figures regarding the GDP price deflator, which is another measure of inflation. The GDP price deflator is restricted to new, domestically-produced goods and services and it is not based on a fixed basket as is the case for the consumer price index (CPI). The annual rate slowed from the December quarter’s revised figure of 6.4% to 5.3%.