News

Business conditions resilient in March, confidence improves

11 April 2023

Summary: Business conditions slip again in March; business conditions “resilient”; confidence improves; confidence  “particularly poor” in retail, wholesale; capacity utilisation rate slips, remains elevated.

NAB’s business survey indicated Australian business conditions were robust in the first half of 2018, with a cyclical-peak reached in April of that year. Readings from NAB’s index then began to slip and forecasts of a slowdown in the domestic economy began to emerge in the first half of 2019 as the index trended lower. It hit a nadir in April 2020 as pandemic restrictions were introduced but then conditions improved markedly over the next twelve months. Subsequent readings were generally in a historically-normal range until the second half of 2022.

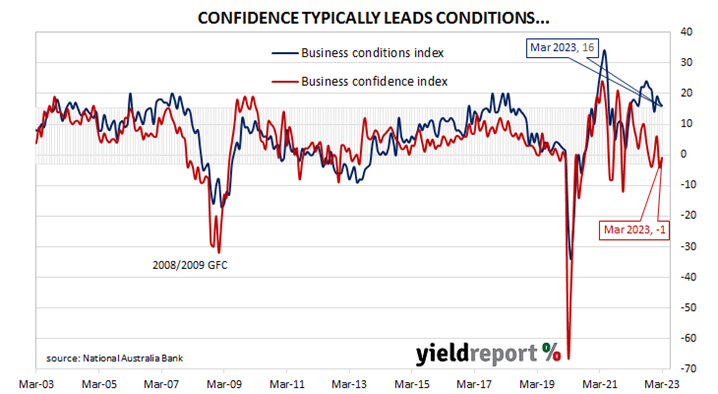
According to NAB’s latest monthly business survey of over 400 firms conducted in last week-and-a-half of March, business conditions have slipped modestly for a second consecutive month while remaining at a historically high level. NAB’s conditions index registered 16 points, down 1 point from February’s reading.

“Business conditions have been resilient, slowly edging lower over the past few months but remaining well above their long-run average,” said NAB Chief Economist Alan Oster. He noted “particularly elevated” trading conditions which were “generally strong across states and sectors.”

In contrast, business confidence improved a little.  NAB’s confidence index increased from February’s reading of -4 points to -1 point, noticeably below the long-term average.  Typically, NAB’s confidence index leads the conditions index by one month, although some divergences have appeared from time to time.

“Confidence was particularly poor in retail and wholesale, likely reflecting that firms are concerned about how much longer consumer spending will hold up.”

Commonwealth Government bond yields rose on the day, especially at the short end. By the close of business, the 3-year ACGB yield had gained 6bps to 2.84%, the 10-year yield had added 4bps to 3.22%, while the 20-year yield finished 1bp higher at 3.65%.

In the cash futures market, expectations regarding future rate cuts softened. At the end of the day, contracts implied the cash rate would rise from the current rate of 3.57% to average 3.62% in May and then decline to an average of 3.585% in August. November contracts implied a 3.49% average cash rate while May 2024 contracts implied 3.23%, 34bps below the current cash rate.

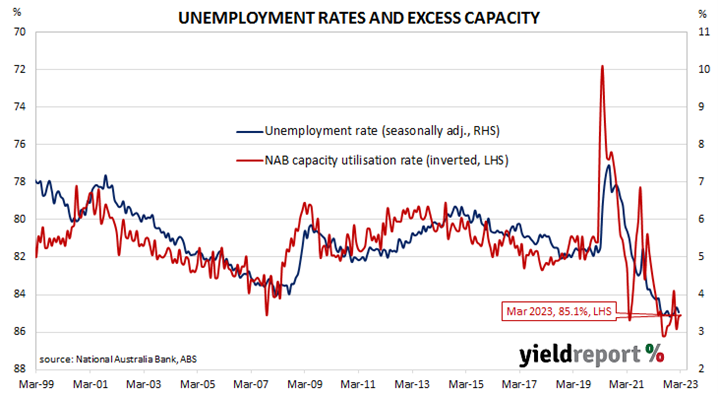
NAB’s measure of national capacity utilisation remained at a historically-elevated level even as it declined from February’s figure of 85.2% to 85.1%. All eight sectors of the economy were reported to be operating above their respective long-run averages.

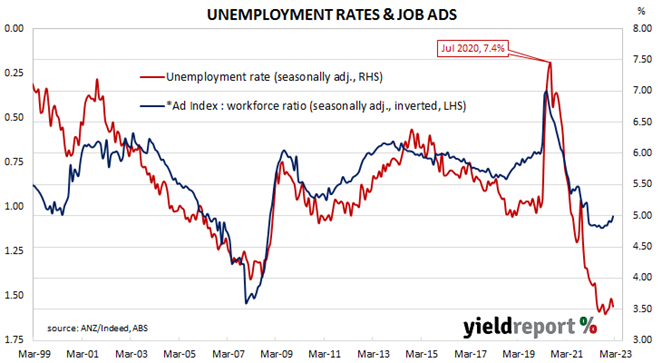
Capacity utilisation is generally accepted as an indicator of future investment expenditure and it also has a strong inverse relationship with the unemployment rate.

“Solid” US labour market challenges rate cut expectations

07 April 2023

Summary: Non-farm payrolls up 236,000 in March, in line with expectations; previous two months’ figures revised down by 17,000; jobless rate down from 3.6% to 3.5%, participation rate up; labour market “solid”, challenges market pricing of rate cuts; employed-to-population ratio rises; underutilisation rate down; annual hourly pay growth slows.

The US economy ceased producing jobs in net terms as infection controls began to be implemented in March 2020. The unemployment rate had been around 3.5% but that changed as job losses began to surge through March and April of 2020. The May 2020 non-farm employment report represented a turning point and subsequent months provided substantial employment gains. Changes in recent months have been generally more modest but still above the average of the last decade.

According to the US Bureau of Labor Statistics, the US economy created an additional 236,000 jobs in the non-farm sector in March. The increase was essentially in line with the 240,000 which had been generally expected but less than the 326,000 jobs which had been added in February after revisions. Employment figures for January and February were revised down by a total of 17,000.

The total number of unemployed decreased by 97,000 to 5.839 million while the total number of people who were either employed or looking for work increased by 480,000 to 166.731 million. These changes led to the US unemployment rate declining from February’s figure of 3.6% to 3.5% as the participation rate ticked up from 62.5% to 62.6%.

“The payrolls report was a reminder to investors that while employment growth may be slowing the labour market remains solid with the report challenging market pricing of imminent rate cuts,” said NAB Head of Markets Strategy Skye Masters.

US Treasury yields rose noticeably on the day. By the close of business, the 2-year yield had jumped 14bps to 3.96%, the 10-year yield had added 9bps to 3.40% while the 30-year yield finished 7bps higher at 3.62%.

In terms of US Fed policy, expectations of a higher federal funds rate over the next six months hardened while expectations of rate cuts further out softened. At the close of business, contracts implied the effective federal funds rate would average 4.825% in April, in line with the current spot rate, and then climb to an average of 4.985% in May. June futures contracts implied a 5.00% average effective federal funds rate while April 2024 contracts implied 3.94%.

One figure which is indicative of the “spare capacity” of the US employment market is the employment-to-population ratio. This ratio is simply the number of people in work divided by the total US population. It hit a cyclical-low of 58.2 in October 2010 before slowly recovering to just above 61% in late-2019. March’s reading increased from 60.2% to 60.4%, still some way from the April 2000 peak reading of 64.7%.

Apart from the unemployment rate, another measure of tightness in the labour market is the underutilisation rate and the latest reading of it registered 6.7%, down from 6.8% in February. Wage inflation and the underutilisation rate usually have an inverse relationship, although hourly pay growth in the year to March slowed from 4.6% to 4.2%.

US quit rate up, openings down in February

04 April 2023

Summary: US quit rate rises to 2.6% in February; US yields down; expectations of lower rates firm; quits up, openings, separations down; NAB: confirms softening in US labour demand.

The number of US employees who quit their jobs as a percentage of total employment increased slowly but steadily after the GFC. It peaked in March 2019 and then tracked sideways until virus containment measures were introduced in March 2020. The quit rate then plummeted as alternative employment opportunities rapidly dried up. Following the easing of US pandemic restrictions, it proceeded to recover back to its pre-pandemic rate in the third quarter of 2020 and trended higher through 2021 before easing through 2022.

Figures released as part of the latest Job Openings and Labor Turnover Survey (JOLTS) report show the quit rate increased in February. 2.6% of the non-farm workforce left their jobs voluntarily, up from 2.5% in January. Quits in the month rose by 146,000 while an additional 311,000 people were employed in non-farm sectors.

US Treasury yields moved lower, especially at the short end. By the close of business, the 2-year yield had shed 13bps to 3.84%, the 10-year yield had lost 6bps to 3.35% while the 30-year yields finished 4bps lower at 3.60%.

In terms of US Fed policy, expectations of cuts to the federal funds rate hardened. At the close of business, contracts implied the effective federal funds rate would average 4.93% in May, 10bps higher than the current spot rate, and then decline to an average of 4.905% in June. July futures contracts implied a 4.855% average effective federal funds rate while April 2024 contracts implied 3.715%.

The rise in total quits was led by 115,000 more resignations in the “Professional and business services” sector while the “Finance and insurance” sector experienced the largest loss, decreasing by 39,000. Overall, the total number of quits for the month rose from January’s revised figure of 3.878 million to 4.024 million.  

Total vacancies at the end of February decreased by 0.632 million, or 6.0%, from January’s revised figure of 10.563 million to 9.931 million. The fall was driven by a 278,000 drop in the “Professional and business services” sector while the “Construction” sector experienced the single largest increase, rising by 129,000. Overall, 9 out of 18 sectors experienced fewer job openings than in the previous month.  

“The decline in job openings confirms the softening in US labour demand evident in the Indeed job postings data,” said NAB Senior FX Strategist (Markets) Rodrigo Catril.. “The February JOLT figures also confirm US labour demand is trending down with the NFIB survey suggesting further declines should be expected over coming months.”

Total separations decreased by 80,000, or 1.4%, from January’s revised figure of 5.900 million to 5.820 million. The fall was led by the “Professional and business services” sector where there were 66,000 fewer separations than in January. Separations decreased in 9 of the 18 sectors.

The “quit” rate time series produced by the JOLTS report is a leading indicator of US hourly pay. As wages account for around 55% of a product’s or service’s price in the US, wage inflation and overall inflation rates tend to be closely related. Former Federal Reserve chief and current Treasury Secretary Janet Yellen was known to pay close attention to it.

US manufacturing sector contracts again; ISM PMI down in March

03 April 2023

Summary: ISM PMI down in March, below expectations; ISM: US manufacturing sector contracts again; US Treasury yields down, expectations of Fed rate rises over next six month firm, softer for 2024; manufacturing among most rate-sensitive sectors; encouraging news on goods inflation; ISM: reading corresponds to 0.9% US GDP contraction annualised.

The Institute of Supply Management (ISM) manufacturing Purchasing Managers Index (PMI) reached a cyclical peak in September 2017. It then started a downtrend which ended in March 2020 with a contraction in US manufacturing which lasted until June 2020. Subsequent month’s readings implied growth had resumed, with the index becoming stronger through to March 2021. Since then, readings have declined steadily.

According to the ISM’s March survey, its PMI recorded a reading of 46.3%, below the generally expected figure of 47.5% as well as February’s 47.7. The average reading since 1948 is 53.0% and any reading below 50% implies a contraction in the US manufacturing sector relative to the previous month.

“The US manufacturing sector contracted again, with the Manufacturing PMI declining compared to the previous month,” said Timothy Fiore, Chair of the ISM’s Manufacturing Business Survey Committee.

US Treasury yields finished the day lower. By the close of business, the 2-year Treasury bond yield had lost 5bps to 3.97%, the 10-year yield had shed 6bps to 3.41% while the 30-year yield finished 1bp lower at 3.64%.

In terms of US Fed policy, expectations of a 25bps rise to the federal funds rate over the next six months firmed slightly while expectations further out softened. At the close of business, contracts implied the effective federal funds rate would average 4.815% in April, 1bp lower than the current spot rate, and then climb to an average of 4.96% in May. June futures contracts implied a 4.965% average effective federal funds rate while April 2024 contracts implied 3.92%.

“A weakening trend has been in place since May last year, but recent banking turmoil may have dented confidence further,” said ANZ senior economist Catherine Birch. “Manufacturing is one of the most rate-sensitive sectors of the economy as goods like autos are primarily bought on credit.”

She also noted lower supplier delivery times and a fall in the prices sub-index, signs she described as “encouraging news on goods inflation.”

Purchasing managers’ indices (PMIs) are economic indicators derived from monthly surveys of executives in private-sector companies. They are diffusion indices, which means a reading of 50% represents no change from the previous period, while a reading under 50% implies respondents reported a deterioration on average. A reading “above 48.7%, over a period of time, generally indicates an expansion of the overall economy” according to the ISM.     

The ISM’s manufacturing PMI figures appear to lead US GDP by several months despite a considerable error in any given month. The chart below shows US GDP on a “year on year” basis (and not the BEA annualised basis) against US GDP implied by monthly PMI figures. 

According to the ISM and its analysis of past relationships between the PMI and US GDP, March’s PMI corresponds to an annualised contraction rate of 0.9%, or 0.2% over a quarter. Regression analysis on a year-on-year basis suggests a 12-month GDP growth rate of 1.5% five months after this latest report.

The ISM index is one of two monthly US PMIs, the other being an index published by S&P Global. S&P Global produces a “flash” estimate in the last week of each month which comes out about a week before the ISM index is published. The S&P Global flash March manufacturing PMI registered 49.3%, 2.0 percentage points higher than February’s final figure.

Inflation Gauge rises 0.3% in March; annual rate slows again

03 April 2023

Summary: Melbourne Institute Inflation Gauge index up 0.3% in March; up 5.7% on annual basis; ACGB yields up; rate cut expectations soften; implies 0.1% increase in March quarter CPI.

The Melbourne Institute’s Inflation Gauge is an attempt to replicate the ABS consumer price index (CPI) on a monthly basis. It has turned out to be a reliable leading indicator of the CPI, although there are periods in which the Inflation Gauge and the CPI have diverged for as long as twelve months. On average, the Inflation Gauge’s annual rate tends to overestimate the ABS rate by around 0.1%, at least until recently.

The Melbourne Institute’s latest reading of its Inflation Gauge index indicates consumer prices increased by 0.3% in March, following increases of 0.4% and 0.9% in February and January. The index rose by 5.7% on an annual basis, down from February’s figure of 6.3%.

Commonwealth Government bond yields increased on the day, ignoring movements in US Treasury yields on Friday night. By the close of business, the 3-year ACGB yield had gained 4bps to 2.95%, the 10-year yield had added 2bps to 3.32% while the 20-year yield finished 1bp higher at 3.74%.

In the cash futures market, expectations regarding future rate cuts softened. At the end of the day, contracts implied the cash rate would rise from the current rate of 3.57% to average 3.60% in April and then increase to an average of 3.655% through May. August 2023 contracts implied a 3.585% average cash rate while November 2023 contracts implied 3.495%, 7bps below the current cash rate.

Given the Inflation Gauge’s tendency to overestimate, the latest figures imply an official CPI reading of just 0.1% (seasonally adjusted) for the March quarter or 5.6% in annual terms. However, it is worth noting the annual CPI rate to the end of December was 7.8% while the Inflation Gauge had implied a 5.8% annual rate at the time.

March job ad index falls; unfilled labour demand still “significant”

03 April 2023

Summary: Job ads down 2.4% in March; 4.7% lower than March 2022; unfilled labour demand “significant”; ANZ: labour market will remain very tight through 2023; ad index-to-workforce ratio falls from 1.05 to 1.03.

From mid-2017 onwards, year-on-year growth rates in the total number of Australian job advertisements consistently exceeded 10%. That was until mid-2018 when the annual growth rate fell back markedly. 2019 was notable for its reduced employment advertising and this trend continued into the first quarter of 2020. Advertising plunged in April and May of 2020 as pandemic restrictions took effect but then recovered quite quickly.

According to the latest ANZ-Indeed figures, total advertisements decreased by 2.4% in March on a seasonally adjusted basis. The fall followed a 2.6% loss in February and a 0.6% rise in January. On a 12-month basis, total job advertisements were 4.7% lower than in March 2022, down from February’s figure of -1.0%.

“[The] ANZ-Indeed Australian Job Ads [Index] has fallen 7.2% from its September 2022 peak but is still more than 50% above its pre-pandemic level, indicating the volume of unfilled labour demand remains significant,” noted ANZ senior economist Catherine Birch.

The figures were released on the same day as several other reports and Commonwealth Government bond yields generally rose modestly. By the close of business, the 3-year ACGB yield had gained 4bps to 2.95%, the 10-year yield had added 2bps to 3.32% while the 20-year yield finished 1bp higher at 3.74%.

In the cash futures market, expectations regarding future rate cuts softened. At the end of the day, contracts implied the cash rate would rise from the current rate of 3.57% to average 3.60% in April and then increase to an average of 3.655% through May. August 2023 contracts implied a 3.585% average cash rate while November 2023 contracts implied 3.495%, 7bps below the current cash rate.

Birch also said the view the labour market is still tight is consistent with recent data from NAB, ACCI and the ABS. “As such, we expect the labour market will remain very tight through 2023, with unemployment staying below 4%.”

The inverse relationship between job advertisements and the unemployment rate has been quite strong (see below chart), although ANZ themselves called the relationship between the two series into question in early 2019.  A lower job advertisement index as a proportion of the labour force is suggestive of higher unemployment rates in the near future while a rising ratio suggests lower unemployment rates will follow. March’s ad index-to-workforce ratio fell from 1.05 to 1.03.

In 2008/2009, advertisements plummeted and Australia’s unemployment rate jumped from 4% to nearly 6% over a period of 15 months. When a more dramatic fall in advertisements took place in April 2020, the unemployment rate responded much more quickly.

Dwelling approvals up in Feb; still shows “clear slowdown”

03 April 2023

Summary: Home approval numbers up 4.0% in February, below expectations; 31.1% lower than February 2022; Westpac: figures still show clear slowdown; house approvals up 11.1%, apartments down 8.4%; non-residential approvals up 39.8% in dollar terms, residential alterations up 3.7%.

Building approvals for dwellings, that is apartments and houses, headed south after mid-2018. As an indicator of investor confidence, falling approvals had presented a worrying signal, not just for the building sector but for the overall economy. However, approval figures from late-2019 and the early months of 2020 painted a picture of a recovery taking place, even as late as April of that year. Subsequent months’ figures then trended sharply upwards before falling back in 2021 and 2022.

The Australian Bureau of Statistics has released the latest figures from February which show total residential approvals increased by 4.0% on a seasonally-adjusted basis. The rise was less than the 10.0% increase which had been generally expected and it contrasted with January’s 27.1% drop. However, total approvals still fell by 31.1% on an annual basis, down from the previous month’s figure of -8.1%. Monthly growth rates are often volatile.

“Looking through the choppy monthly profile, year-on-year figures still show a clear slowdown with approvals down over 30%,” said Westpac senior economist Matthew Hassan.

The figures were released on the same day as several other reports and Commonwealth Government bond yields generally rose modestly. By the close of business, the 3-year ACGB yield had gained 4bps to 2.95%, the 10-year yield had added 2bps to 3.32% while the 20-year yield finished 1bp higher at 3.74%.

In the cash futures market, expectations regarding future rate cuts softened. At the end of the day, contracts implied the cash rate would rise from the current rate of 3.57% to average 3.60% in April and then increase to an average of 3.655% through May. August 2023 contracts implied a 3.585% average cash rate while November 2023 contracts implied 3.495%, 7bps below the current cash rate.

Approvals for new houses rose by 11.1% over the month, a turnaround from January’s 13.3% fall. On a 12-month basis, house approvals were 13.6% lower than they were in February 2022, down from January’s comparable figure of -12.0%.

Apartment approval figures are usually a lot more volatile and February’s total fell by 8.4% after a 43.1% drop in January. The 12-month growth rate fell from January’s revised rate of -0.6% to -59.9%.

Non-residential approvals jumped by 39.8% in dollar terms over the month but were still 11.4% lower on an annual basis. Figures in this segment also tend to be rather volatile.

Residential alteration approvals increased by 3.7% in dollar terms over the month and were 5.8% higher than in February 2022.

Credit growth slows in February, appetite “curbed”

31 March 2023

Summary: Private sector credit up 0.3% in February, less than expected; annual growth rate down from 8.0% to 7.6%; “a challenging year”, appetite for credit “curbed”; bond yields down, rate-cut expectations firm; business lending, owner-occupier segments each account for 40% of net growth.

The pace of lending growth in the non-bank private sector by financial institutions in Australia followed a steady-but-gradual downtrend from late-2015 through to early 2020 before hitting what appears to be a nadir in March 2021. That downtrend ended later in the same year and annual growth rates shot up through 2022.

According to the latest RBA figures, private sector credit increased by 0.3% in February. The result was less than the 0.4% increase which had been generally expected as well as January’s 0.4% rise. On an annual basis, the growth rate slowed from 8.0% to 7.6%.

“As highlighted previously, it has been a sluggish start to 2023 for private sector credit, in what will be a challenging year,” said Westpac senior economist Andrew Hanlan. “The appetite for credit has been curbed by the RBA’s rapid-fire interest rate tightening cycle and the slowing economy.”

Commonwealth Government bond yields moved lower on the day. By the close of business, the 3-year ACGB yield had shed 4bps to 2.91%, the 10-year yield had lost 6bps to 3.30% while the 20-year  yield finished 5bps lower at 3.73%.

In the cash futures market, expectations regarding future rate cuts firmed slightly. At the end of the day, contracts implied the cash rate would rise from the current rate of 3.57% to average 3.60% in April and then increase to an average of 3.66% through May. August 2023 contracts implied a 3.53% average cash rate while November 2023 contracts implied 3.44%, 13bps below the current cash rate.

Business lending accounted for about 40% of the net growth over the month, as did lending in the owner-occupier segment. Investor lending accounted for most of the balance.

The traditional driver of overall loan growth, the owner-occupier segment, grew by 0.4% over the month, the same growth rate as in the previous four months. The sector’s 12-month growth rate slowed again, this time from 6.6% to 6.3%.

Total lending in the business sector increased by 0.4%, down from the 0.5% increase recorded in the previous month. Growth on an annual basis slowed from 12.6% to 11.9%.

Monthly growth in the investor-lending segment slowed to a near-halt in early 2018 and essentially stayed that way until mid-2021. In January, net lending grew by 0.2%, the same rate as in January and December and the 12-month growth rate slowed from 5.1% to 4.8%.

Total personal loans remained unchanged after rounding, down from January’s 0.1%, taking the annual growth rate from 0.4% to 0.3%. This category of debt includes fixed-term loans for large personal expenditures, credit cards and other revolving credit facilities.

Euro-zone ESI slips a little further in March

30 March 2023

Summary: Euro-zone composite sentiment index down in March, below expectations; readings down in all five sectors; up in two of four largest euro-zone economies; German, French 10-year yields moderately higher; index implies annual GDP growth rate of 1.2%.

The European Commission’s Economic Sentiment Indicator (ESI) is a composite index comprising five differently weighted sectoral confidence indicators.  It is heavily weighted towards confidence surveys from the business sector, with the consumer confidence sub-index only accounting for 20% of the ESI. However, it has a good relationship with euro-zone GDP, although not necessarily as a leading indicator.

The ESI posted a reading of 99.3 in March, below the consensus expectation of 99.8 as well as February’s revised reading of 99.6. The average reading since 1985 is just under 100.

German and French 10-year bond yields finished the day moderately higher. By the close of business, the German 10-year bund yield had gained 6bps to 2.37% while the French 10-year OAT yield finished 4bps higher at 2.87%.

Confidence declined in all five sectors of the economy. On a geographical basis, the ESI increased in two of the euro-zone’s four largest economies, Italy and France, and remained broadly unchanged in the other two, Spain and Germany.

End-of-quarter ESI readings and annual euro-zone GDP growth rates are highly correlated. This latest reading corresponds to a year-to-March GDP growth rate of 1.2%, down from February’s implied growth rate of 1.3%.

Conf. Board confidence index holds up in March despite bank failures

28 March 2023

Summary: Conference Board Consumer Confidence Index rises in March, reading more than expected; improved outlook for under 55s, households earning $50,000+; consumers taking little notice of recent bank failures; views of present conditions deteriorates, short-term outlook improves.

US consumer confidence clawed its way back to neutral over the five years after the GFC in 2008/2009 and then went from strength to strength until late 2018. Measures of consumer confidence then oscillated within a relatively narrow band at historically high levels until they plunged in early 2020. Subsequent readings then fluctuated around the long-term average until March 2021 when they returned to elevated levels. However, a noticeable gap has since emerged between the two most-widely followed surveys.

The latest Conference Board survey held during the first three weeks of March indicated US consumer confidence has improved. March’s Consumer Confidence Index registered 104.2 on a preliminary basis, higher than the expected figure of 101.5 and February’s final figure of 103.4.

“The gain reflects an improved outlook for consumers under 55 years of age and for households earning $50,000 and over,” said Ataman Ozyildirim, a senior director of economics at The Conference Board.

US Treasury yields generally moved higher. By the close of business, the 2-year Treasury bond yield had gained 5bps to 4.07%, the 10-year yield had added 2bps to 3.56% while the 30-year yield finished steady at 3.77%.

In terms of US Fed policy, expectations of a 25bps rise to the federal funds rate over the next 12 months firmed. At the close of business, contracts implied the effective federal funds rate would average 4.81% in April, 2bps lower than the current spot rate, and then climb to an average of 4.92% in May. June futures contracts implied a 4.905% average effective federal funds rate while April 2024 contracts implied 4.945%.

“It’s early days for the full impact of credit tightening to be evident for households, but Consumer Confidence suggested the consumer had taken little notice of recent bank failures,” said NAB economist Taylor Nugent.

Consumers’ views of present conditions deteriorated while their views of the near-future improved. The Present Situation Index declined from February’s revised figure of 153.0 to 151.1 while the Expectations Index rose from 70.4 to 73.0.

The Consumer Confidence Survey is one of two widely followed monthly US consumer sentiment surveys which produce sentiment indices. The Conference Board’s index is based on perceptions of current business and employment conditions, as well as respondents’ expectations of conditions six months in the future. The other survey, conducted by the University of Michigan, is similar and it is used to produce an Index of Consumer Sentiment. That survey differs in that it does not ask respondents explicitly about their views of the labour market and it also includes some longer-term questions.

Click for more news