News

February retail figures “conceals material underlying weakening”

28 March 2023

Summary: Retail sales up 0.2% in February, in line with expectations; would imply contraction in retail volumes; conceals material underlying weakening in sales; largest influence on result from food.

Growth figures of domestic retail sales spent most of the 2010s at levels below the post-1992 average. While economic conditions had been generally favourable, wage growth and inflation rates were low. Expenditures on goods then jumped in the early stages of 2020 as government restrictions severely altered households’ spending habits. Households mostly reverted to their usual patterns as restrictions eased in the latter part of 2020 and throughout 2021.

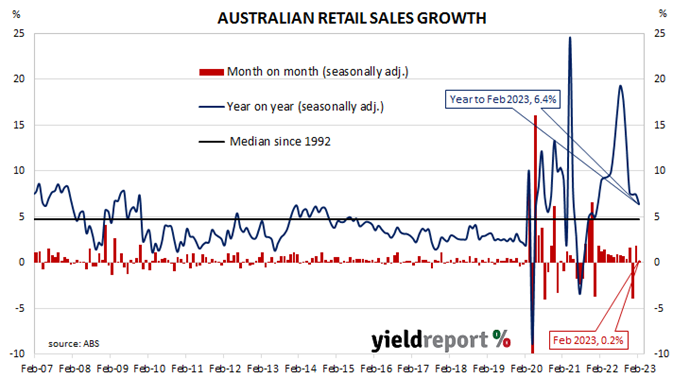
According to the latest ABS figures, total retail sales rose by 0.2% in February on a seasonally adjusted basis. The rise was in line with expectations but considerably less than January’s 1.8% growth after revisions. Sales increased by 6.4% on an annual basis, down from January’s comparable figure of 7.5%.

“Retail sales rose by a modest 0.2% in February, keeping nominal retail sales below October 2022 levels,” said ANZ economist Madeline Dunk. “If the retail deflator is similar to the last four quarters, [with an] average weighted price increase of 1.8% quarter-on-quarter, this would imply a contraction in retail volumes in February.”

Commonwealth Government bond yields moved considerably higher on the day following large rises in US Treasury yields overnight. By the close of business, 3-year and 10-year ACGB yields had both gained 11bps to 2.87% and 3.30% respectively while the 20-year  yield finished 8bps higher at 3.75%.

In the cash futures market, expectations regarding future rate cuts softened a little. At the end of the day, contracts implied the cash rate would remain essentially steady at the current rate of 3.57% to average 3.59% in April and 3.63% in May. August contracts implied a 3.43% average cash while November contracts implied 3.325%.

“The key point to note here is the volatile monthly profile leading into February sales posting a steep 3.9% drop in December and only a partial 1.8% rebound in January,” said Westpac senior economist Matthew Hassan. “This means that February was always likely to post a month-to-month gain but that this conceals a material underlying weakening in sales on a 3-month basis.”

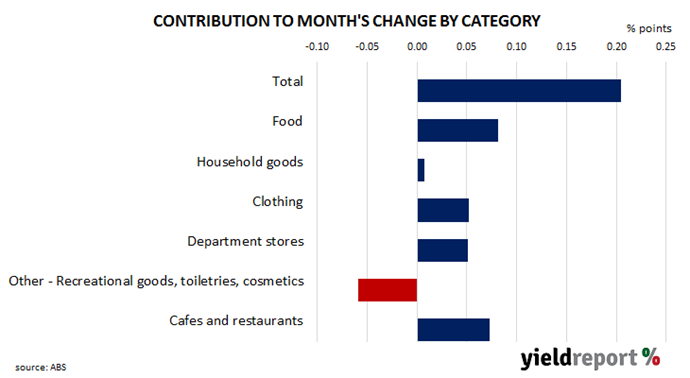
Retail sales are typically segmented into six categories (see below), with the “Food” segment accounting for nearly 40% of total sales. The largest influence on the month’s total came from this category where sales increased by 0.2% on average over the month and accounted for 0.08 percentage points of the net result.

German economy “stabilising”; ifo index up again in March

27 March 2023

Summary: ifo business climate index up in March, above expected figure; German economy stabilizing; supply chain bottlenecks dissipating; current conditions index, expectations index both up; expectations index still implies euro-zone GDP contraction of 2.7% in year to June.

Following a recession in 2009/2010, the ifo Institute’s Business Climate Index largely ignored the European debt-crisis of 2010-2012, mostly posting average-to-elevated readings through to early-2020. However, the index was quick to react in the March 2020 survey, falling precipitously. Readings through much of 2021 generally fluctuated around the long-term average before dropping away in 2022.

According to the latest report released by ifo, German business sentiment has improved for a fifth consecutive month, albeit to a lower-than-average level. March’s Business Climate Index recorded a reading of 93.3, higher than the generally expected figure of 91.0 and February’s final reading of 91.1. The average reading since January 2005 is just under 97.

“This upward development was driven primarily by business expectations; companies also assessed their current business as somewhat better,” said Clemens Fuest, President of the ifo Institute. “Despite turbulence at some international banks, the German economy is stabilising.”

German firms’ views of current conditions and their outlooks both improved. The current situation index increased from February’s figure of 93.9 to 95.4 while the expectations index increased from 88.4 after revisions to 91.2.

German and French long-term bond yields both increased markedly on the day as part of wider rise in advanced economy yields. By the close of business, the German 10-year bund yield had gained 10bps to 2.22% while the French 10-year OAT yield finished 11bps higher at 2.77%.

“Supply chain bottlenecks continue to dissipate, which is helping ease inflationary pressures,” noted ANZ senior economist Felicity Emmett.

The ifo Institute’s business climate index is a composite index which combines German companies’ views of current conditions with their outlook for the next six months. It has similarities to consumer sentiment indices in the US such as the ones produced by The Conference Board and the University of Michigan.

It also displays a solid correlation with euro-zone GDP growth rates. However, the expectations index is a better predictor as it has a higher correlation when lagged by one quarter. March’s expectations index implies a 2.7% year-on-year GDP contraction to the end of June.

Westpac-MI leading index negative for seventh consecutive month

22 March 2023

Summary: Leading index growth rate up in February; seventh consecutive month of below-trend results; reading implies annual GDP growth of around 1.75%; ACGB yields higher; rate-rise expectations firm; offshore banking problems have indirect implications for domestic growth.

Westpac and the Melbourne Institute describe their Leading Index as a composite measure which attempts to estimate the likely pace of Australian economic growth in the short-term. After reaching a peak in early 2018, the index trended lower through 2018 and 2019 before plunging to recessionary levels in the second quarter of 2020. Subsequent readings spiked towards the end of 2020 but then trended lower through 2021, 2022 and now 2023.

The February reading of the six month annualised growth rate of the indicator registered -0.94%, up a little from January’s figure of -1.04%.

Westpac Chief Economist Bill Evans noted the latest figures represent the seventh consecutive month in which the index’s six-month growth rate has been negative.

Index figures represent rates relative to “trend” GDP growth, which is generally thought to be around 2.75% per annum in Australia. The index is said to lead GDP by “three to nine months into the future” but the highest correlation between the index and actual GDP figures occurs with a three-month lead. The current reading thus represents an annual GDP growth rate of around 1.75% in the next quarter.

Domestic Treasury bond yields increased substantially, outpacing the large rises of US Treasury yields overnight. By the close of business, 3-year and 19-year ACGB yields had both gained 18bps to 2.96% and 3.37% respectively while the 20-year yield finished 13bps higher at 3.80%.

In the cash futures market, expectations regarding future rate rises firmed, somewhat reversing the previous day’s movements. At the end of the day, contracts implied the cash rate would remain essentially steady at the current rate of 3.57% to average 3.575% in April and 3.61% in May. August contracts implied a 3.505% average cash while November contracts implied 3.40%.

Evans does not expect any significant impact on Australia’s financial system from the various bank collapses in Europe and the US. However, he does expect tightening financial conditions in these regions to “have indirect implications for Australia’s growth prospects.”

Conference Board leading index still points to recession in Feb

17 March 2023

Summary: Conference Board leading index down 0.3% in February, less than expected; risk of recession in US economy; regression analysis implies negative US GDP growth to May.

The Conference Board Leading Economic Index (LEI) is a composite index composed of ten sub-indices which are thought to be sensitive to changes in the US economy. The Conference Board describes it as an index which attempts to signal growth peaks and troughs; turning points in the index have historically occurred prior to changes in aggregate economic activity. Readings from March and April of 2020 signalled “a deep US recession” while subsequent readings indicated the US economy would recover rapidly. More recent readings have trended lower, implying implied lower US GDP growth rates.

The latest reading of the LEI indicates it decreased by another 0.3% in February. The result was slightly worse than expected but it was in line with January’s figure.

“While the rate of month-over-month declines in the LEI have moderated in recent months, the leading economic index still points to risk of recession in the US economy,” said Justyna Zabinska-La Monica of The Conference Board.

US Treasury bond yields dropped on the day on the back of banking sector instability. By the close of business, the 2-year Treasury yield had shed 35bps to 3.82%, the 10-year yield had lost 15bps to 3.43% while the 30-year yield finished 8bps lower at 3.63%.

In terms of US Fed policy, expectations of higher federal funds rates over the next 12 months were reined in. At the close of business, contracts implied the effective federal funds rate would average 4.6275% in March, 5bps higher than the current spot rate, and then climb to an average of 4.73% in April. May futures contracts implied a 4.785% average effective federal funds rate while March 2024 contracts implied 3.695%.

Regression analysis suggests the latest reading implies a -1.5% year-on-year growth rate in May, down from April’s revised figure of -1.2%.

US producer prices undershoot, slip in February

15 March 2023

Summary: US producer price index (PPI) down 0.1% in February, fall contrasts with expectations; annual rate slows to 4.6%; “core” PPI flat; Treasury yields fall dramatically; rate-rise expectations soften significantly; goods prices down 0.2%, services prices down 0.1%.

Around the end of 2018, the annual inflation rate of the US producer price index (PPI) began a downtrend which continued through 2019. Months in which producer prices increased suggested the trend may have been coming to an end, only for it to continue, culminating in a plunge in April 2020. Figures returned to “normal” towards the end of that year but annual rates through 2021 and 2022 have been well above the long-term average.

The latest figures published by the Bureau of Labor Statistics indicate producer prices decreased by 0.1% after seasonal adjustments in February. The decline contrasted with the 0.3% increase which had been generally expected as well as January’s 0.3% rise after it was revised down from 0.7%. On a 12-month basis, the rate of producer price inflation after seasonal adjustments and revisions slowed from 5.7% in January to 4.6%.

Producer prices excluding foods and energy, or “core” PPI, remained steady after seasonal adjustments. The result was noticeably lower than the expected 0.4% increase and less than January’s 0.1% rise but the annual rate still slowed from January’s revised figure of 5.0% to 5.4%.

US Treasury bond yields fell dramatically on the day as news of a major European bank seeking assistance from the Swiss National Bank became public. By the close of business, the 2-year Treasury yield had dropped by 36bps to 3.89%, the 10-year yield had shed 23bps to 3.46% while the 30-year yield finished 16bps lower at 3.65%.

In terms of US Fed policy, expectations of higher federal funds rates over the next 12 months softened significantly. At the close of business, contracts implied the effective federal funds rate would average 4.6175% in March, 4bps higher than the current spot rate, and then climb to an average of 4.71% in April. May futures contracts implied a 4.835% average effective federal funds rate while March 2024 contracts implied 3.695%.

The BLS stated higher prices for final demand good fell by 0.2% on average. Prices of final demand services fell by 0.1%.

The producer price index is a measure of prices received by producers for domestically produced goods, services and construction. It is put together in a fashion similar to the consumer price index (CPI) except it measures prices received from the producer’s perspective rather than from the perspective of a retailer or a consumer. It is another one of the various measures of inflation tracked by the US Fed, along with core personal consumption expenditure (PCE) price data. 

German output expands, others go backwards in January

15 March 2023

Summary: Euro-zone industrial production up 0.7% in January, rise more than expected; annual growth rate accelerates from -2.1% to +0.9%; German, French 10-year yields drop on banking news; German output expands, contracts in France, Spain, Italy.

Following a recession in 2009/2010 and the debt-crisis which flowed from it, euro-zone industrial production recovered and then reached a peak four years later in 2016. Growth rates then fluctuated for two years before beginning a steady and persistent slowdown from the start of 2018. That decline was transformed into a plunge in March and April of 2020 which then took over a year to claw back. Production levels in more-recent months have generally stagnated in trend terms.

According to the latest figures released by Eurostat, euro-zone industrial production expanded by 0.7% in January on a seasonally-adjusted and calendar-adjusted basis. The result was more than the 0.3% expansion which had been generally expected and in contrast with December’s 1.3% contraction after revisions. The calendar-adjusted growth rate on an annual basis accelerated from December’s revised rate of -2.1% to +0.9%.

German and French sovereign bond yields dropped on the day following news of a major European bank seeking assistance from the Swiss National Bank. By the close of business, the German 10-year bund yield had shed 27bps to 2.18% while the French 10-year OAT yield finished 23bps lower at 2.73%.

Industrial production expanded in the euro-zone’s largest economy, Germany, but contracted in the other three of the euro-zone’s four largest economies. Germany’s production increased by 1.8% over the month while the comparable figures for France, Spain and Italy were -2.9%, -0.9% and -0.7% respectively.

Feb US CPI figures “stubbornly high”

14 March 2023

Summary: US CPI up 0.4% in February, in line with expectations; “core” rate up 0.5%; ANZ: US Fed “still has work to do”; Treasury yields rise; rate-rise expectations firm; NAB: figures “stubbornly high”, “not telling optimistic stories of disinflation”; non-energy services prices main driver, adds 0.35 ppts.

The annual rate of US inflation as measured by changes in the consumer price index (CPI) halved from nearly 3% in the period from July 2018 to February 2019. It then fluctuated in a range from 1.5% to 2.0% through 2019 before rising above 2.0% in the final months of that year. Substantially lower rates were reported from March 2020 to May 2020 and they remained below 2% until March 2021. Rates have since risen significantly.

The latest US CPI figures released by the Bureau of Labor Statistics indicated seasonally-adjusted consumer prices increased by 0.4% on average in February. The result was in line with expectations but slightly lower than January’s 0.5% increase. On a 12-month basis, the inflation rate slowed from 6.3% to 6.0%.

“Headline” inflation is known to be volatile and so references are often made to “core” inflation for analytical purposes. The core prices index, the index which excludes the more variable food and energy components, increased by 0.5% on a seasonally-adjusted basis for the month. The rise was above the 0.4% increase which had been generally expected as well as January’s 0.4% increase but the annual growth rate still remained steady at 5.5%.

“These figures were largely as expected but confirm the Fed still has work to do to get inflation under control,” said ANZ economist Kishti Sen.

US Treasury bond yields jumped on the day, especially at the short end, buoyed by news of a depositor bailout for Silicon Valley Bank. By the close of business, the 2-year Treasury yield had added 27bps to 4.25%, the 10-year yield had gained 11bps to 3.69% while the 30-year yield finished 10bps higher at 3.81%.

In terms of US Fed policy, expectations of higher federal funds rates over the next 12 months firmed considerably, partially reversing some of the previous day’s movements. At the close of business, contracts implied the effective federal funds rate would average 4.6375% in March, 6bps higher than the current spot rate, and then climb to an average of 4.755% in April. May futures contracts implied a 4.88% average effective federal funds rate while March 2024 contracts implied 4.03%.

NAB economist Taylor Nugent summarised the figures as “stubbornly high” and “not telling optimistic stories of disinflation.” He noted figures over the most recent three month period was just slightly below those of the most recent six-month period and described this as “hardly a compelling downtrend so far.” The largest influence on headline results is often the change in fuel prices. Prices of “Energy commodities”, the segment which contains vehicle fuels, increased by 0.5% and contributed just 0.02 percentage points to the total. However, prices of non-energy services, the segment which includes actual and implied rents, again had the largest effect on the total, adding 0.35 percentage points after increasing by 0.6% on average.

Westpac-MI sentiment index remains below 80 in March

14 March 2023

Summary: Household sentiment steady in March; second consecutive month of “extremely weak” readings; two consecutive readings below 80 in 1991, 1986; three of  five sub-indices lower; more respondents expecting higher jobless rate.

After a lengthy divergence between measures of consumer sentiment and business confidence in Australia which began in 2014, confidence readings of the two sectors converged again in mid-July 2018. Both measures then deteriorated gradually in trend terms, with consumer confidence leading the way. Household sentiment fell off a cliff in April 2020 but, after a few months of to-ing and fro-ing, it then staged a full recovery. However, consumer sentiment has deteriorated significantly over the past year, while business sentiment has been more robust.

According to the latest Westpac-Melbourne Institute survey conducted in the second week of March, household sentiment has steadied, albeit at a low level. Their Consumer Sentiment Index remained unchanged from February’s reading of 78.5, a reading which is well below the “normal” range and significantly lower than the long-term average reading of just over 101.

“This marks the second consecutive month of extremely weak consumer sentiment,” said Westpac Chief Economist Bill Evans. “Index reads below 80 are rare, back-to-back reads even rarer.”

Any reading of the Consumer Sentiment Index below 100 indicates the number of consumers who are pessimistic is greater than the number of consumers who are optimistic.

Commonwealth Government bond yields fell significantly on the day following unusually large falls of US Treasury yields overnight. By the close of business, the 3-year ACGB yield had shed 16bps to 3.05%, the 10-year yield had lost 7bps to 3.45% while the 20-year yield finished 3bps lower at 3.91%.

In the cash futures market, expectations regarding future rate rises over the next year softened considerably. At the end of the day, contracts implied the cash rate would remain essentially steady at the current rate of 3.57% to average 3.56% in April and May. August contracts implied a 3.505% average cash while November contracts implied 3.485%.

Evans noted the previous time two consecutive readings below 80 were printed was in the 1991 recession and before that, in 1986 when Australia lost its AAA credit rating.

Three of the five sub-indices registered lower readings, with the “Time to buy a major household item” sub-index again posting the largest monthly percentage loss.

The Unemployment Expectations index, formerly a useful guide to RBA rate changes, rose from 119.4 to 122.9. Higher readings result from more respondents expecting a higher unemployment rate in the year ahead.

NAB business indices down in February; economy still displays “ongoing resilience”

14 March 2023

Summary: Business conditions slip in February; confidence drops; confirms “ongoing resilience” of economy; consumer-facing sectors experiencing better conditions than business-facing sectors; capacity utilisation rate lower, remains elevated; Citi Australia: doubts over current market pricing of steady cash rate.

NAB’s business survey indicated Australian business conditions were robust in the first half of 2018, with a cyclical-peak reached in April of that year. Readings from NAB’s index then began to slip and forecasts of a slowdown in the domestic economy began to emerge in the first half of 2019 as the index trended lower. It hit a nadir in April 2020 as pandemic restrictions were introduced but then conditions improved markedly over the next twelve months. Subsequent readings were generally in a historically-normal range until the second half of 2022.

According to NAB’s latest monthly business survey of over 400 firms conducted in last week of February, business conditions have slipped a touch while remaining at a historically high level. NAB’s conditions index registered 17 points, down 1 point from January’s reading.

Business confidence also deteriorated but by a greater magnitude. NAB’s confidence index dropped from January’s reading of 6 points to -4 points, well below the long-term average. Typically, NAB’s confidence index leads the conditions index by one month, although some divergences have appeared from time to time.

“Overall, the survey confirms the ongoing resilience of the economy through the first months of 2023, though we continue to expect a more material slowdown in demand later in the year when the full effect of rate rises has passed through,” said NAB Chief Economist Alan Oster.

Commonwealth Government bond yields fell significantly on the day following unusually large falls of US Treasury yields overnight. By the close of business, the 3-year ACGB yield had shed 16bps to 3.05%, the 10-year yield had lost 7bps to 3.45% while the 20-year yield finished 3bps lower at 3.91%.

In the cash futures market, expectations regarding future rate rises over the next year softened considerably. At the end of the day, contracts implied the cash rate would remain essentially steady at the current rate of 3.57% to average 3.56% in April and May. August contracts implied a 3.505% average cash while November contracts implied 3.485%.

Oster noted a distinction between the economy’s various sectors. “In broad terms, consumer-facing sectors like retail and personal services are reporting conditions clustered around +20 index points, while business-facing sectors are clustered around a level of +10, which is also fairly strong.” However, he also said the drop in NAB’s confidence index “suggests the outlook remains clouded.”

NAB’s measure of national capacity utilisation remained at a historically-elevated level even as it declined from January’s revised figure of 85.8% to 85.2%. All eight sectors of the economy were reported to be operating above their respective long-run averages.

Capacity utilisation is generally accepted as an indicator of future investment expenditure and it also has a strong inverse relationship with the unemployment rate.

Citi Australia Chief Economist Josh Williamson cast doubt on current market pricing for a steady overnight cash rate in coming months. He noted “…rising labour costs, still-elevated goods prices in the business survey along with our expectation for a solid 56,000 increase in employment in February…” as counterpoints to arguments for a pause by the RBA in April.

February non-farm figures “justify” rate increase; yields drop on SVB news

10 March 2023

Summary: Non-farm payrolls up 311,000 in February, greater than expected; previous two months’ figures revised down by 34,000; jobless rate up from 3.4% to 3.6%, participation rate up; figures “justify another 50bps hike”; employed-to-population ratio steady; underutilisation rate up from 6.6% to 6.8%; annual hourly pay growth up from 4.4% to 4.6%.

The US economy ceased producing jobs in net terms as infection controls began to be implemented in March 2020. The unemployment rate had been around 3.5% but that changed as job losses began to surge through March and April of 2020. The May 2020 non-farm employment report represented a turning point and subsequent months provided substantial employment gains. Changes in recent months have been generally more modest but still above the average of the last decade.

According to the US Bureau of Labor Statistics, the US economy created an additional 311,000 jobs in the non-farm sector in February. The increase was greater than the 215,000 which had been generally expected but considerably less than the 504,000 jobs which had been added in January after revisions. Employment figures for December and January were revised down by a total of 34,000.

The total number of unemployed increased by 242,000 to 5.936 million while the total number of people who were either employed or looking for work increased by 419,000 to 166.251 million. These changes led to the US unemployment rate declining from January’s revised figure of 3.4% to 3.6% as the participation rate ticked up from 62.4% to 62.5%.

“There was enough strength in the report to justify another 50bps hike…given average hourly earnings for production and non-supervisory workers was stronger at 0.46% after being 0.30% in January,” noted NAB Head of Market Economics (Markets), Tapas Strickland.

US Treasury yields fell significantly on the day, although the movement was largely driven by a general flight to low-risk assets following the insolvency of Silicon Valley Bank. By the close of business, the 2-year yield had shed 29bps to 4.59%, the 10-year yield had lost 22bps to 3.70% while the 30-year yield finished 16bps lower at 3.71%.

In terms of US Fed policy, expectations of higher federal funds rates over the next 12 months softened materially. At the close of business, contracts implied the effective federal funds rate would average 4.6625% in March, 9bps higher than the current spot rate, and then climb to an average of 4.90% in April. May futures contracts implied a 5.145% average effective federal funds rate while February 2024 contracts implied 4.70%.

One figure which is indicative of the “spare capacity” of the US employment market is the employment-to-population ratio. This ratio is simply the number of people in work divided by the total US population. It hit a cyclical-low of 58.2 in October 2010 before slowly recovering to just above 61% in late-2019. February’s reading remained steady at 60.2%, still some way from the April 2000 peak reading of 64.7%.

Apart from the unemployment rate, another measure of tightness in the labour market is the underutilisation rate and the latest reading of it registered 6.8%, up from 6.6% in January. Wage inflation and the underutilisation rate usually have an inverse relationship, even though hourly pay growth in the year to February accelerated from 4.4% to 4.6%.

“Moderation in wage growth is encouraging for the Fed, but the numbers could be biased by strong growth in leisure and hospitality jobs, which are lower paid than average,” Steven noted.

Click for more news