News

Policy measures felt in some sectors; US quit rate down in January

08 March 2023

Summary: US quit rate declines at 2.5% in January; short-term US yields up, expectations of higher rates firm; quits, openings, separations all down; tighter monetary policy being felt in some sectors but not others.

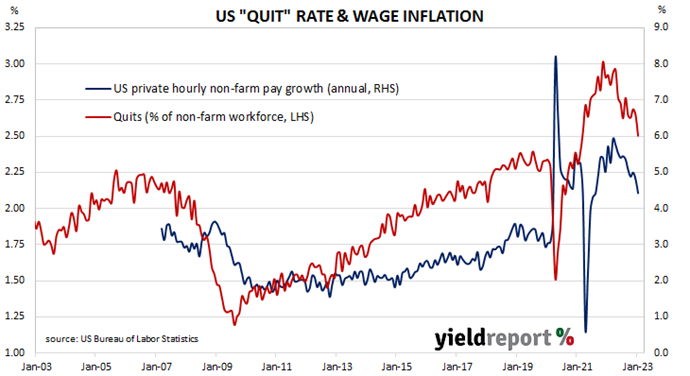
The number of US employees who quit their jobs as a percentage of total employment increased slowly but steadily after the GFC. It peaked in March 2019 and then tracked sideways until virus containment measures were introduced in March 2020. The quit rate then plummeted as alternative employment opportunities rapidly dried up. Following the easing of US pandemic restrictions, it proceeded to recover back to its pre-pandemic rate in the third quarter of 2020 and trended higher through 2021 before easing through 2022.

Figures released as part of the latest Job Openings and Labor Turnover Survey (JOLTS) report show the quit rate slipped in January. 2.5% of the non-farm workforce left their jobs voluntarily, down from 2.6% in December. Quits in the month fell by 207,000 while an additional 517,000 people were employed in non-farm sectors.

The figures were published on the same day as the latest ADP report and testimony by Fed chief Jerome Powell. Short-term US Treasury yields moved moderately higher and, by the close of business, the 2-year yield had gained 5bps to 5.06% while 10-year and 30-year yields both finished 1bp higher 3.98% and 3.88% respectively.

In terms of US Fed policy, expectations of higher federal funds rates over the next 12 months firmed. At the close of business, contracts implied the effective federal funds rate would average 4.7025% in March, 13bps higher than the current spot rate, and then climb to an average of 5.005% in April. May futures contracts implied a 5.325% average effective federal funds rate while January contracts implied 5.55%.

The fall in total quits was led by 221,000 fewer resignations in the “Professional and business services” sector while the “Retail trade” sector experienced the largest gain, increasing by 35,000. Overall, the total number of quits for the month fell from December’s revised figure of 4.091 million to 3.884 million.         

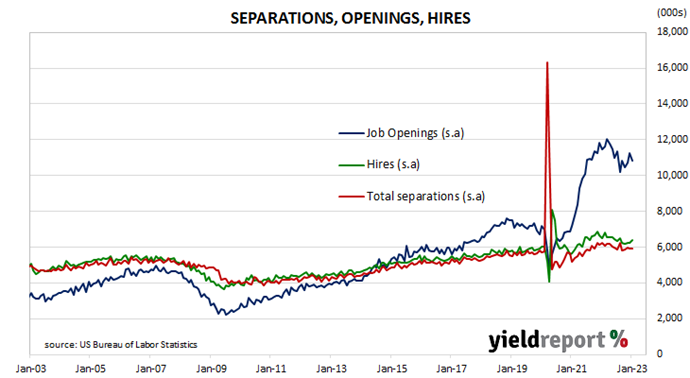
Total vacancies at the end of January decreased by 0.410 million, or 3.6%, from December’s revised figure of 11.234 million to 10.824 million. The fall was driven by a 240,000 decrease in the “Construction” sector while the “Professional and business services” sector experienced the single largest increase, rising by 95,000. Overall, 10 out of 18 sectors experienced fewer job openings than in the previous month.  

“Within the details, openings did fall sharply in IT, construction and real-estate, the sectors where tighter policy is being felt, but rose in leisure and hospitality and retail, where consumer spending remains resilient,” noted NAB Head of Market Economics (Markets), Tapas Strickland.

Total separations decreased by 4,000, or 0.1%, from December’s revised figure of 5.906 million to 5.902 million. The fall was led by the “Professional and business services” sector where there were 60,000 fewer separations than in December. Separations decreased in 7 of the 18 sectors.

The “quit” rate time series produced by the JOLTS report is a leading indicator of US hourly pay. As wages account for around 55% of a product’s or service’s price in the US, wage inflation and overall inflation rates tend to be closely related. Former Federal Reserve chief and current Treasury Secretary Janet Yellen was known to pay close attention to it.

Private inflation measure slows in February

06 March 2023

Summary: Melbourne Institute Inflation Gauge index up 0.4% in February; up 6.3% on annual basis; ACGB yields down; noticeably; rate rise expectations soften slightly.

The Melbourne Institute’s Inflation Gauge is an attempt to replicate the ABS consumer price index (CPI) on a monthly basis. It has turned out to be a reliable leading indicator of the CPI, although there are periods in which the Inflation Gauge and the CPI have diverged for as long as twelve months. On average, the Inflation Gauge’s annual rate tends to overestimate the ABS rate by around 0.1%, at least until recently.

The Melbourne Institute’s latest reading of its Inflation Gauge index indicates consumer prices increased by 0.4% in February, following increases of 0.9% and 0.2% in January and December respectively. The index rose by 6.3% on an annual basis, down a touch from January’s figure of 6.4%.

Commonwealth Government bond yields decreased noticeably on the day following similar movements in US Treasury yields on Friday night. By the close of business, the 3-year ACGB yield had shed 9bps to 3.52% while 10-year and 20-year yields both finished 14bps lower at 3.77% and 4.08% respectively.

In the cash futures market, expectations regarding future rate rises softened slightly. At the end of the day, contracts implied the cash rate would rise from the current rate of 3.32% to average 3.495% in March and then increase to an average of 3.865% through May. August 2023 contracts implied a 4.12% average cash rate while November 2023 contracts implied 4.155%.

Central bankers desire a certain level of inflation which is “sufficiently low that it does not materially distort economic decisions in the community” but high enough so it does not constrain “a central bank’s ability to combat recessions.”

Dwelling approval volatility continues, dives in January

02 March 2023

Summary: Home approval numbers down 27.6% in January, below expectations; 8.4% lower than January 2022; Westpac: consistent with broader evidence of wider correction in housing market; house approvals down 13.5%, apartments down 43.6%; non-residential approvals down 25.6% in dollar terms, residential alterations down 4.0%.

Building approvals for dwellings, that is apartments and houses, headed south after mid-2018. As an indicator of investor confidence, falling approvals had presented a worrying signal, not just for the building sector but for the overall economy. However, approval figures from late-2019 and the early months of 2020 painted a picture of a recovery taking place, even as late as April of that year. Subsequent months’ figures then trended sharply upwards before falling back in 2021 and 2022.

The Australian Bureau of Statistics has released the latest figures from January which show total residential approvals dropped by 27.6% on a seasonally-adjusted basis. The fall was a considerably larger one than the 7.5% decrease which had been generally expected and it contrasted with December’s 15.3% rise. Total approvals fell by 8.4% on an annual basis, down from the previous month’s figure of -3.7%. Monthly growth rates are often volatile.

“While consistent with the broader evidence around the wider correction in the housing market, seasonal volatility again looks to be playing a clear role, warranting caution against reading too much into the sheer size of the monthly decline,” said Westpac economist Ryan Wells.

Commonwealth Government bond yields rose on the day, somewhat following overnight movements of their US Treasury counterparts. By the close of business, the 3-year ACGB yield had added 6bps to 3.58%, the 10-year yield had gained 8bps to 3.87% while the 20-year yield finished 6bps higher at 4.20%.

In the cash futures market, expectations regarding future rate rises remained largely unchanged. At the end of the day, contracts implied the cash rate would rise from the current rate of 3.32% to average 3.495% in March and then increase to an average of 3.875% through May. August 2023 contracts implied a 4.15% average cash rate while November 2023 contracts implied 4.175%.

Approvals for new houses fell by 13.5% over the month, down from -2.1% in December. On a 12-month basis, house approvals were 12.2% lower than they were in January 2022, up from December’s comparable figure of -12.9%. 

Apartment approval figures are usually a lot more volatile and January’s total dropped by 43.6% after a 44.5% jump in December. The 12-month growth rate fell from December’s revised rate of 9.5% to -0.7%.

Non-residential approvals fell by 25.6% in dollar terms over the month but were still 34.2% higher on an annual basis. Figures in this segment also tend to be rather volatile.

Residential alteration approvals decreased by 4.0% in dollar terms over the month but were 1.0% higher than in January 2022.

ISM PMI up in February, still in contraction territory

01 March 2023

Summary: ISM PMI up in February, slightly below expectations; companies slowing outputs to match demand in first half of 2023; US Treasury yields up, expectations of Fed rate rises harden; ISM: reading corresponds to 0.3% US GDP contraction annualised.

The Institute of Supply Management (ISM) manufacturing Purchasing Managers Index (PMI) reached a cyclical peak in September 2017. It then started a downtrend which ended in March 2020 with a contraction in US manufacturing which lasted until June 2020. Subsequent month’s readings implied growth had resumed, with the index becoming stronger through to March 2021. Since then, readings have declined steadily.

According to the ISM’s February survey, its PMI recorded a reading of 47.7%, slightly below the generally expected figure of 47.8% but above January’s 47.4. The average reading since 1948 is 53.0% and any reading below 50% implies a contraction in the US manufacturing sector relative to the previous month.

“With Business Survey Committee panellists reporting softening new order rates over the previous nine months, the February composite index reading reflects companies continuing to slow outputs to better match demand for the first half of 2023 and prepare for growth in the second half of the year,” said Timothy Fiore, Chair of the ISM’s Manufacturing Business Survey Committee.

US Treasury yields finished the day higher. By the close of business, the 2-year Treasury bond yield had gained 6bps to 4.88%, the 10-year yield had added 7bps to 4.00% while the 30-year yield finished 2bps higher at 3.95%.

In terms of US Fed policy, expectations of higher federal funds rates over the next 12 months hardened. At the close of business, contracts implied the effective federal funds rate would average 4.665% in March, 9bps higher than the current spot rate, and then climb to an average of 4.885% in April. May futures contracts implied a 5.125% average effective federal funds rate while December contracts implied 5.375%.

Purchasing managers’ indices (PMIs) are economic indicators derived from monthly surveys of executives in private-sector companies. They are diffusion indices, which means a reading of 50% represents no change from the previous period, while a reading under 50% implies respondents reported a deterioration on average. A reading “above 48.7%, over a period of time, generally indicates an expansion of the overall economy” according to the ISM.     

The ISM’s manufacturing PMI figures appear to lead US GDP by several months despite a considerable error in any given month. The chart below shows US GDP on a “year on year” basis (and not the BEA annualised basis) against US GDP implied by monthly PMI figures. 

According to the ISM and its analysis of past relationships between the PMI and US GDP, February’s PMI corresponds to an annualised contraction rate of 0.3%, or 0.1% over a quarter. Regression analysis on a year-on-year basis suggests a 12-month GDP growth rate of 1.8% five months after this latest report.

The ISM index is one of two monthly US PMIs, the other being an index published by S&P Global. S&P Global produces a “flash” estimate in the last week of each month which comes out about a week before the ISM index is published. The S&P Global flash February manufacturing PMI registered 50.2%, 3.4 percentage points higher than January’s final figure.

US households planning fewer purchases; Conf. Board index down again in Feb

28 February 2023

Summary: Conference Board Consumer Confidence Index falls in February, reading less than expected; fewer consumers planning to buy major appliances, vehicle, houses; large drops in confidence for households aged 35 to 54, households earning $35,000 or more; views of present conditions improve, short-term outlook deteriorates again.

US consumer confidence clawed its way back to neutral over the five years after the GFC in 2008/2009 and then went from strength to strength until late 2018. Measures of consumer confidence then oscillated within a relatively narrow band at historically high levels until they plunged in early 2020. Subsequent readings then fluctuated around the long-term average until March 2021 when they returned to elevated levels. However, a noticeable gap has since emerged between the two most-widely followed surveys.

The latest Conference Board survey held during the first three weeks of February indicated US consumer confidence has deteriorated for a second month running. February’s Consumer Confidence Index registered 102.9 on a preliminary basis, lower than the expected figure of 108.4 and down from January’s final figure of 106.0.

“Expectations around jobs, incomes and business conditions all deteriorated. Fewer consumers are planning to buy major appliances, autos and houses,” noted ANZ economist Kishti Sen.

Short-term US Treasury yields moved moderately higher while longer-term yields held almost steady. By the close of business, the 2-year Treasury bond yield had gained 3bps to 4.82%, the 10-year yield had returned to its starting point at 3.93% while the 30-year yield finished 1bp lower, also at 3.93%.

In terms of US Fed policy, expectations of higher federal funds rates over the next 12 months remained essentially unchanged. At the close of business, contracts implied the effective federal funds rate would average 4.665% in March, 9bps higher than the current spot rate, and then climb to an average of 4.875% in April. May futures contracts implied a 5.11% average effective federal funds rate while December contracts implied 5.31%.

“The decrease reflected large drops in confidence for households aged 35 to 54 and for households earning $35,000 or more,” said Ataman Ozyildirim, a senior director of economics at The Conference Board.

Consumers’ views of present conditions improved while their views of the near-future deteriorated in a repeat of the previous month’s pattern. The Present Situation Index increased from January’s revised figure of 151.1 to 152.8 while the Expectations Index dropped from a revised figure of 76.0 to 69.7.

The Consumer Confidence Survey is one of two widely followed monthly US consumer sentiment surveys which produce sentiment indices. The Conference Board’s index is based on perceptions of current business and employment conditions, as well as respondents’ expectations of conditions six months in the future. The other survey, conducted by the University of Michigan, is similar and it is used to produce an Index of Consumer Sentiment. That survey differs in that it does not ask respondents explicitly about their views of the labour market and it also includes some longer-term questions.

January retail figures more than expected; still points to slowdown

28 February 2023

Summary: Retail sales up 1.9% in January, more than expected; households switching from retail towards discretionary services; underlying trend still shows slowdown; largest influence on result from clothing.

Growth figures of domestic retail sales spent most of the 2010s at levels below the post-1992 average. While economic conditions had been generally favourable, wage growth and inflation rates were low. Expenditures on goods then jumped in the early stages of 2020 as government restrictions severely altered households’ spending habits. Households mostly reverted to their usual patterns as restrictions eased in the latter part of 2020 and throughout 2021, although not for all categories.

According to the latest ABS figures, total retail sales rose by 1.9% in January on a seasonally adjusted basis. The rise was greater than the 1.5% increase which had been generally expected and in contrast with December’s revised figure of -4.0%. Sales increased by 7.5% on an annual basis, up a touch from December’s comparable figure of 7.4% after revisions.

“More households are switching consumption from retail towards discretionary services, like travel, which are not counted in retail sales,” said ANZ economist Madeline Dunk. “More broadly, we continue to expect consumption growth to slow in 2023, as rate rises and cost-of-living pressures eat into household budgets.”

Commonwealth Government bond yields moved lower on the day. By the close of business, the 3-year ACGB yield had shed 4bps to 3.61%, the 10-year yield had lost 2bps to 3.86% while the 20-year  yield finished 1bp lower at 4.17%.

In the cash futures market, expectations regarding future rate rises softened. At the end of the day, contracts implied the cash rate would rise from the current rate of 3.32% to average 3.505% in March and then increase to an average of 3.935% through May. August 2023 contracts implied a 4.24% average cash rate while November 2023 contracts implied 4.275%.

“The rebound was better than expected coming off the choppy end of 2022 with November sales up 1.7% and December down 4%,” noted Westpac senior economist Matthew Hassan. “All industries experienced a rise in retail sales although the underlying trend still shows a slowdown, sales up just 0.1% over the 3 months to January compared to the 3 months to October.”

Retail sales are typically segmented into six categories (see below), with the “food” segment accounting for nearly 40% of total sales. However, the largest influence on the month’s total came from the clothing category where sales increased by 6.5% on average over the month and accounted for 0.5 percentage points of the net result.

“Softest period since start of 2021” despite January lending growth

28 February 2023

Summary: Private sector credit up 0.4% in January, greater than expected; annual growth rate down from 8.3% to 8.0%; softest period since start of 2021; bond yields down, rate-rise expectations soften; Westpac: “sharp economic slowdown” will add to slowing of credit demand; business lending accounts for nearly 50% of net growth, owner-occupier lending for nearly 45%.

The pace of lending to the non-bank private sector by financial institutions in Australia followed a steady-but-gradual downtrend from late-2015 through to early 2020 before hitting what appears to be a nadir in March 2021. That downtrend ended later in the same year and annual growth rates have only recently declined below the peak seen in the previous decade.

According to the latest RBA figures, private sector credit increased by 0.4% in January. The result was greater than the 0.3% increase which had been generally expected as well as December’s 0.3% rise. However, on an annual basis, the growth rate slowed from 8.3% to 8.0%.

“The results of the past two months represent the softest two month period since the start of 2021,” said Westpac senior economist Andrew Hanlan.

Commonwealth Government bond yields moved lower on the day. By the close of business, the 3-year ACGB yield had shed 4bps to 3.61%, the 10-year yield had lost 2bps to 3.86% while the 20-year  yield finished 1bp lower at 4.17%.

In the cash futures market, expectations regarding future rate rises softened. At the end of the day, contracts implied the cash rate would rise from the current rate of 3.32% to average 3.505% in March and then increase to an average of 3.935% through May. August 2023 contracts implied a 4.24% average cash rate while November 2023 contracts implied 4.275%.

Hanlan expects slower private loan growth in the wake of higher interest rates but also expects the Australian economy in general to play a part. “More generally, a sharp economic slowdown is in prospect for the Australian economy in 2023, which will reinforce the slowing in demand for credit.”

Business lending accounted for just under 50% of the net growth over the month. Owner-occupier lending accounted for nearly 45% and investor lending accounted for most of the balance.

The traditional driver of overall loan growth, the owner-occupier segment, grew by 0.4% over the month, the same growth rate as in December and November. The sector’s 12-month growth rate slowed again, this time from 6.9% to 6.6%.

Total lending in the business sector increased by 0.5%, up from the 0.3% increase recorded in the previous month. Growth on an annual basis slowed from 12.9% to 12.5%.

Monthly growth in the investor-lending segment slowed to a near-halt in early 2018 and essentially stayed that way until mid-2021. In January, net lending grew by 0.2%, the same rate as in December and the 12-month growth rate slowed from 5.5% to 5.1%.

Total personal loans increased by 0.1%, in contrast to December’s -0.5%, taking the annual contraction rate from -0.1% to 0.5%. This category of debt includes fixed-term loans for large personal expenditures, credit cards and other revolving credit facilities.

Euro-zone ESI slips in February; still close to long-term average

27 February 2023

Summary: Euro-zone composite sentiment index down slightly in February, below expectations; readings up in two of five sectors; up in two of four largest euro-zone economies; German, French 10-year yields moderately higher; index implies annual GDP growth rate of 1.3%.

The European Commission’s Economic Sentiment Indicator (ESI) is a composite index comprising five differently weighted sectoral confidence indicators.  It is heavily weighted towards confidence surveys from the business sector, with the consumer confidence sub-index only accounting for 20% of the ESI. However, it has a good relationship with euro-zone GDP, although not necessarily as a leading indicator.

The ESI posted a reading of 99.7 in February, below the consensus expectation of 101.0 but just a touch lower than January’s revised reading of 99.8. The decline ended three months of gains but kept the index just under the long-term average. The average reading since 1985 is just under 100.

German and French 10-year bond yields finished the day moderately higher. By the close of business, the German 10-year bund yield had gained 5bps to 2.58% while the French 10-year OAT yield also finished 5bps higher, at 3.05%.

Confidence improved in two of the five sectors of the economy, the consumer sector and retail trade sector, while the industrial and services sectors deteriorated and the construction sector remained steady. On a geographical basis, the ESI decreased in two of the euro-zone’s four largest economies, Italy and Spain, and remained largely unchanged in the other two, France and Germany.

End-of-quarter ESI readings and annual euro-zone GDP growth rates are highly correlated. This latest reading corresponds to a year-to-February GDP growth rate of 1.3%, unchanged from January’s implied growth rate after revisions.

US PCE data confirm US economy strength in January

24 February 2023

Summary: US core PCE price index up 0.6% in January, greater than expected; annual rate accelerates from 4.6% to 4.7%; US economy starts year stronger than previously expected; Treasury yields higher; Fed rate-rise expectations harden.

One of the US Fed’s favoured measures of inflation is the change in the core personal consumption expenditures (PCE) price index. After hitting the Fed’s target at the time of 2.0% in mid-2018, the annual rate then hovered in a range between 1.8% and 2.0% before it eased back to a range between 1.5% and 1.8% through 2019. It then plummeted below 1.0% in April 2020 before rising back to around 1.5% in the September quarter of that year. It has since increased significantly above the Fed’s target.

The latest figures have now been published by the Bureau of Economic Analysis as part of the January personal income and expenditures report. Core PCE prices rose by 0.6% over the month, greater than the 0.4% increase which had been generally expected as well as December’s 0.4%. On a 12-month basis, the core PCE inflation rate accelerated from December’s revised rate of 4.6% to 4.7%.

“Overall, the reality is that the US economy has started 2023 from a stronger position than many of us had expected and when we look at the Fed’s new preferred inflation reading that tries to exclude much of the noise in the data, the story doesn’t change,” said NAB Senior FX Strategist (Markets) Rodrigo Catril.

US Treasury bond yields increased on the day, especially at the short end. By the close of business, the 2-year Treasury bond yield had jumped 11bps to 4.80%, the 10-year yield had gained 7bps to 3.95% while the 30-year yield finished 4bps higher at 3.93%.

In terms of US Fed policy, expectations of higher federal funds rates over the next 12 months generally hardened. At the close of business, contracts implied the effective federal funds rate would average 4.665% in March, 9bps higher than the current spot rate, and then climb to an average of 4.88% in April. May futures contracts implied a 5.12% average effective federal funds rate while December contracts implied 5.305%.

The core version of PCE strips out energy and food components, which are volatile from month to month, in an attempt to identify the prevailing trend. It is not the only measure of inflation used by the Fed; the Fed also tracks the Consumer Price Index (CPI) and the Producer Price Index (PPI) from the Department of Labor. However, it is the one measure which is most often referred to in FOMC minutes.

Germany’s ifo index up for fourth consecutive month

22 February 2023

Summary: ifo business climate index up in February, slightly above expected figure; German economy emerging from period of weakness; current conditions index down a touch, expectations index up; expectations index still implies euro-zone GDP contraction of 3.7% in year to May.

Following a recession in 2009/2010, the ifo Institute’s Business Climate Index largely ignored the European debt-crisis of 2010-2012, mostly posting average-to-elevated readings through to early-2020. However, the index was quick to react in the March 2020 survey, falling precipitously. Readings through much of 2021 generally fluctuated around the long-term average before dropping away in 2022.

According to the latest report released by ifo, German business sentiment has improved for a fourth consecutive month, albeit to a still-depressed level. February’s Business Climate Index recorded a reading of 91.1, a little higher than the generally expected figure of 90.7 as well as January’s final reading of 90.1. The average reading since January 2005 is just under 97.

“Expectations in particular were brighter,” said Clemens Fuest, President of the ifo Institute. ”However, assessments of the current situation were slightly less good. The German economy is gradually working its way out of a period of weakness.”

German firms’ views of current conditions deteriorated a touch while their outlooks improved. The current situation index declined from January’s figure of 94.1 to 93.9 while the expectations index increased from 86.4 after revisions to 88.5.

German and French long-term bond yields both fell modestly on the day. By the close of business, German and French 10-year bond yields had both lost 2bps to 2.53% and 3.00% respectively.

The ifo Institute’s business climate index is a composite index which combines German companies’ views of current conditions with their outlook for the next six months. It has similarities to consumer sentiment indices in the US such as the ones produced by The Conference Board and the University of Michigan.

It also displays a solid correlation with euro-zone GDP growth rates. However, the expectations index is a better predictor as it has a higher correlation when lagged by one quarter. February’s expectations index implies a 3.7% year-on-year GDP contraction to the end of May.

Click for more news