News

Supply constraints rather than demand; December quarter construction declines

22 February 2023

Summary: Construction spending down 0.4% in December quarter, contrasts with expected increase; constraints around output rather than shrinking demand; residential sector up 0.9%, non-residential building down 5.1%, engineering up 1.0%.

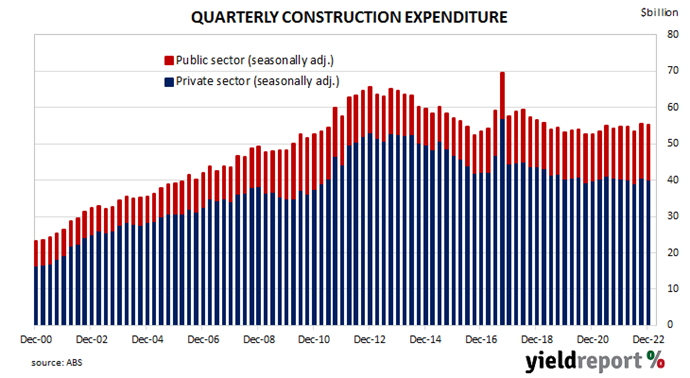
Construction expenditure increased substantially in Australia in the early part of last decade following a more-steady expansion through the 2000s. A large portion of the increase came from the commissioning of new projects and the expansion of existing ones to exploit a tripling in price of Australia’s mining exports in the previous decade. Growth rates began slowing in 2017 and the return to “normal” investment levels have now taken place.

According to the latest construction figures published by the ABS, total construction in the December quarter decreased by 0.4%. The fall was in contrast with the 1.5% increase which had been expected as well as the September quarter’s 3.7% increase after it was revised up from 2.2%. On an annual basis, the growth rate slowed from 2.4% to 1.0%.

“The decline was driven by a sharp fall in private non-residential construction, as well as a decline in private sector engineering work,” said ANZ senior economist Catherine Birch. “This is likely to be driven more by constraints around output rather than shrinking demand.”

Domestic Treasury bond yields increased moderately, lagging the noticeable rises of US Treasury yields overnight. By the close of business, the 3-year ACGB yield had added 2bps to 3.59%, the 10-year yield had gained 6bps to 3.88% while the 20-year yield finished 4bps higher at 4.22%.

In the cash futures market, expectations regarding future rate rises softened. At the end of the day, contracts implied the cash rate would rise from the current rate of 3.33% to average 3.50% in March and then increase to an average of 3.905% in May. August contracts implied a 4.21% average cash while November contracts implied 4.205%.

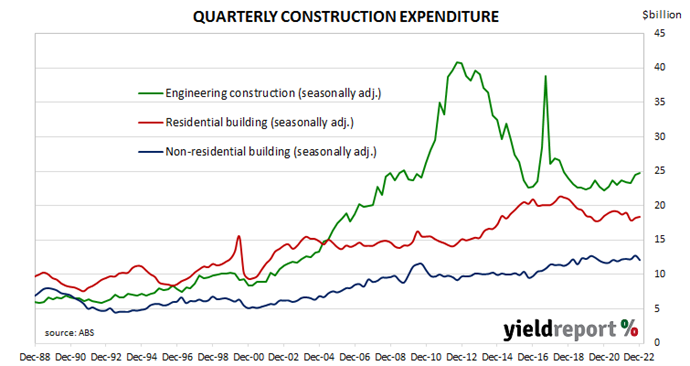
Residential building construction expenditures rose by 0.9%, less than the September quarter’s 2.1% increase after revisions. On an annual basis, expenditure in this segment was 1.8% lower than the December 2021 quarter, up from the September quarter’s revised figure of -4.8%.

Non-residential building spending dropped by 5.1%, in contrast to the previous quarter’s 4.3% increase. On an annual basis, expenditures were 0.8% lower than the December 2021 quarter, whereas the September quarter’s comparable figure was +7.0% after revisions.

Engineering construction increased by 1.0% in the quarter, less than the 4.7% increase in the September quarter. On an annual basis, spending in this segment was 4.3% higher than the December 2021 quarter, down from the September quarter’s comparable figure of +5.9% after revisions.

Quarterly construction data compiled and released by the ABS are not considered to be of a “primary” nature, unlike unemployment (Labour Force) and inflation (CPI) figures. However, the figures are viewed by economists and analysts with interest as they directly feed into quarterly GDP figures.

Economy to “stall” in second half: Jan Westpac-MI leading index

22 February 2023

Summary: Leading index growth rate up a little in January; points to below-trend growth in 2023; Westpac expects economy to “stall” in second half; reading implies annual GDP growth of around 1.75%; ACGB yields higher; rate-rise expectations soften.

Westpac and the Melbourne Institute describe their Leading Index as a composite measure which attempts to estimate the likely pace of Australian economic growth in the short-term. After reaching a peak in early 2018, the index trended lower through 2018 and 2019 before plunging to recessionary levels in the second quarter of 2020. Subsequent readings spiked towards the end of 2020 but then trended lower through 2021 and 2022.

The January reading of the six month annualised growth rate of the indicator registered -1.04%, up a little from December’s figure of -1.09% after it was revised down from -0.97%.

“This marks the sixth consecutive month that the growth rate has been negative,” said Westpac Chief Economist Bill Evans. “The Index continues to point to below-trend growth over the next 3-9 months. Westpac concurs with that view, with growth in the Australian economy expected to slow to stalling speed by the second half of 2023.”

Index figures represent rates relative to “trend” GDP growth, which is generally thought to be around 2.75% per annum in Australia. The index is said to lead GDP by “three to nine months into the future” but the highest correlation between the index and actual GDP figures occurs with a three-month lead. The current reading thus represents an annual GDP growth rate of around 1.75% in the next quarter.

Domestic Treasury bond yields increased moderately, lagging the noticeable rises of US Treasury yields overnight. By the close of business, the 3-year ACGB yield had added 2bps to 3.59%, the 10-year yield had gained 6bps to 3.88% while the 20-year yield finished 4bps higher at 4.22%.

In the cash futures market, expectations regarding future rate rises softened. At the end of the day, contracts implied the cash rate would rise from the current rate of 3.33% to average 3.50% in March and then increase to an average of 3.905% in May. August contracts implied a 4.21% average cash while November contracts implied 4.205%.

Euro-zone consumer sentiment up for fifth consecutive month

20 February 2023

Summary: Euro-zone households less pessimistic in February; consumer confidence index up 1.7 points; still well below long-term average, lower bound of “normal” readings; aided by relatively mild winter, receding energy fears, slowing headline inflation ; euro-zone bond yields moderately higher.

EU consumer confidence plunged during the GFC and again in 2011/12 during the European debt crisis. After bouncing back through 2013 and 2014, it fell back significantly in late 2018 but only to a level which corresponds to significant optimism among households. Following the plunge which took place in April 2020, a recovery began a month later, with household confidence returning to above-average levels from March 2021. However, recent readings have been extremely low by historical standards.

Consumer confidence improved for a fifth consecutive month in February according to the latest survey conducted by the European Commission. Its Consumer Confidence Indicator recorded a reading of -19.0, in line with expectations but above January’s revised figure of -20.7. However, this latest reading is still well below the long-term average of -11.6 as well as the lower end of the range in which “normal” readings usually occur.

“A relatively mild winter, receding energy fears and slowing headline inflation have helped boost the index,” said NAB economist Taylor Nugent.

Sovereign bond yields rose moderately in major euro-zone bond markets on the day. By the end of it, the German 10-year bund yield had gained 4bps to 2.46% while the French 10-year OAT yield finished 3bps higher at 2.93%.

Conference Board leading index down again in January; expects recession later in 2023

17 February 2023

Summary: Conference Board leading index down 0.3% in January, in line with expectations; signals recession even as US labour market indicators remain robust; regression analysis implies zero US GDP growth to April.

The Conference Board Leading Economic Index (LEI) is a composite index composed of ten sub-indices which are thought to be sensitive to changes in the US economy. The Conference Board describes it as an index which attempts to signal growth peaks and troughs; turning points in the index have historically occurred prior to changes in aggregate economic activity. Readings from March and April of 2020 signalled “a deep US recession” while subsequent readings indicated the US economy would recover rapidly. More recent readings have trended lower, implying implied lower US GDP growth rates.

The latest reading of the LEI indicates it decreased by 0.3% in January. The result was in line with expectations but higher than December’s revised figure of -0.8%.

“While the LEI continues to signal recession in the near term, indicators related to the labour market, including employment and personal income, remain robust so far” said Ataman Ozyildirim, Senior Director, Economics, at The Conference Board. “Nonetheless, The Conference Board still expects high inflation, rising interest rates and contracting consumer spending to tip the US economy into recession in 2023.”

US Treasury bond yields moved lower on the day. By the close of business, the 2-year Treasury yield had lost 2bps to 4.63% while 10-year and 30-year yields both finished 8bps lower at 3.82% and 3.87% respectively.

In terms of US Fed policy, expectations of higher federal funds rates over the next 12 months firmed. At the close of business, contracts implied the effective federal funds rate would average 4.665% in March, 9bps higher than the current spot rate, and then climb to an average of 4.865% in April. May futures contracts implied a 5.08% average effective federal funds rate while December contracts implied 5.13%.

Regression analysis suggests the latest reading implies a zero year-on-year growth rate in April, down from March’s revised figure of 0.3%.  

US producer price inflation “hot” in January

16 February 2023

Summary: US producer price index (PPI) up 0.7% in January, rise greater than expected; annual rate slows to 6.0%; “core” PPI up 0.3%; inflation “hot”; Treasury yields rise noticeably, rate-rise expectations soften; goods prices up 1.2%, services prices up 0.4%.

Around the end of 2018, the annual inflation rate of the US producer price index (PPI) began a downtrend which continued through 2019. Months in which producer prices increased suggested the trend may have been coming to an end, only for it to continue, culminating in a plunge in April 2020. Figures returned to “normal” towards the end of that year but annual rates through 2021 and 2022 have been well above the long-term average.

The latest figures published by the Bureau of Labor Statistics indicate producer prices increased by 0.7% after seasonal adjustments in January. The rise was slightly greater than the 0.5% increase which had been generally expected and in contrast with December’s 0.2% fall after it was revised up from -0.5%. On a 12-month basis, the rate of producer price inflation after seasonal adjustments and revisions slowed from 6.5% in December to 6.0%.

Producer prices excluding foods and energy, or “core” PPI, increased by 0.5% after seasonal adjustments. The result was higher than the expected 0.3% as well as December’s 0.3% rise but the annual rate still slowed from December’s revised figure of 5.7% to 5.5%.

“In other words, no matter how you cut it, inflation was hot,” said NAB Head of Market Economics (Markets), Tapas Strickland. “The latest data supports the Fed view of…continuing to raise rates and hold them there higher for longer.”

US Treasury bond yields rose noticeably on the day. By the close of business, the 2-year Treasury yield had added 4bps to 4.65%, the 10-year yield had gained 7bps to 3.87% while the 30-year yield finished 8bps higher at 3.92%.

In terms of US Fed policy, expectations of higher federal funds rates over the next 12 months softened a touch. At the close of business, contracts implied the effective federal funds rate would average 4.66% in March, 8bps higher than the current spot rate, and then climb to an average of 4.855% in April. May futures contracts implied a 5.04% average effective federal funds rate while December contracts implied 5.07%.

The BLS stated higher prices for final demand good rose by 1.2% on average. Prices of final demand services rose by 0.4%.

The producer price index is a measure of prices received by producers for domestically produced goods, services and construction. It is put together in a fashion similar to the consumer price index (CPI) except it measures prices received from the producer’s perspective rather than from the perspective of a retailer or a consumer. It is another one of the various measures of inflation tracked by the US Fed, along with core personal consumption expenditure (PCE) price data. 

Warmer January reduces US industrial output

15 February 2023

Summary: US industrial output flat in January, below expectations; up 0.8% over past 12 months; reduced demand for heating; capacity utilisation rate down 0.1ppts to 78.3%, below long-term average.

The Federal Reserve’s industrial production (IP) index measures real output from manufacturing, mining, electricity and gas company facilities located in the United States. These sectors are thought to be sensitive to consumer demand and so some leading indicators of GDP use industrial production figures as a component. US production collapsed through March and April of 2020 before recovering the ground lost over the fifteen months to July 2021.

According to the Federal Reserve, US industrial production remained steady on a seasonally adjusted basis in January. The result was less than the 0.5% increase which had been generally expected but more than December’s -1.0% after it was revised down from -0.7%. On an annual basis the growth rate slowed from December’s revised figure of 1.1% to 0.8%.

“US industrial production was flat but was held down by an 8.9% plunge in utilities output on reduced demand for heating,” noted NAB Senior FX Strategist (Markets) Rodrigo Catril.

The figures came out the same morning as the latest retail sales figures and longer-term US Treasury bond yields rose moderately while short-term yields declined on the day. By the close of business, the 2-year Treasury yield had slipped 1bp to 4.61% while 10-year and 30-year yields both finished 5bps higher at 3.80% and 3.84% respectively.

In terms of US Fed policy, expectations of higher federal funds rates over the next 12 months mostly softened slightly. At the close of business, contracts implied the effective federal funds rate would average 4.66% in March, 8bps higher than the current spot rate, and then climb to an average of 4.85% in April. May futures contracts implied a 5.035% average effective federal funds rate while December contracts implied 5.105%. 

The same report includes US capacity utilisation figures which are generally accepted as an indicator of future investment expenditure and/or inflationary pressures. Capacity usage had hit a high for the last business cycle in early 2019 before it began a downtrend which ended with April 2020’s multi-decade low of 64.2%. January’s reading slipped from December’s revised figure of 78.4% to 78.3%, below the long-term average of 80.0%.

While the US utilisation rate’s correlation with the US jobless rate is solid, it is not as high as the comparable correlation in Australia.

Good one month, bad the next: euro-zone output contracts in December

15 February 2023

Summary: Euro-zone industrial production down 1.1% in December, fall slightly less than expected contraction; annual growth slows from 2.8% to -1.7%; German, French 10-year yields up; expansion in three of four largest economies, not Germany.

Following a recession in 2009/2010 and the debt-crisis which flowed from it, euro-zone industrial production recovered and then reached a peak four years later in 2016. Growth rates then fluctuated for two years before beginning a steady and persistent slowdown from the start of 2018. That decline was transformed into a plunge in March and April of 2020 which then took over a year to claw back. Production levels in more-recent months have generally stagnated in trend terms.

According to the latest figures released by Eurostat, euro-zone industrial production contracted by 1.1% in December on a seasonally-adjusted and calendar-adjusted basis. The result was slightly more than the 1.2% contraction which had been generally expected but in contrast with November’s 1.4% expansion after revisions. The calendar-adjusted growth rate on an annual basis slowed from November’s revised rate of +2.8% to -1.7%.

German and French sovereign bond yields moved higher on the day. By the close of business, the German 10-year bund yield had gained 4bps to 2.46% while the French 10-year OAT yield finished 5bps higher at 2.93%.

Industrial production contracted in the euro-zone’s largest economy, Germany, but expanded in the other three of the euro-zone’s four largest economies. Germany’s production decreased by 2.1% over the month while the comparable figures for France, Spain and Italy were +1.1%, +0.7% and 1.6% respectively.

Disinflation now “less apparent” after latest US CPI figures

14 February 2023

Summary: US CPI up 0.5% in January, in line with expectations; “core” rate up 0.4%; data stickier, disinflation to date less apparent; Treasury yields rise; rate-rise expectations firm; cyclical, market-driven price rises still too high; non-energy services prices main driver, adds 0.29 ppts.

The annual rate of US inflation as measured by changes in the consumer price index (CPI) halved from nearly 3% in the period from July 2018 to February 2019. It then fluctuated in a range from 1.5% to 2.0% through 2019 before rising above 2.0% in the final months of that year. Substantially lower rates were reported from March 2020 to May 2020 and they remained below 2% until March 2021. Rates have since risen significantly.

The latest CPI figures released by the Bureau of Labor Statistics indicated seasonally-adjusted consumer prices increased by 0.5% on average in January. The result was in line with expectations but considerably higher than December’s 0.1% increase after it was revised from -0.1%. On a 12-month basis, the inflation rate slowed from 6.4% to 6.3%.

“Headline” inflation is known to be volatile and so references are often made to “core” inflation for analytical purposes. The core prices index, the index which excludes the more variable food and energy components, increased by 0.4% on a seasonally-adjusted basis for the month. The rise was in line with expectations as well as December’s increase and the annual growth rate slowed from 5.7% to 5.5%.

“While the thematics of inflation may be little changed as goods drivers slow or reverse, services inflation remains sticky, and shelter is high but poised to slow, the data is stickier than hoped and disinflation to date is less apparent than the data suggested just last month,” observed NAB economist Taylor Nugent.

US Treasury bond yields increased on the day, especially at the short end. By the close of business, the 2-year Treasury yield had jumped 8bps to 4.62%, the 10-year yield had gained 5bps to 3.75% while the 30-year yield finished 1bp higher at 3.79%.

In terms of US Fed policy, expectations of higher federal funds rates over the next 12 months firmed, especially regarding the second half of 2023. At the close of business, contracts implied the effective federal funds rate would average 4.66% in March, 8bps higher than the current spot rate, and then climb to an average of 4.845% in April. May futures contracts implied a 5.035% average effective federal funds rate while December contracts implied 5.13%.

“Cyclical and market-driven price rises remain too high. For example, transportation services, 5.8% of the index, rose 0.9%,” said ANZ economist Kishti Sen.

The largest influence on headline results is often the change in fuel prices. Prices of “Energy commodities”, the segment which contains vehicle fuels, increased by 1.9% and contributed 0.07 percentage points to the total. However, prices of non-energy services, the segment which includes actual and implied rents, had the largest effect on the total, adding 0.29 percentage points after increasing by 0.5% on average.

“Substantial” rate rises expected; Westpac-MI index down in Feb

14 February 2023

Summary: Household sentiment deteriorates in February; cost of living pressures, interest rate rises “weigh heavily”; consumers expect “substantial” rate rises; all sub-indices lower; more respondents expecting higher jobless rate.

After a lengthy divergence between measures of consumer sentiment and business confidence in Australia which began in 2014, confidence readings of the two sectors converged again in mid-July 2018. Both measures then deteriorated gradually in trend terms, with consumer confidence leading the way. Household sentiment fell off a cliff in April 2020 but, after a few months of to-ing and fro-ing, it then staged a full recovery. However, consumer sentiment has deteriorated significantly over the past year, while business sentiment has been more robust.

According to the latest Westpac-Melbourne Institute survey conducted in the second week of February, household sentiment has resumed deteriorating. Their Consumer Sentiment Index fell from January’s reading of 84.3 to 78.5, a reading which is well below the “normal” range and significantly lower than the long-term average reading of just over 101.

“Cost of living pressures and interest rate rises continue to weigh heavily,” said Westpac senior economist Matthew Hassan. “Hopes of some easing in both have been dashed by the strong December quarter CPI and the RBA’s resumption of its interest rate tightening cycle.”

Any reading of the Consumer Sentiment Index below 100 indicates the number of consumers who are pessimistic is greater than the number of consumers who are optimistic.

Commonwealth Government bond yields moved lower on the day. By the close of business, the 3-year ACGB yield had slipped 1bp to 3.47%, the 10-year yield had lost 2bps to 3.75% while the 20-year yield finished 3bps lower at 4.08%.

In the cash futures market, expectations regarding future rate rises over the next few months softened a little. At the end of the day, contracts implied the cash rate would rise from the current rate of 3.32% to average 3.495% in March and then increase to an average of 3.895% in May. August contracts implied a 4.11% average cash while November contracts implied 4.095%.

Hassan noted it was not just the most recent rate rise which had depressed sentiment. “Given that the move was widely anticipated, the negative response likely reflects the clear signal from the RBA Governor that further increases can be expected in the months ahead. Certainly, more consumers now expect substantial follow-on rate rises.”

All five sub-indices registered lower readings, with the “Time to buy a major household item” sub-index posting the largest monthly percentage loss.

The Unemployment Expectations index, formerly a useful guide to RBA rate changes, rose from 108.0 to 119.4. Higher readings result from more respondents expecting a higher unemployment rate in the year ahead.

Business slowdown talk “premature”; NAB business indicators up in January

14 February 2023

Summary: Business conditions improve in January; confidence also improves; trading conditions, profitability, employment sub-indices all stronger, well above average; talk of slowdown possibly “premature”; demand “elevated”, supported by strong population growth, easing concerns regarding global growth prospects; capacity utilisation rate higher, remains elevated.

NAB’s business survey indicated Australian business conditions were robust in the first half of 2018, with a cyclical-peak reached in April of that year. Readings from NAB’s index then began to slip and forecasts of a slowdown in the domestic economy began to emerge in the first half of 2019 as the index trended lower. It hit a nadir in April 2020 as pandemic restrictions were introduced but then conditions improved markedly over the next twelve months. Subsequent readings were generally in a historically-normal range until the second half of 2022.

According to NAB’s latest monthly business survey of over 400 firms conducted in last few days of January, business conditions have improved after deteriorating in the previous three months. NAB’s conditions index registered 18 points, up 5 points from December’s revised reading.

Similarly, business confidence also improved. NAB’s confidence index increased from December’s revised reading of 0 points to 6 points, in line with the long-term average. Typically, NAB’s confidence index leads the conditions index by one month, although some divergences have appeared from time to time.

“The rise was led by very strong trading conditions in the month but both profitability and employment are also well above average,” said NAB senior economist Brodey Viney.

Commonwealth Government bond yields moved lower on the day. By the close of business, the 3-year ACGB yield had slipped 1bp to 3.47%, the 10-year yield had lost 2bps to 3.75% while the 20-year yield finished 3bps lower at 4.08%.

In the cash futures market, expectations regarding future rate rises over the next few months softened a little. At the end of the day, contracts implied the cash rate would rise from the current rate of 3.32% to average 3.495% in March and then increase to an average of 3.895% in May. August contracts implied a 4.11% average cash while November contracts implied 4.095%.

”Talk of a slowdown in the business sector may have been a little premature,” said ANZ economist Madeline Dunk. “Some of the improvement in today’s numbers could reflect a correction from last month’s report, where many of the survey’s indicators recorded annual lows.”

“Overall, the survey suggests the economy has remained resilient to headwinds from inflation and higher interest rates,” Viney added. “Demand has remained elevated, likely supported by strong population growth, and concerns about global growth prospects appear to have eased.”

NAB’s measure of national capacity utilisation remained at a historically-elevated level as it increased from December’s revised figure of 83.8% to 85.7%. All eight sectors of the economy were reported to be operating above their respective long-run averages.

Capacity utilisation is generally accepted as an indicator of future investment expenditure and it also has a strong inverse relationship with the unemployment rate.

Click for more news