News

US household sentiment improves for third consecutive month

10 February 2023

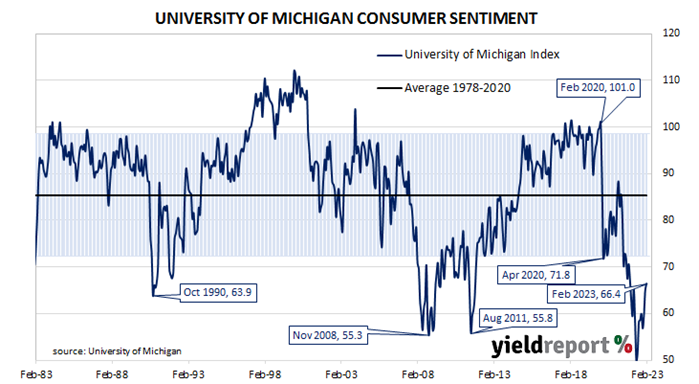
Summary: University of Michigan consumer confidence index improves again, above expectations; views of present conditions improve, future conditions deteriorates; high prices continue to weigh on consumers; helped by higher stock prices.

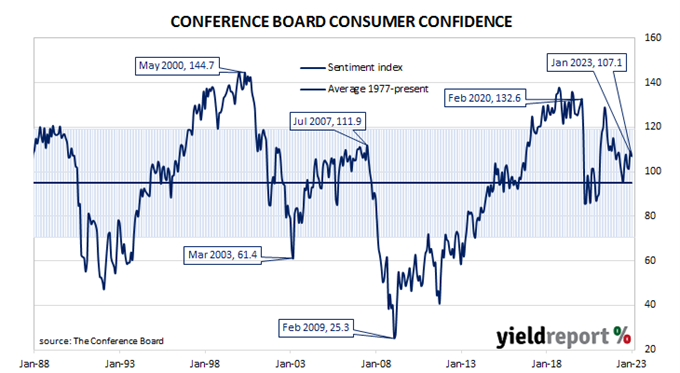
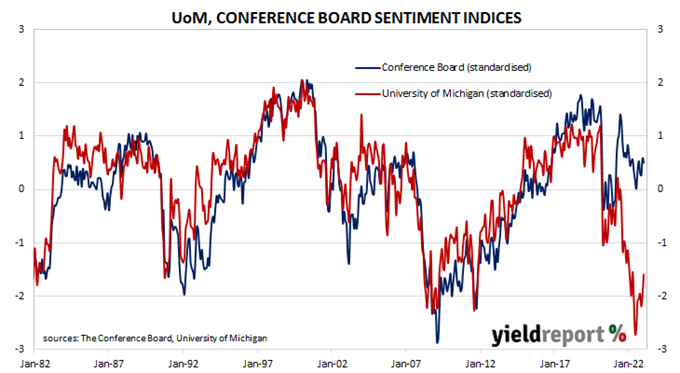
US consumer confidence started 2020 at an elevated level but, after a few months, surveys began to reflect a growing unease with the global spread of COVID-19 and its reach into the US. Household confidence plunged in April 2020 and then recovered in a haphazard fashion, generally fluctuating at below-average levels according to the University of Michigan. The University’s measure of confidence had recovered back to the long-term average by April 2021 but then it plunged again in the September quarter and has since remained at historically low levels.

The latest survey conducted by the University indicates confidence among US households has improved on average for a third consecutive month, albeit to a still-depressed level. The preliminary reading of the Index of Consumer Sentiment registered 66.4 in February, slightly above the generally expected figure of 65.0 as well as January’s final figure of 64.9. Consumers’ views of current conditions improved while their views of future conditions deteriorated in comparison to those held at the time of the January survey.

“Overall, high prices continue to weigh on consumers despite the recent moderation in inflation, and sentiment remains more than 22% below its historical average since 1978,” said the University’s Surveys of Consumers Director Joanne Hsu.

US Treasury bond yields rose on the day, especially at the long end. By the close of business, the 2-year Treasury yield had added 2bps to 4.51%, the 10-year yield had gained 8bps to 3.74% while the 30-year yield finished 9bps higher at 3.82%.

In terms of US Fed policy, expectations of higher federal funds rates over the next 12 months firmed. At the close of business, contracts implied the effective federal funds rate would average 4.655% in March, 8bps higher than the current spot rate, and then climb to an average of 4.84% in April. May futures contracts implied a 5.025% average effective federal funds rate while December contracts implied 4.975%.

“The improvement was in the current conditions index, up to 72.6 from 68.4, helped by higher stock prices, while the outlook eased to 62.3 from 62.7,” noted NAB economist Taylor Nugent.”

It was once thought less-confident households are generally inclined to spend less and save more; some decline in household spending could be expected to follow. However, recent research suggests the correlation between household confidence and retail spending is quite weak.

Melbourne Institute inflation measure jumps in January

06 February 2023

Summary: Melbourne Institute Inflation Gauge index up 0.9% in January; up 6.4% on annual basis.

The Melbourne Institute’s Inflation Gauge is an attempt to replicate the ABS consumer price index (CPI) on a monthly basis. It has turned out to be a reliable leading indicator of the CPI, although there are periods in which the Inflation Gauge and the CPI have diverged for as long as twelve months. On average, the Inflation Gauge’s annual rate tends to overestimate the ABS rate by around 0.1%, at least until recently.

The Melbourne Institute’s latest reading of its Inflation Gauge index indicates consumer prices increased by 0.9% in January, following increases of 0.2% and 1.0% in December and November respectively. The index rose by 6.4% on an annual basis, up from December’s figure of 5.9%.

Commonwealth Government bond yields increased noticeably on the day following large movements in US Treasury yields on Friday night. By the close of business, the 3-year ACGB yield had gained 9bps to 3.10%, the 10-year yield had added 8bps to 3.47% while the 20-year yield finished 5bps higher at 3.87%.

In the cash futures market, expectations regarding future rate rises also hardly changed. Contracts implied the cash rate would rise from the current rate of 3.07% to average 3.25% in February and then increase to an average of 3.62% in May. August contracts implied a 3.72% average cash rate while November contracts implied 3.655%.

Central bankers desire a certain level of inflation which is “sufficiently low that it does not materially distort economic decisions in the community” but high enough so it does not constrain “a central bank’s ability to combat recessions.”

Market reassesses likely Fed policy after January NFP figures

03 February 2023

Summary: Non-farm payrolls up 517,000 in January, much greater than expected; previous two months’ figures revised up by 71,000; jobless rate declines to 3.4%, participation rate up; gains “broad-based”; investors reassess Fed expectations; employed-to-population ratio up; underutilisation rate up from 6.5% to 6.6%; annual hourly pay growth down from 4.8% to 4.4%.

The US economy ceased producing jobs in net terms as infection controls began to be implemented in March 2020. The unemployment rate had been around 3.5% but that changed as job losses began to surge through March and April of 2020. The May 2020 non-farm employment report represented a turning point and subsequent months provided substantial employment gains. Changes in recent months have been generally more modest but still above the average of the last decade.

According to the US Bureau of Labor Statistics, the US economy created an additional 517,000 jobs in the non-farm sector in January. The increase was much greater than the 175,000 which had been generally expected and double the 260,000 jobs which had been added in December after revisions. Employment figures for November and December were revised up by a total of 71,000.

The total number of unemployed declined by 28,000 to 5.694 million while the total number of people who were either employed or looking for work increased by 866,000 to 165.832 million. These changes led to the US unemployment rate declining from December’s revised figure of 3.5% to 3.4% as the participation rate ticked up from 62.3% to 62.4%.

“Employment gains were broad-based, with gains in leisure and hospitality up a strong 128,000,” said ANZ senior economist Felicity Emmett.”

US Treasury yields rose noticeably on the day, especially at the short end. By the close of business, the 2-year yield had gained 20bps to 4.30%, the 10-year yield had added 12bps to 3.52% while the 30-year yield finished 7bps higher at 3.62%.

In terms of US Fed policy, expectations of higher federal funds rates over the next 12 months hardened. At the close of business, contracts implied the effective federal funds rate would average 4.65% in March, 7bps higher than the current spot rate, and then climb to an average of 4.815% in April. May futures contracts implied a 4.96% average effective federal funds rate while December contracts implied 4.695%.

“Investors have been forced to rethink their Fed expectations following Friday’s data releases which were much stronger than expected and suggestive that the US economy maintained solid momentum into the start of 2023,” said NAB Head of Markets Strategy Skye Masters.

One figure which is indicative of the “spare capacity” of the US employment market is the employment-to-population ratio. This ratio is simply the number of people in work divided by the total US population. It hit a cyclical-low of 58.2 in October 2010 before slowly recovering to just above 61% in late-2019. January’s reading ticked up from 60.1% to 60.2%, still some way from the April 2000 peak reading of 64.7%.

Apart from the unemployment rate, another measure of tightness in the labour market is the underutilisation rate and the latest reading of it registered 6.6%, up from 6.5% in December. Wage inflation and the underutilisation rate usually have an inverse relationship; hourly pay growth in the year to January slowed from 4.8% after revisions to 4.4%.

“Moderation in wage growth is encouraging for the Fed, but the numbers could be biased by strong growth in leisure and hospitality jobs, which are lower paid than average,” Steven noted.

Big jump in apartment approvals behind December rise

02 February 2023

Summary: Home approval numbers up 18.5% in December, above expectations; 3.8% lower than December 2021; ANZ: still on downward trend; house approvals down 2.4%, apartments up 58.8%; non-residential approvals down 1.7% in dollar terms, residential alterations down 3.0%.

Building approvals for dwellings, that is apartments and houses, headed south after mid-2018. As an indicator of investor confidence, falling approvals had presented a worrying signal, not just for the building sector but for the overall economy. However, approval figures from late-2019 and the early months of 2020 painted a picture of a recovery taking place, even as late as April of that year. Subsequent months’ figures then trended sharply upwards before falling back in 2021 and 2022.

The Australian Bureau of Statistics has released the latest figures from December which show total residential approvals rose by 18.5% on a seasonally-adjusted basis. The increase was considerably more than the 1.0% rise which had been generally expected and it contrasted with November’s -8.8%. However, total approvals still fell by 3.8% on an annual basis, up from the previous month’s figure of -14.1%. Monthly growth rates are often volatile.

“So, despite the strong monthly result, we still think approvals are likely on a downward trend,” ANZ senior economist Adelaide Timbrell. “While Australia’s strong expected net migration through this year will limit the total decline in building approvals, falling home prices and rising rates will reduce appetite for new dwelling developments.”

Commonwealth Government bond yields fell moderately on the day with the exception of ultra-long yields which did not move. By the close of business, the 3-year ACGB yield had lost 6bps to 3.15%, the 10-year yield had shed 3bps to 3.55% while the 20-year yield finished unchanged at 3.96%.

In the cash futures market, expectations regarding future rate rises firmed a touch. At the end of the day, contracts implied the cash rate would rise from the current rate of 3.06% to average 3.24% in February and then increase to an average of 3.41% in March. May 2023 contracts implied a 3.63% average cash rate while August 2023 contracts implied 3.72%.

Approvals for new houses fell by 2.4% over the month, the same percentage fall as in November. On a 12-month basis, house approvals were 12.2% lower than they were in December 2021, up from November’s comparable figure of -12.8%.

Apartment approval figures are usually a lot more volatile and December’s total jumped by 58.8% after a 19.1% fall in November. The 12-month growth rate rose from November’s revised rate of -16.5% to 8.7%.

Non-residential approvals declined by 1.7% in dollar terms over the month but were still 16.3% higher on an annual basis. Figures in this segment also tend to be rather volatile.

Residential alteration approvals decreased by 3.0% in dollar terms over the month but were 0.3% higher than in December 2021.

US quit rate steady in December; job openings jump

01 February 2023

Summary: US quit rate steady at 2.7% in December; elevated quit rate a message US labour market “very tight”: US yields down, expectations of higher rates soften; quits down, openings and separations both up; ratio of job openings to unemployed increases to 1.9.

The number of US employees who quit their jobs as a percentage of total employment increased slowly but steadily after the GFC. It peaked in March 2019 and then tracked sideways until virus containment measures were introduced in March 2020. The quit rate then plummeted as alternative employment opportunities rapidly dried up. Following the easing of US pandemic restrictions, it proceeded to recover back to its pre-pandemic rate in the third quarter of 2020 and trended higher through 2021 before easing through 2022.

Figures released as part of the latest Job Openings and Labor Turnover Survey (JOLTS) report show the quit rate remained steady in December. 2.7% of the non-farm workforce left their jobs voluntarily, the same rate after rounding as in November, even as quits in the month declined by 15,000 and an additional 223,000 people were employed in non-farm sectors.

“The quit rate staying elevated at 2.7% sends a similar message as openings that the labour market continues to be very tight,” said Citi analyst Gisela Hoxha.

The figures were published on the same day as several other reports as well as a 25bps increase to the federal funds target range. US Treasury yields moved considerably lower and, by the close of business, 2-year and 10-year Treasury bond yields had both shed 9bps to 4.12% and 3.42% respectively while the 30-year yield finished 7bps lower at 3.57%.

In terms of US Fed policy, expectations of higher federal funds rates over the next 12 months softened. At the close of business, contracts implied the effective federal funds rate would average 4.57% in February, 24bps higher than the current spot rate, and then climb to an average of 4.64% in March. May futures contracts implied a 4.88% average effective federal funds rate while December contracts implied 4.48%.

The decline in total quits was led by 69,000 fewer resignations in the “Transportation, warehousing and utilities” sector while the “Other services” sector experienced the largest gain, increasing by 65,000. Overall, the total number of quits for the month fell from November’s revised figure of 4.102 million to 4.087 million.

Total vacancies at the end of December increased by 0.572 million, or 5.5%, from November’s revised figure of 10.440 million to 11.012 million. The rise was driven by a 409,000 increase in the “Accommodation and food services” sector while the “Information” sector experienced the single largest decrease, falling by 107,000. Overall, 11 out of 18 sectors experienced more job openings than in the previous month.  

Total separations increased by 59,000, or 1.0%, from November’s revised figure of 5.831 million to 5.890 million. The rise was led by the “Retail trade” sector where there were 63,000 more separations than in November. Separations increased in 10 of the 18 sectors.

“While still well below the 11.86 million March 2022 peak, the ratio of job openings to unemployed rose from 1.7 to 1.9, a figure the Fed chair has previously indicated he would like to see closer to 1,” said NAB’s Head of FX Strategy (Markets) Ray Attrill.

The “quit” rate time series produced by the JOLTS report is a leading indicator of US hourly pay. As wages account for around 55% of a product’s or service’s price in the US, wage inflation and overall inflation rates tend to be closely related. Former Federal Reserve chief and current Treasury Secretary Janet Yellen was known to pay close attention to it.

Contraction territory: ISM PMI slides again in January

01 February 2023

Summary: ISM PMI down, at 47.4% in January, below expectations; Citi: should not extrapolate weakness to broader US economy; US yields down, expectations of higher rates soften; ISM: reading corresponds to 0.5% US GDP contraction annualised.

The Institute of Supply Management (ISM) manufacturing Purchasing Managers Index (PMI) reached a cyclical peak in September 2017. It then started a downtrend which ended in March 2020 with a contraction in US manufacturing which lasted until June 2020. Subsequent month’s readings implied growth had resumed, with the index becoming stronger through to March 2021. Since then, readings have declined steadily.

According to the ISM’s January survey, its PMI recorded a reading of 47.4%, below the generally expected figure of 48.0% as well as December’s revised figure of 48.4. The average reading since 1948 is 53.0% and any reading below 50% implies a contraction in the US manufacturing sector relative to the previous month.

“While ISM and S&P PMIs will be worth following closely in the coming months to get a sense of how manufacturing activity evolves, we would still caution against extrapolating this weakness to the broader economy,” said Citi analyst Gisela Hoxha.

The figures were published on the same day as several other reports as well as a 25bps increase to the federal funds target range. US Treasury yields moved considerably lower and, by the close of business, 2-year and 10-year Treasury bond yields had both shed 9bps to 4.12% and 3.42% respectively while the 30-year yield finished 7bps lower at 3.57%.

In terms of US Fed policy, expectations of higher federal funds rates over the next 12 months softened. At the close of business, contracts implied the effective federal funds rate would average 4.57% in February, 24bps higher than the current spot rate, and then climb to an average of 4.64% in March. May futures contracts implied a 4.88% average effective federal funds rate while December contracts implied 4.48%.

Purchasing managers’ indices (PMIs) are economic indicators derived from monthly surveys of executives in private-sector companies. They are diffusion indices, which means a reading of 50% represents no change from the previous period, while a reading under 50% implies respondents reported a deterioration on average. A reading “above 48.7%, over a period of time, generally indicates an expansion of the overall economy” according to the ISM.

The ISM’s manufacturing PMI figures appear to lead US GDP by several months despite a considerable error in any given month. The chart below shows US GDP on a “year on year” basis (and not the BEA annualised basis) against US GDP implied by monthly PMI figures. 

According to the ISM and its analysis of past relationships between the PMI and US GDP, January’s PMI corresponds to an annualised contraction rate of 0.5%, or -0.1% over a quarter. Regression analysis on a year-on-year basis suggests a 12-month GDP growth rate of 1.8% five months after this latest report.

The ISM index is one of two monthly US PMIs, the other being an index published by S&P Global. S&P Global produces a “flash” estimate in the last week of each month which comes out about a week before the ISM index is published. The S&P Global flash January manufacturing PMI registered 46.8%, 0.6 percentage points higher than December’s final figure.

Conf. Board confidence index slips on job concerns, broader economy

31 January 2023

Summary: Conference Board Consumer Confidence Index falls in January, reading less than expected; contrasts with recent UoM survey; views of present conditions improve, short-term outlook deteriorates; Expectations Index decline due to jobs, broader US economy.

US consumer confidence clawed its way back to neutral over the five years after the GFC in 2008/2009 and then went from strength to strength until late 2018. Measures of consumer confidence then oscillated within a relatively narrow band at historically high levels until they plunged in early 2020. Subsequent readings then fluctuated around the long-term average until March 2021 when they reached elevated levels. However, a noticeable gap has since emerged between the two most-widely followed surveys.

The latest Conference Board survey held during the first three weeks of January indicated US consumer confidence has deteriorated slightly. January’s Consumer Confidence Index registered 107.9 on a preliminary basis, lower than the expected figure of 109.0 and down from December’s final figure of 109.0.

NAB Head of Markets Strategy Skye Masters said, “This result contrasts to the lift recently seen in the University of Michigan measure but is likely to reflect concerns around the labour market given recent company layoff announcements…”

US Treasury yields generally finished the day lower with the exception of ultra-long yields which moved noticeably higher. By the close of business, the 2-year Treasury bond yield had lost 3bps to 4.21%, the 10-year yield had shed 3bps to 3.51% while the 30-year yield finished 13bps higher at 3.64%.

In terms of US Fed policy, expectations of higher federal funds rates over the next 12 months softened. At the close of business, contracts implied the effective federal funds rate would average 4.58% in February, 25bps higher than the current spot rate, and then climb to an average of 4.65% in March. May futures contracts implied a 4.89% average effective federal funds rate while December contracts implied 4.555%.

Consumers’ views of present conditions improved while their views of the near-future deteriorated. The Present Situation Index increased from December’s revised figure of 147.4 to 150.9 while the Expectations Index declined from a revised figure of 83.4 to 77.8.

Ataman Ozyildirim, a senior director of economics at The Conference Board, said the decline in the Expectations Index was due to jobs and the broader US economy. “Consumers were less upbeat about the short-term outlook for jobs. They also expect business conditions to worsen in the near term.” However, he also noted “consumers expect their incomes to remain relatively stable in the months ahead.”

The Consumer Confidence Survey is one of two widely followed monthly US consumer sentiment surveys which produce sentiment indices. The Conference Board’s index is based on perceptions of current business and employment conditions, as well as respondents’ expectations of conditions six months in the future. The other survey, conducted by the University of Michigan, is similar and it is used to produce an Index of Consumer Sentiment. That survey differs in that it does not ask respondents explicitly about their views of the labour market and it also includes some longer-term questions.

Households reduce discretionary spending; December retail figures slump

31 January 2023

Summary: Retail sales down 3.9% in December; fall considerably greater one than expected; figures affected by Black Friday/Cyber week sales; suggests reduced discretionary spending by households; largest influence on result from household goods.

Growth figures of domestic retail sales spent most of the 2010s at levels below the post-1992 average. While economic conditions had been generally favourable, wage growth and inflation rates were low. Expenditures on goods then jumped in the early stages of 2020 as government restrictions severely altered households’ spending habits. Households mostly reverted to their usual patterns as restrictions eased in the latter part of 2020 and throughout 2021, although not for all categories.

According to the latest ABS figures, total retail sales slumped by 3.9% in December on a seasonally adjusted basis. The fall was a considerably greater one than the 0.2% decline which had been generally expected and in contrast with November’s revised figure of +1.7%. However, sales still increased by 7.5% on an annual basis, down from November’s comparable figure of 7.7%.

“Some of this looks to be volatility around the Black Friday/Cyber week sales, complicated by seasonal adjustment difficulties,” said Westpac senior economist Matthew Hassan. “November’s 1.4% gain was marked up to 1.7% and there was a similar choppy profile around November-December in 2021.”

Shorter-term Commonwealth Government bond yields moved a touch lower on the day while longer-term yields moved modestly higher. By the close of business, the 3-year ACGB yield had slipped 1bp to 3.19%, the 10-year yield had added 2bps to 3.56% while the 20-year  yield finished 3bps higher at 3.95%.

In the cash futures market, expectations regarding future rate rises softened slightly. At the end of the day, contracts implied the cash rate would rise from the current rate of 3.07% to average 3.24% in February and then increase to an average of 3.65% in May. August 2023 contracts implied a 3.75% average cash rate while November 2023 contracts implied 3.72%.

“Although strong Black Friday sales and a shift to travel spending in late 2022 put downward pressure on December retail sales, the extent of the fall suggests households have started to cut back on discretionary spending,” said ANZ economist Madeline Dunk. “We expect consumption growth to slow through 2023 as a result of higher interest rates and the recent decline in real wages due to very strong inflation.”

Retail sales are typically segmented into six categories (see below), with the “food” segment accounting for nearly 40% of total sales. However, the largest influence on the month’s total came from the household goods category where sales decreased by 7.8% on average over the month and accounted for -1.40 percentage points of the net result.

December lending growth figures: further confirmation of slowdown

31 January 2023

Summary: Private sector credit up 0.6% in December, in line with expectations; annual growth rate up from 9.4% to 9.5%; new lending for housing now declining; business loans account for 50% of net growth.

The pace of lending to the non-bank private sector by financial institutions in Australia followed a steady-but-gradual downtrend from late-2015 through to early 2020 before hitting what appears to be a nadir in March 2021. That downtrend ended later in the same year and annual growth rates are above the peak seen in the previous decade.

According to the latest RBA figures, private sector credit increased by 0.3% in December. The result was less than the 0.5% increase which had been generally expected as well as November’s 0.5% rise. On an annual basis, the growth rate slowed from 8.9% to 8.3%.

“The December private sector credit update provided further confirmation of the well-established slowdown in credit growth,” said Westpac economist Ryan Wells. “The interest-rate-sensitive housing sector continues to lead the down-trend, although business credit, which expanded at a strong pace over last year, is also easing notably.”

Shorter-term Commonwealth Government bond yields moved a touch lower on the day while longer-term yields moved modestly higher. By the close of business, the 3-year ACGB yield had slipped 1bp to 3.19%, the 10-year yield had added 2bps to 3.56% while the 20-year  yield finished 3bps higher at 3.95%.

In the cash futures market, expectations regarding future rate rises softened slightly. At the end of the day, contracts implied the cash rate would rise from the current rate of 3.07% to average 3.24% in February and then increase to an average of 3.65% in May. August 2023 contracts implied a 3.75% average cash rate while November 2023 contracts implied 3.72%.

“We downgraded our credit growth forecasts, reflecting a decline in risk appetite as a result of weaker expectations of economic growth, inflation and rising interest rates,” said ANZ senior economist Adelaide Timbrell. “We expect total credit growth to slow from 9.0% year-on-year in Q4 2022 to 4.3% year-on-year in Q4 2023.”

Owner-occupier lending accounted for just under 50% of the net growth over the month. Business lending accounted for a little over a third and investor lending accounted for a little under 20%. Personal lending contracted a touch.

The traditional driver of overall loan growth, the owner-occupier segment, grew by 0.4% over the month, the same growth rate as in November. The sector’s 12-month growth rate slowed again, this time from 7.3% to 6.9%.

Total lending in the business sector increased by 0.3%, down from the 0.7% increase recorded in November. Growth on an annual basis slowed from 14.0% to 12.9%.

Monthly growth in the investor-lending segment slowed to a near-halt in early 2018 and essentially stayed that way until mid-2021. In December, net lending grew by 0.3%, the same rate as in November, October and September. The 12-month growth rate slowed from 5.9% to 5.5%.                            

Total personal loans contracted by 0.5%, in contrast to November’s +0.1%, taking the annual contraction rate from 0.2% to 0.1%. This category of debt includes fixed-term loans for large personal expenditures, credit cards and other revolving credit facilities.

Euro-zone ESI up for third consecutive month

30 January 2023

Summary: Euro-zone composite sentiment index up in January, above expectations; readings up in four of five sectors; up in all four largest euro-zone economies; German, French 10-year yields noticeably higher; index implies annual GDP growth rate of 1.5%.

The European Commission’s Economic Sentiment Indicator (ESI) is a composite index comprising five differently weighted sectoral confidence indicators.  It is heavily weighted towards confidence surveys from the business sector, with the consumer confidence sub-index only accounting for 20% of the ESI. However, it has a good relationship with euro-zone GDP, although not necessarily as a leading indicator.

The ESI posted a reading of 99.9 in January, above the consensus expectation of 97.0 as well as December’s revised reading of 97.1. The increase marked a third consecutive month of gains for the index, raising it back to the long-term average. The average reading since 1985 is just under 100.

German and French 10-year bond yields finished the day noticeably higher, boosted by Spanish inflation figures which were also higher than expected. By the close of business, the German 10-year bund yield had gained 9bps to 2.31% while the French 10-year OAT yield had added 8bps to 2.77%.

Confidence improved in four of the five sectors of the economy, with the construction sector the only  one to experience a deterioration. On a geographical basis, the ESI increased in all four of the euro-zone’s largest economies.

End-of-quarter ESI readings and annual euro-zone GDP growth rates are highly correlated. This latest reading corresponds to a year-to-January GDP growth rate of 1.5%, up from December’s implied growth rate of 0.8%.

Click for more news