News

US Fed’s favourite inflation measure slows on annual basis; “not broad-based”

27 January 2023

Summary: US core PCE price index up 0.3% in December, in line with expectations; annual rate slows from 4.7% to 4.4%; “all” in goods sector, “not broad-based”; Treasury yields mostly higher; Fed rate-rise expectations largely unchanged.

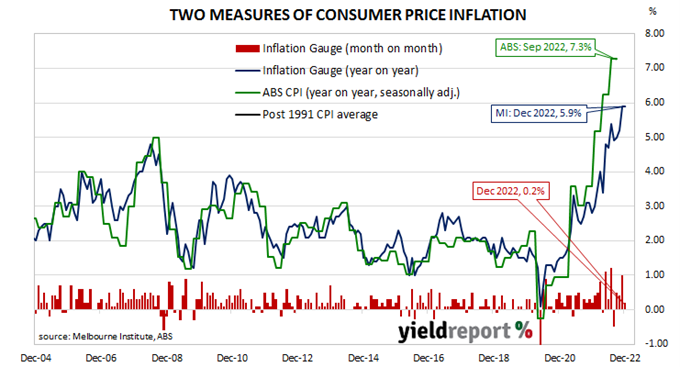
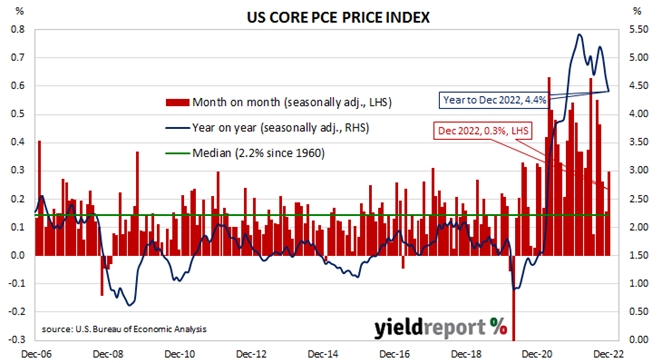
One of the US Fed’s favoured measures of inflation is the change in the core personal consumption expenditures (PCE) price index. After hitting the Fed’s target at the time of 2.0% in mid-2018, the annual rate then hovered in a range between 1.8% and 2.0% before it eased back to a range between 1.5% and 1.8% through 2019. It then plummeted below 1.0% in April 2020 before rising back to around 1.5% in the September quarter of that year. It has since increased significantly above the Fed’s target.

The latest figures have now been published by the Bureau of Economic Analysis as part of the December personal income and expenditures report. Core PCE prices rose by 0.3% over the month, in line with expectations but slightly higher than November’s 0.2%. On a 12-month basis, the core PCE inflation rate slowed from November’s revised rate of 4.7% to 4.4%.

“The fall in core inflation is all in the goods sector, not broad-based,” said ANZ economist  Gregorius Steven.

US Treasury bond yields increased modestly on the day with the exception of those at the ultra-long end. By the close of business, the 2-year Treasury bond yield had inched up 1bp to 4.19%, the 10-year yield had added 2bps to 3.51% while the 30-year yield finished 2bps lower at 3.62%.

In terms of US Fed policy, expectations of higher federal funds rates over the next 12 months remained largely unchanged overall. At the close of business, contracts implied the effective federal funds rate would average 4.575% in February, 25bps higher than the current spot rate, and then climb to an average of 4.645% in March. May futures contracts implied a 4.885% average effective federal funds rate while December contracts implied 4.545%.

The core version of PCE strips out energy and food components, which are volatile from month to month, in an attempt to identify the prevailing trend. It is not the only measure of inflation used by the Fed; the Fed also tracks the Consumer Price Index (CPI) and the Producer Price Index (PPI) from the Department of Labor. However, it is the one measure which is most often referred to in FOMC minutes.

Consumers main engine of US growth in Dec quarter

26 January 2023

Summary: US GDP up 0.7% (2.9% annualised) in December quarter, above expectations; consumer spending main engine of growth but momentum slows; GDP price deflator rate falls from 7.1% to 6.3%.

US GDP growth slowed in the second quarter of 2019 before stabilising at about 0.5% per quarter.  At the same time, US bond yields suggested future growth rates would be below trend. The US Fed agreed and it reduced its federal funds range three times in the second half of 2019. Pandemic restrictions in the June quarter of 2020 sent parts of the US economy into hibernation; the lifting of those same restrictions sparked a rapid recovery which lasted until 2022.

The US Bureau of Economic Analysis has now released the December quarter’s “advance” GDP estimates and they indicate the US economy expanded by 0.7% or at an annualised rate of 2.9%. The increase was slightly more than the 0.6% increase (2.6% annualised) which had been generally expected but slightly less than the September quarter’s 0.8% after revisions.

“Consumer spending was the main engine of growth, although [it] continued to show slower momentum [while] residential investment remained in a deep hole and business investment remained sluggish,” said NAB economist Tapas Strickland.

US GDP numbers are published in a manner which is different to most other countries; quarterly figures are compounded to give an annualised figure. In countries such as Australia and the UK, an annual figure is calculated by taking the latest number and comparing it with the figure from the same period in the previous year. The diagram above shows US GDP once it has been expressed in the normal manner, as well as the annualised figure.

US Treasury bond yields rose on the day. By the close of business, the 2-year Treasury bond yield had gained 6bps to 4.18%, the 10-year yield had added 4bps to 3.49% while the 30-year yield finished 5bps higher at 3.64%.

In terms of US Fed policy, expectations of higher federal funds rates over the next 12 months firmed slightly. At the close of business, contracts implied the effective federal funds rate would average 4.58% in February, 25bps higher than the current spot rate, and then climb to an average of 4.65% in March. May futures contracts implied a 4.89% average effective federal funds rate while December contracts implied 4.52%.

One part of the report which is often overlooked are the figures regarding the GDP price deflator, which is another measure of inflation. The GDP price deflator is restricted to new, domestically-produced goods and services and it is not based on a fixed basket as is the case for the consumer price index (CPI). The annual rate fell from the September quarter’s figure of 7.1% to 6.3%.

Westpac-MI leading index stuck in negative territory

25 January 2023

Summary: Leading index growth rate down a touch in December; points to below-trend growth in first half of 2023; reading implies annual GDP growth of around 1.75%; ACGB yields higher; rate-rise expectations firm; consumer sector to be main driver of any upcoming slowdown.

Westpac and the Melbourne Institute describe their Leading Index as a composite measure which attempts to estimate the likely pace of Australian economic growth in the short-term. After reaching a peak in early 2018, the index trended lower through 2018 and 2019 before plunging to recessionary levels in the second quarter of 2020. Subsequent readings spiked towards the end of 2020 but then trended lower through 2021 and 2022.

The December reading of the six month annualised growth rate of the indicator registered -0.97%, down a touch from November’s figure of -0.97% after it was revised from -0.92%.

“The Index continues to point to below-trend growth in the first half of 2023,” said Westpac Chief Economist Bill Evans. “Westpac concurs with that view although we expect the slowdown in the Australian economy in 2023 to be more apparent in the second half of the year when growth is forecast to stagnate after running at a 2% annual pace in the first half.”

Index figures represent rates relative to “trend” GDP growth, which is generally thought to be around 2.75% per annum in Australia. The index is said to lead GDP by “three to nine months into the future” but the highest correlation between the index and actual GDP figures occurs with a three-month lead. The current reading thus represents an annual GDP growth rate of around 1.75%.

This latest reading came out on the same day as the December quarter’s CPI report and domestic Treasury bond yields moved higher on the day despite moderate falls of US Treasury yields overnight. By the close of business, the 3-year ACGB yield had gained 9bps to 3.15%, the 10-year yield had added 4bps to 3.51% while the 20-year yield finished 2bps higher at 3.89%.

In the cash futures market, expectations regarding future rate rises firmed. At the end of the day, contracts implied the cash rate would rise from the current rate of 3.07% to average 3.24% in February and then increase to an average of 3.625% in May. August contracts implied a 3.74% average cash while November contracts implied 3.72%.

Evans expects consumer spending to be the main driver of any upcoming slowdown “as elevated interest rates and negative real wages growth take their toll on spending.” However, he also expects households which built up their savings during the pandemic to be somewhat insulated.

Current activity “healthy” but momentum slows in NAB’s December business report

24 January 2023

Summary: Business conditions deteriorate in December; confidence improves but still negative; confidence index up but still below zero; healthy level of current activity but with slowing momentum; ANZ: “tide is turning”; capacity utilisation rate declines but still elevated.

NAB’s business survey indicated Australian business conditions were robust in the first half of 2018, with a cyclical-peak reached in April of that year. Readings from NAB’s index then began to slip and forecasts of a slowdown in the domestic economy began to emerge in the first half of 2019 as the index trended lower. It hit a nadir in April 2020 as pandemic restrictions were introduced but then conditions improved markedly over the next twelve months. Subsequent readings were generally in a historically-normal range until the second half of 2022.

According to NAB’s latest monthly business survey of over 400 firms conducted in first full week of January, business conditions have deteriorated for a third consecutive month. NAB’s conditions index registered 12 points, down 8 points from November’s reading.

In contrast, business confidence improved, albeit to a level which is still negative. NAB’s confidence index increased from November’s reading of -4 points to -1 point, 7 points below the long-term average. Typically, NAB’s confidence index leads the conditions index by one month, although some divergences have appeared from time to time.

“Overall, the survey continues to point to a healthy level of activity with above average conditions and elevated capacity utilisation,” said NAB senior economist Brodey Viney. However, he also pointed to “a slowing in momentum with most indicators pulling back over the past three months or so…”

Commonwealth Government bond yields moved a touch higher on the day. By the close of business, 3-year and 10-year ACGB yields had both inched 1bp higher to 3.06% and 3.47% respectively while the 20-year yield finished unchanged at 3.87%.

In the cash futures market, expectations regarding future rate rises over the next few months softened. At the end of the day, contracts implied the cash rate would rise from the current rate of 3.07% to average 3.20% in February and then increase to an average of 3.47% in May. August contracts implied a 3.57% average cash while November contracts implied 3.55%.

“The tide is turning in NAB’s December Business Survey, with business conditions dropping 8 points and forward orders coming off, albeit from high bases,” said ANZ economist Madeline Dunk. However, she did note “inflationary pressures are subsiding.”

NAB’s measure of national capacity utilisation remained at a historically-elevated level although it declined from November’s revised figure of 85.0% to 83.7%. All eight sectors of the economy were reported to be operating at or above their respective long-run averages.

Capacity utilisation is generally accepted as an indicator of future investment expenditure and it also has a strong inverse relationship with the unemployment rate.

US PPI drops back in December as goods prices fall

18 January 2023

Summary: US producer price index (PPI) down 0.5% in December, fall greater than expected; annual rate slows to 6.2%; “core” PPI up 0.1%; Treasury yields fall noticeably, rate-rise expectations soften; lower goods prices behind result, services prices up slightly.

Around the end of 2018, the annual inflation rate of the US producer price index (PPI) began a downtrend which continued through 2019. Months in which producer prices increased suggested the trend may have been coming to an end, only for it to continue, culminating in a plunge in April 2020. Figures returned to “normal” towards the end of that year but annual rates through 2021 and 2022 have been well above the long-term average.

The latest figures published by the Bureau of Labor Statistics indicate producer prices decreased by 0.5% after seasonal adjustments in December. The fall was a greater one than the 0.1% decline which had been generally expected and in contrast with November’s 0.2% rise after it was revised down from 0.3%. On a 12-month basis, the rate of producer price inflation after seasonal adjustments and revisions slowed from 7.3% in November to 6.2%.

Producer prices excluding foods and energy, or “core” PPI, increased by just 0.1% after seasonal adjustments. The result was in line with expectations but lower than November’s 0.2% rise and the annual rate slowed from November’s revised figure of 6.3% to 5.5%.

The figures came out the same morning as the latest industrial production numbers and retail sales figures.  US Treasury bond yields fell noticeably on the day and, by the close of business, the 2-year Treasury yield had lost 12bps to 4.09%, the 10-year yield had shed 18bps to 3.37% while the 30-year yield finished 12bps lower at 3.54%.

In terms of US Fed policy, expectations of higher federal funds rates over the next 12 months softened. At the close of business, contracts implied the effective federal funds rate would average 4.59% in February, 26bps higher than the current spot rate, and then climb to an average of 4.655% in March. May futures contracts implied a 4.855% average effective federal funds rate while December contracts implied 4.425%.  

The BLS stated lower prices for final demand good accounted for all the month’s decrease after they fell by 1.6% on average. Prices of final demand goods rose by 0.1%.

The producer price index is a measure of prices received by producers for domestically produced goods, services and construction. It is put together in a fashion similar to the consumer price index (CPI) except it measures prices received from the producer’s perspective rather than from the perspective of a retailer or a consumer. It is another one of the various measures of inflation tracked by the US Fed, along with core personal consumption expenditure (PCE) price data. 

US industrial output contracts again; “soft landing” narrative questioned

18 January 2023

Summary: US industrial output down 0.7% in December, below expectations; up 1.6% over past 12 months; pushes back on soft landing narrative; capacity utilisation rate down 0.6ppts to 78.8%, below long-term average.

The Federal Reserve’s industrial production (IP) index measures real output from manufacturing, mining, electricity and gas company facilities located in the United States. These sectors are thought to be sensitive to consumer demand and so some leading indicators of GDP use industrial production figures as a component. US production collapsed through March and April of 2020 before recovering the ground lost over the fifteen months to July 2021.

According to the Federal Reserve, US industrial production contracted by 0.7% on a seasonally adjusted basis in December. The fall was a greater one than the 0.1% decrease which had been generally expected as well as November’s -0.6% after it was revised down from -0.2%. On an annual basis the growth rate slowed from November’s revised figure of 2.2% to 1.6%.

“The decline in retail spending and industrial production adds to the theme of the economy slowing and heading into recession in 2023,” said NAB senior economist Tapas Strickland. It “pushes back on the soft landing narrative dominating markets since January,” he added.

The figures came out the same morning as the latest PPI report and retail sales figures.  US Treasury bond yields fell noticeably on the day and, by the close of business, the 2-year Treasury yield had lost 12bps to 4.09%, the 10-year yield had shed 18bps to 3.37% while the 30-year yield finished 12bps lower at 3.54%.

In terms of US Fed policy, expectations of higher federal funds rates over the next 12 months softened. At the close of business, contracts implied the effective federal funds rate would average 4.59% in February, 26bps higher than the current spot rate, and then climb to an average of 4.655% in March. May futures contracts implied a 4.855% average effective federal funds rate while December contracts implied 4.425%.  

The same report includes US capacity utilisation figures which are generally accepted as an indicator of future investment expenditure and/or inflationary pressures. Capacity usage had hit a high for the last business cycle in early 2019 before it began a downtrend which ended with April 2020’s multi-decade low of 64.2%. December’s reading fell from November’s revised figure of 79.4% to 78.8%, below the long-term average of 80.0%.

While the US utilisation rate’s correlation with the US jobless rate is solid, it is not as high as the comparable correlation in Australia.

Trend towards weakness “clear” in latest US retail report

18 January 2023

Summary: US retail sales up 1.3% in October, greater than expected; annual growth rate slows from 8.6% to 8.3%; figures “point to still-strong consumer demand”; short-term Treasury bond yields up, longer term yields down; rate rise expectations firm slightly; rises in nine of thirteen retail categories; gas station segment largest single influence on month’s result.

US retail sales had been trending up since late 2015 but, commencing in late 2018, a series of weak or negative monthly results led to a drop-off in the annual growth rate below 2.0%. Growth rates then increased in trend terms through 2019 and into early 2020 until pandemic restrictions sent it into negative territory. A “v-shaped” recovery then took place which was followed by some short-term spikes as federal stimulus payments hit US households in the first and second quarters of 2021.

According to the latest “advance” numbers released by the US Census Bureau, total retail sales decreased by 1.1% in December. The result was less than the 0.8% decrease which had been generally expected and slightly less than November’s -1.0%. On an annual basis, the growth rate remained unchanged at 6.0%.

 “The weakness may have been exaggerated by the heavy snowstorms late last month, but the trend towards weakness is clear. November sales were also revised down,” said ANZ economist Madeline Dunk.

The figures came out the same morning as the latest industrial production numbers and industrial production figures.  US Treasury bond yields fell noticeably on the day and, by the close of business, the 2-year Treasury yield had lost 12bps to 4.09%, the 10-year yield had shed 18bps to 3.37% while the 30-year yield finished 12bps lower at 3.54%.

In terms of US Fed policy, expectations of higher federal funds rates over the next 12 months softened. At the close of business, contracts implied the effective federal funds rate would average 4.59% in February, 26bps higher than the current spot rate, and then climb to an average of 4.655% in March. May futures contracts implied a 4.855% average effective federal funds rate while December contracts implied 4.425%.  

“The Fed will be pleased to see demand for goods normalising towards its pre-pandemic trend, potential weather distortions aside,“ Dunk added.

Ten of the thirteen categories recorded lower sales over the month. The “Gasoline stations” segment again provided the largest single influence on the overall result, falling by 4.6% over the month and contributing around -0.40 percentage points.

The non-store segment includes vending machine sales, door-to-door sales and mail-order sales but nowadays this segment has become dominated by online sales. It now accounts for 16% of all US retail sales and it is the second-largest segment after vehicles and parts.

Westpac-MI sentiment index up in January but “still depressingly low”

17 January 2023

Summary: Household sentiment improves in January; readings comparable with depths of early 1990s recession, “still depressingly low”; no RBA rate increase “likely explanation” for result; all sub-indices higher; fewer respondents expecting higher jobless rate.

After a lengthy divergence between measures of consumer sentiment and business confidence in Australia which began in 2014, confidence readings of the two sectors converged again in mid-July 2018. Both measures then deteriorated gradually in trend terms, with consumer confidence leading the way. Household sentiment fell off a cliff in April 2020 but, after a few months of to-ing and fro-ing, it then staged a full recovery. However, consumer sentiment has deteriorated significantly over the past year, while business sentiment has been more robust.

According to the latest Westpac-Melbourne Institute survey conducted in the second week of January, household sentiment has improved again. Their Consumer Sentiment Index rose from December’s reading of 80.3 to 84.1, a reading which is still well below the “normal” range and significantly lower than the long-term average reading of just over 101.

“Sentiment is still depressingly low. The January read is in the bottom 10% of observations since the mid-1970s,” said Westpac Chief Economist Bill Evans. “We have to go all the way back to the depths of the deep recession in the early 1990s to find a period where Index reads were consistently below those seen over the last six months, including the improved print in January.”

Any reading of the Consumer Sentiment Index below 100 indicates the number of consumers who are pessimistic is greater than the number of consumers who are optimistic.

Commonwealth Government bond yields slipped a little at the short end on the day while long-term yields moved modestly higher. By the close of business, the 3-year ACGB yield had lost 1bp to 3.23%, the 10-year yield had inched up 1bp to 3.62% while the 20-year yield finished 2bps higher at 3.99%.

In the cash futures market, expectations regarding future rate rises remained essentially unchanged. At the end of the day, contracts implied the cash rate would rise from the current rate of 3.07% to average 3.215% in February and then increase to an average of 3.555% in May. August 2023 contracts implied a 3.735% average cash, as did November 2023 contracts.

Evans put forward a “likely explanation” for the improvement in consumer confidence, noting no change to the Bank’s cash rate target in January. “While that was because there was no RBA Board meeting in the month rather than an explicit decision by the Bank to leave rates unchanged, the break in the tightening cycle looks to have provided some relief.”

All five sub-indices registered higher readings, with the “Economic conditions – next 12 months” sub-index posting the largest monthly percentage gain.

The Unemployment Expectations index, formerly a useful guide to RBA rate changes, fell from 117.9 to 108.0. Lower readings result from fewer respondents expecting a higher unemployment rate in the year ahead.

Inflation Gauge up modestly in December

16 January 2023

Summary: Melbourne Institute Inflation Gauge index up 0.2% in December; up 5.9% on annual basis.

The Melbourne Institute’s Inflation Gauge is an attempt to replicate the ABS consumer price index (CPI) on a monthly basis. It has turned out to be a reliable leading indicator of the CPI, although there are periods in which the Inflation Gauge and the CPI have diverged for as long as twelve months. On average, the Inflation Gauge’s annual rate tends to overestimate the ABS rate by around 0.1%, at least until recently.

The Melbourne Institute’s latest reading of its Inflation Gauge index indicates consumer prices increased by 0.2% in December, following increases of 1.0% and 0.4% in November and October respectively. The index rose by 5.9% on an annual basis, unchanged from November’s figure.

Commonwealth Government bond yields barely moved on the day. By the close of business, 3-year and 10-year ACGB yields had both returned to their respective starting points at 3.24% and 3.61% while the 20-year yield finished 1bp lower at 3.97%.

In the cash futures market, expectations regarding future rate rises also hardly changed. Contracts implied the cash rate would rise from the current rate of 3.07% to average 3.22% in February and then increase to an average of 3.555% in May. August contracts implied a 3.73% average cash rate while November contracts implied 3.735%.

Given the Inflation Gauge’s tendency to slightly overestimate, the latest figures imply an official annual inflation reading of 5.8% (seasonally adjusted) in the December quarter. However, it is worth noting the annual CPI rate in recent quarters has been consistently well-above its Inflation Gauge equivalent. Regression analysis on a year-on-year basis suggests an official reading of 6.4%.

Euro-zone output still erratic; up 1% in November

13 January 2023

Summary: Euro-zone industrial production up 1.0% in November, double expected figure; annual growth slows from 3.4% to 2.0%; German, French 10-year yields up modestly; expansion in two of four largest economies.

Following a recession in 2009/2010 and the debt-crisis which flowed from it, euro-zone industrial production recovered and then reached a peak four years later in 2016. Growth rates then fluctuated for two years before beginning a steady and persistent slowdown from the start of 2018. That decline was transformed into a plunge in March and April of 2020 which then took over a year to claw back. Production levels in more-recent months have generally stagnated in trend terms.

According to the latest figures released by Eurostat, euro-zone industrial production expanded by 1.0% in November on a seasonally-adjusted and calendar-adjusted basis. The increase was double the 0.5% which had been generally expected and in contrast with October’s 1.9% contraction after revisions. The calendar-adjusted growth rate on an annual basis slowed from October’s revised rate of +3.4% to +2.0%.

German and French sovereign bond yields moved modestly higher on the day. By the close of business, the German 10-year bund yield had added 2bps to 2.14% while the French 10-year OAT yield finished unchanged at 2.61%.

Industrial production expanded in two of the euro-zone’s four largest economies. Germany’s production increased by 0.6% over the month while the comparable figures for France, Spain and Italy were +2.1%, -0.7% and -0.3% respectively.

Click for more news