News

Fewer, smaller home loans: November loan approvals down 3.7%

13 January 2023

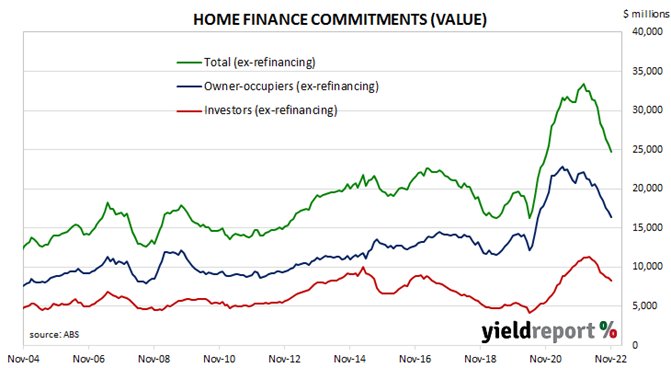
Summary: Value of loan commitments down 3.7% in November; 24.3% lower than November 2021; ANZ: more rate rises to push home lending down further; value of owner-occupier loan approvals down 3.8%; investor approvals down 3.6%; number of home loan approvals down 2.0%.

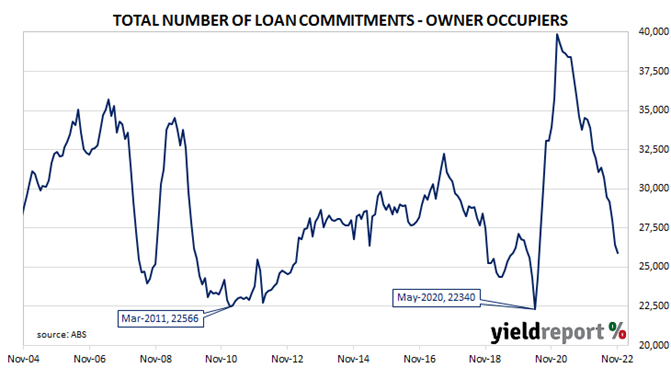
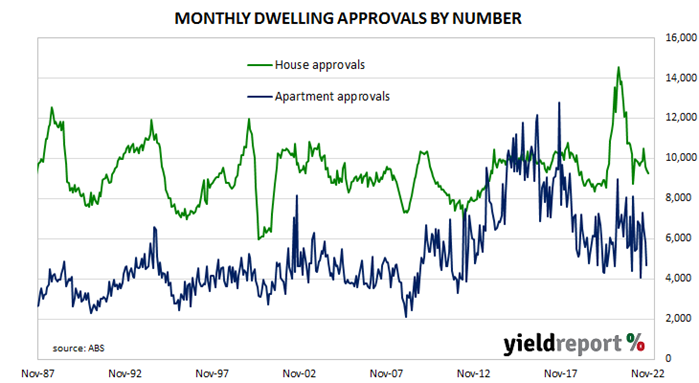
The number and value of home-loan approvals began to noticeably increase after the RBA reduced its cash rate target in a series of cuts beginning in mid-2019, potentially ending the downtrend which had been in place since mid-2017. Figures from February through to May of 2020 provided an indication the downtrend was still intact but subsequent figures then pushed both back to elevated levels in 2021. However, there has been a considerable pullback since then.

November’s housing finance figures have now been released and total loan approvals excluding refinancing decreased by 3.7% In dollar terms over the month, lower than the 2.0% fall which had been generally expected and below October’s -2.8%. On a year-on-year basis, total approvals excluding refinancing fell by 24.3%, down from the previous month’s comparable figure of -17.2%.

“We expect three more rate hikes this year, which are likely to push housing lending down further…” said ANZ senior economist Adelaide Timbrell. She expects lower housing prices will lead to smaller loans on average while fewer listings and sales will lead to fewer loans being made.

Commonwealth Government bond yields barely moved on the day. By the close of business, the 3-year ACGB yield had slipped 1bp to 3.24% while 10-year and 20-year yields both finished unchanged at 3.61% and 3.98% respectively.

In the cash futures market, expectations regarding future rate rises eased. At the end of the day, contracts implied the cash rate would rise from the current rate of 3.07% to average 3.215% in February and then increase to an average of 3.54% in May. August 2023 contracts implied a 3.73% average cash rate while November 2023 contracts implied 3.72%.

The total value of owner-occupier loan commitments excluding refinancing decreased by 3.8%, down from October’s -3.1%. On an annual basis, owner-occupier loan commitments were 24.8% lower than in November 2021, below October’s comparable figure of -17.5%.

The total value of investor commitments excluding refinancing arrangements fell by 3.6%. The decline followed a 2.3% fall in October, taking the growth rate over the previous 12 months to -23.2%, down from -16.7%.

The total number of loan commitments to owner-occupiers excluding refinancing fell by 2.0% to 25,930 on a seasonally adjusted basis. The fall was a smaller one than October’s 5.6% drop but the annual contraction rate still accelerated from -21.7% to -25.0%.

Possible US Fed cut in late 2023 after Dec inflation figures

12 January 2023

Summary: US CPI down 0.1% in December, less than expected; “core” rate up 0.3%; inflation easing, expectations building for Fed easing in second half of 2023; Treasury yields fall considerably; rate-rise expectations soften; goods inflation “solved”, services inflation key for 2023; energy prices main driver, subtracts 0.41 ppts.

The annual rate of US inflation as measured by changes in the consumer price index (CPI) halved from nearly 3% in the period from July 2018 to February 2019. It then fluctuated in a range from 1.5% to 2.0% through 2019 before rising above 2.0% in the final months of that year. Substantially lower rates were reported from March 2020 to May 2020 and they remained below 2% until March 2021. Rates have since risen significantly.

The latest CPI figures released by the Bureau of Labor Statistics indicated seasonally-adjusted consumer prices declined by 0.1% on average in December. The result was less than the flat result which had been generally expected and it contrasted with November’s 0.1% increase. On a 12-month basis, the inflation rate slowed from 7.1% to 6.4%.

“Headline” inflation is known to be volatile and so references are often made to “core” inflation for analytical purposes. The core prices index, the index which excludes the more variable food and energy components, increased by 0.3% on a seasonally-adjusted basis for the month. The rise was in line with expectations and more than November’s 0.2%. The annual growth rate slowed from 6.0% to 5.7%.

“Overall inflation is easing in the US, with markets taking that as a sign that the Fed will be able to pause, and that as the economy starts to react to the monetary tightening put into place, the Fed will cut rates in H2 2023,” said NAB senior economist Tapas Strickland.

US Treasury bond yields finished considerably lower on the day. By the close of business, the 2-year Treasury yield had shed 8bps to 4.13%, the 10-year yield had lost 10bps to 3.44% while the 30-year yield finished 9bps lower at 3.58%.

In terms of US Fed policy, expectations of higher federal funds rates over the next 12 months softened. At the close of business, contracts implied the effective federal funds rate would average 4.595% in February, 27bps higher than the current spot rate, and then climb to an average of 4.66% in March 2023. May 2023 futures contracts implied a 4.89% average effective federal funds rate while December 2023 contracts implied 4.475%.

“The overall theme of the print is that goods inflation is now solved, but the evolution of services inflation will be the key for 2023,” said NAB senior interest rate strategist Ken Crompton.

The largest influence on headline results is often the change in fuel prices. Prices of “Energy commodities”, the segment which contains vehicle fuels, decreased by 9.4% and subtracted 0.41 percentage points from the index. Prices of non-energy services, the segment which includes actual and implied rents, had the next-largest effect on the total, adding 0.29 percentage points after increasing by 0.5% on average.             

November retail figures “a strong result”

11 January 2023

Summary: Retail sales up 1.4% in November, more than double expectations; “a strong result”; largest influence on month from clothing sales.

Growth figures of domestic retail sales spent most of the 2010s at levels below the post-1992 average. While economic conditions had been generally favourable, wage growth and inflation rates were low. Expenditures on goods then jumped in the early stages of 2020 as government restrictions severely altered households’ spending habits. Households mostly reverted to their usual patterns as restrictions eased in the latter part of 2020 and throughout 2021, although not for all categories.

According to the latest ABS figures, total retail sales increased by 1.4% in November on a seasonally adjusted basis. The rise was more than double the 0.6% increase which had been generally expected and considerably more than October’s revised figure of 0.4%. Sales increased by 7.7% on an annual basis, down from October’s comparable figure of 17.9%.

“Although this is a strong result, it’s much weaker than November growth in 2020 and 2021, both of which benefitted from the perfect storm of post-lockdown spending spikes and Black Friday sales,” said ANZ senior economist Adelaide Timbrell.

Commonwealth Government bond yields moved a touch higher on the day. By the close of business, the 3-year ACGB yield had inched up 1bp to 3.38%, the 10-year yield had returned to its starting point at 3.74% while the 20-year  yield finished 1bp higher at 4.10%.

In the cash futures market, expectations regarding future rate rises softened a little. At the end of the day, contracts implied the cash rate would rise from the current rate of 3.07% to average 3.215% in February and then increase to an average of 3.59% in May. August 2023 contracts implied a 3.825% average cash rate while November 2023 contracts implied 3.85%.

Retail sales are typically segmented into six categories (see below), with the “food” segment accounting for nearly 40% of total sales. However, the largest influence on the month’s total came from the clothing category where sales increased by 6.4% on average over the month and contributed 0.55 percentage points to the net result.

Home approvals “catching up”; down 9% in November

09 January 2023

Summary: Home approval numbers down 9.0% in November, below expectations; 15.1% lower than November 2021; dwelling approvals catching up with other indicators hit by rising rates; house approvals down 2.4%, apartments down 19.9%; non-residential approvals up 2.0% in dollar terms, residential alterations down 9.2%.

Building approvals for dwellings, that is apartments and houses, headed south after mid-2018. As an indicator of investor confidence, falling approvals had presented a worrying signal, not just for the building sector but for the overall economy. However, approval figures from late-2019 and the early months of 2020 painted a picture of a recovery taking place, even as late as April of that year. Subsequent months’ figures then trended sharply upwards before falling back in 2021 and 2022.

The Australian Bureau of Statistics has released the latest figures from November which show total residential approvals fell by 9.0% on a seasonally-adjusted basis. The fall was lower than the flat result which had been generally expected as well as October’s -5.6%. Total approvals fell by 15.1% on an annual basis, below the previous month’s figure of -6.2%. Monthly growth rates are often volatile.

“In response to higher rates, housing lending has almost halved from its COVID peak. The same impact was not seen in building approvals through most of 2022,” said ANZ senior economist Adelaide Timbrell. “This has started to shift.”

Commonwealth Government bond yields fell on the day, especially at the short end of the yield curve. By the close of business, the 3-year ACGB yield had shed 14bps to 3.38%, the 10-year yield had lost 10bps to 3.74% while the 20-year yield finished 5bps lower at 4.11%.

In the cash futures market, expectations regarding future rate rises softened. At the end of the day, contracts implied the cash rate would rise from the current rate of 3.06% to average 3.21% in February and then increase to an average of 3.375% in March. May 2023 contracts implied a 3.595% average cash rate while August 2023 contracts implied 3.855%.

Approvals for new houses fell by 2.4% over the month after declining by 1.2% in October. On a 12-month basis, house approvals were 13.5% lower than they were in November 2021, down from October’s comparable figure of -12.1%.

Apartment approval figures are usually a lot more volatile and November’s total dropped by 19.9% after an 11.8% fall in October. The 12-month growth rate fell from October’s revised rate of +5.3% to -18.1%.

Non-residential approvals increased by 2.0% in dollar terms over the month and by 8.8% on an annual basis. Figures in this segment also tend to be rather volatile.

Residential alteration approvals decreased by 9.2% in dollar terms over the month and were 7.6% lower than in November 2021.

US wage growth in December “encouraging” for Fed

06 January 2023

Summary: Non-farm payrolls up 223,000 in November, greater than expected; previous two months’ figures revised down by 28,000; jobless rate declines to 3.5%, participation rate up; labour market report “solid”; employed-to-population ratio up; underutilisation rate down from 6.7% to 6.5%; annual hourly pay growth down from 4.8% to 4.6%; moderating wage growth “encouraging” for Fed.

The US economy ceased producing jobs in net terms as infection controls began to be implemented in March 2020. The unemployment rate had been around 3.5% but that changed as job losses began to surge through March and April of 2020. The May 2020 non-farm employment report represented a turning point and subsequent months provided substantial employment gains. Changes in recent months have been generally more modest but still above the average of the last decade.

According to the US Bureau of Labor Statistics, the US economy created an additional 223,000 jobs in the non-farm sector in December. The increase was greater than the 205,000 which had been generally expected but less than the 256,000 jobs which had been added in November after revisions. Employment figures for October and November were revised down by a total of 28,000.

The total number of unemployed dropped by 278,000 to 5.722 million while the total number of people who were either employed or looking for work increased by 439,000 to 164.966 million. These changes led to the US unemployment rate declining from October’s revised figure of 3.6% to 3.5% even as the participation rate ticked up from 62.2% to 62.3%.

“The December labour market report was solid, as labour demand remains robust,” said ANZ economist Gregorius Steven.

US Treasury yields fell noticeably on the day. By the close of business, the 2-year yield had shed 18bps to 4.28%, the 10-year yield had lost 16bps to 3.56% while the 30-year yield finished 9bps lower at 3.69%.

In terms of US Fed policy, expectations of higher federal funds rates over the next 12 months softened. At the close of business, contracts implied the effective federal funds rate would average 4.64% in February, 31bps higher than the current spot rate, and then climb to an average of 4.71% in March 2023. May 2023 futures contracts implied a 4.935% average effective federal funds rate while December 2023 contracts implied 4.57%.

One figure which is indicative of the “spare capacity” of the US employment market is the employment-to-population ratio. This ratio is simply the number of people in work divided by the total US population. It hit a cyclical-low of 58.2 in October 2010 before slowly recovering to just above 61% in late-2019. December’s reading kicked up from 59.9% to 60.1%, still some way from the April 2000 peak reading of 64.7%.

Apart from the unemployment rate, another measure of tightness in the labour market is the underutilisation rate and the latest reading of it registered 6.5%, down from 6.7% in November. Wage inflation and the underutilisation rate usually have an inverse relationship; however, hourly pay growth in the year to December slowed from 4.8% after revisions to 4.6%.

“Moderation in wage growth is encouraging for the Fed, but the numbers could be biased by strong growth in leisure and hospitality jobs, which are lower paid than average,” Steven noted.

Euro-zone industrial production drops 2% in October

14 December 2022

Summary: Euro-zone industrial production down 2.0% in October, fall greater than expected; annual growth rate drops from 5.1% to 3.4%; “another indication” of euro-zone recession ahead; German, French 10-year yields up modestly; contraction in all four largest economies.

Following a recession in 2009/2010 and the debt-crisis which flowed from it, euro-zone industrial production recovered and then reached a peak four years later in 2016. Growth rates then fluctuated for two years before beginning a steady and persistent slowdown from the start of 2018. That decline was transformed into a plunge in March and April of 2020 which then took over a year to claw back. Production levels in more-recent months have generally stagnated in trend terms.

According to the latest figures released by Eurostat, euro-zone industrial production contracted by 2.0% in October on a seasonally-adjusted and calendar-adjusted basis. The fall was a greater one than the 1.3% decrease which had been generally expected and in contrast with September’s 0.8% gain after revisions. The calendar-adjusted growth rate on an annual basis decreased from September’s revised rate of +5.1% to +3.4%.

ANZ economist John Bromhead described the result as “another indication of a recession ahead.”

German and French sovereign bond yields moved modestly higher on the day. By the close of business, the German 10-year bund yield had added 2bps to 1.94% while the French 10-year OAT yield finished u3bps higher at 2.43%.

Industrial production contracted in all four of the euro-zone’s four largest economies. Germany’s production contracted by 0.9% over the month while the comparable figures for France, Spain and Italy were -2.6%, -0.4% and -1.0% respectively.

US inflation pressures easing in November

13 December 2022

Summary: US CPI up 0.1% in November, less than expected; “core” rate up 0.2%; inflation pressures easing; Treasury yields fall significantly; rate-rise expectations soften considerably; softening goods inflation, persistent services inflation theme “intact”; non-energy services again main driver, adds 0.23 ppts.

The annual rate of US inflation as measured by changes in the consumer price index (CPI) halved from nearly 3% in the period from July 2018 to February 2019. It then fluctuated in a range from 1.5% to 2.0% through 2019 before rising above 2.0% in the final months of that year. Substantially lower rates were reported from March 2020 to May 2020 and they remained below 2% until March 2021. Rates have since risen significantly.

The latest CPI figures released by the Bureau of Labor Statistics indicated seasonally-adjusted consumer prices increased by 0.1% on average in November. The result was noticeably  below the generally expected figure of 0.3% as well as October’s 0.4% increase. On a 12-month basis, the inflation rate slowed from 7.8% to 7.1%.

“Headline” inflation is known to be volatile and so references are often made to “core” inflation for analytical purposes. The core prices index, the index which excludes the more variable food and energy components, increased by 0.2% on a seasonally-adjusted basis for the month. The rise was less than the expected increase of 0.3% as well as the 0.3% increase which took place in October and the annual growth rate slowed from 6.3% to 6.0%.

“So, although prices are still rising, they are rising at the slowest rate in over a year, indicating inflation pressures are easing,” ANZ Head of FX Research Mahjabeen Zaman.

US Treasury bond yields finished significantly lower on the day. By the close of business, the 2-year Treasury yield had shed 18bps to 4.21%, the 10-year yield had lost 10bps to 3.51% while the 30-year yield finished 4bps lower at 3.53%.

In terms of US Fed policy, expectations of higher federal funds rates over the next 12 months softened considerably. At the close of business, contracts implied the effective federal funds rate would average 4.11% in December, 28bps higher than the current spot rate, and then climb to an average of 4.65% in February. May futures contracts implied a 4.845% average effective federal funds rate while November contracts implied 4.545%.

“Energy was a bit drag on [the] headline but, even so, the ex-food and energy core print of 0.2% was 0.1 percentage points lower than expected,” said NAB senior interest rate strategist Ken Crompton.  “The broad theme of rapidly softening goods inflation and more persistent services inflation definitely remains intact.”

The largest influence on headline results is often the change in fuel prices. Prices of “Energy commodities”, the segment which contains vehicle fuels, decreased by 2.0% and subtracted 0.09 percentage points. However, prices of non-energy services, the segment which includes actual and implied rents, again had the largest effect on the total, adding 0.23 percentage points after increasing by 0.4% on average.         

Weak bounce for WBC-MI sentiment index in December

13 December 2022

Summary: Household sentiment improves in December; still comparable with COVID lows, GFC despite lift; three of five sub-indices higher; more respondents expecting higher jobless rate.

After a lengthy divergence between measures of consumer sentiment and business confidence in Australia which began in 2014, confidence readings of the two sectors converged again in mid-July 2018. Both measures then deteriorated gradually in trend terms, with consumer confidence leading the way. Household sentiment fell off a cliff in April 2020 but, after a few months of to-ing and fro-ing, it then staged a full recovery. However, consumer sentiment has deteriorated significantly over the past year, while business sentiment has been more robust.

According to the latest Westpac-Melbourne Institute survey conducted in the week beginning 5 December, household sentiment has improved. Their Consumer Sentiment Index rose from November’s reading of 78.0 to 80.3, a reading which is still well below the “normal” range and significantly lower than the long-term average reading of just over 101.

“Despite this welcome lift the level of the Index remains comparable with the lows seen during the COVID pandemic and the Global Financial Crisis,” said Westpac Chief Economist Bill Evans. “December’s 3% rise follows a disastrous 6.9% drop in November that saw the Index collapse to just 78, one of the weakest reads recorded outside of a recession.”

Any reading of the Consumer Sentiment Index below 100 indicates the number of consumers who are pessimistic is greater than the number of consumers who are optimistic.

Commonwealth Government bond yields moved higher on the day. By the close of business, the 3-year ACGB yield had gained 5bps to 3.13%, the 10-year yield had inched up 1bp to 3.40% while the 20-year yield finished 2bps higher at 3.73%.

In the cash futures market, expectations regarding future rate rises firmed slightly. At the end of the day, contracts implied the cash rate would rise from the current rate of 3.06% to average 3.18% in February and then increase to an average of 3.295% in May. August 2023 contracts implied a 3.65% average cash rate while November 2023 contracts implied 3.64%.

Three of the five sub-indices registered higher readings, with the “Family finances – next 12 months” sub-index posting the largest monthly percentage gain.

The Unemployment Expectations index, formerly a useful guide to RBA rate changes, rose from 117.3 to 117.9. Higher readings result from more respondents expecting a higher unemployment rate in the year ahead.

NAB conditions index slips in November, confidence index now negative

13 December 2022

Summary: Business conditions deteriorate in November; confidence also deteriorates, well below long-term average; confidence index below zero, first negative since December 2021; economy’s strength set to end in 2023; capacity utilisation rate declines but still elevated.

NAB’s business survey indicated Australian business conditions were robust in the first half of 2018, with a cyclical-peak reached in April of that year. Readings from NAB’s index then began to slip and forecasts of a slowdown in the domestic economy began to emerge in the first half of 2019 as the index trended lower. It hit a nadir in April 2020 as pandemic restrictions were introduced but then conditions improved markedly over the next twelve months. Subsequent readings were generally in a historically-normal range until the second half of 2022.

According to NAB’s latest monthly business survey of over 500 firms conducted over the last week of November, business conditions have deteriorated for a second consecutive month while managing to remain at an elevated level. NAB’s conditions index registered 20, down 2 points from October’s reading.

Business confidence also deteriorated. NAB’s confidence index fell from October’s reading of 0 to -4, a reading which is well below the long-term average. Typically, NAB’s confidence index leads the conditions index by one month, although some divergences have appeared from time to time.

“Business confidence turned negative in November, falling below zero for the first time since December 2021, while conditions remained elevated at +20 index points despite easing 2 points in the month,” said Westpac Senior Economist, Gareth Spence.

Commonwealth Government bond yields moved higher on the day. By the close of business, the 3-year ACGB yield had gained 5bps to 3.13%, the 10-year yield had inched up 1bp to 3.40% while the 20-year yield finished 2bps higher at 3.73%.

In the cash futures market, expectations regarding future rate rises firmed slightly. At the end of the day, contracts implied the cash rate would rise from the current rate of 3.06% to average 3.18% in February and then increase to an average of 3.295% in May. August 2023 contracts implied a 3.65% average cash rate while November 2023 contracts implied 3.64%.

“Overall, the survey highlights a growing concern that the economy’s strength over 2022 is set to come to an end as we enter 2023, and forward orders have softened…reflecting a more uncertain outlook,” Spence concluded.

NAB’s measure of national capacity utilisation remained at a historically-elevated level although it declined from 85.8% to 85.2%. All eight sectors of the economy were reported to be operating above their respective long-run averages.

Capacity utilisation is generally accepted as an indicator of future investment expenditure and it also has a strong inverse relationship with the unemployment rate.

US consumers’ views of inflation soften in UoM December report

09 December 2022

Summary: University of Michigan consumer confidence index improves modestly, above expectations; views of present conditions, future conditions improve; recovers most of November loss; inflation expectations decline to be welcomed by US Fed.

US consumer confidence started 2020 at an elevated level but, after a few months, surveys began to reflect a growing unease with the global spread of COVID-19 and its reach into the US. Household confidence plunged in April 2020 and then recovered in a haphazard fashion, generally fluctuating at below-average levels according to the University of Michigan. The University’s measure of confidence had recovered back to the long-term average by April 2021 but then it plunged again in the September quarter and has since remained at historically low levels.

The latest survey conducted by the University indicates confidence among US households improved modestly on average in December. The preliminary reading of the Index of Consumer Sentiment registered 59.1, above the generally expected figure of 56.8 as well as November’s final figure of 56.8. Consumers’ views of current conditions and future conditions both improved in comparison to those held at the time of the November survey.

“Consumer sentiment rose 4% above November, recovering most of the losses from November but remaining low from a historical perspective,” said the University’s Surveys of Consumers Director Joanne Hsu.

US Treasury bond yields rose materially on the day. By the close of business, the 2-year Treasury yield had gained 8bps to 4.36%, the 10-year yield had added 9bps to 3.58% while the 30-year yield finished 13bps higher at 3.56%.

In terms of US Fed policy, expectations of higher federal funds rates over the next 12 months firmed a little. At the close of business, contracts implied the effective federal funds rate would average 4.12% in December, 29bps higher than the current spot rate, and then climb to an average of 4.71% in February 2023. May 2023 futures contracts implied a 4.95% average effective federal funds rate while November 2023 contracts implied 4.68%.

ANZ rates strategist Gregorius Steven noted a decline in consumers’ expectations of inflation over the next twelve months and said this “will be welcomed by the Fed” and increase the likelihood of smaller rate rises in the near term.

It was once thought less-confident households are generally inclined to spend less and save more; some decline in household spending could be expected to follow. However, recent research suggests the correlation between household confidence and retail spending is quite weak.

Click for more news