News

Signs goods inflation “easing” from US November PPI numbers; still “elevated”

09 December 2022

Summary: US producer price index (PPI) up 0.3% in November, more than expected; annual rate slows to 7.4%; “core” PPI up 0.4%; “further easing” in goods pricing but still “elevated”; Treasury yields rise materially, rate-rise expectations firm slightly; “marked difference” between goods and service prices.

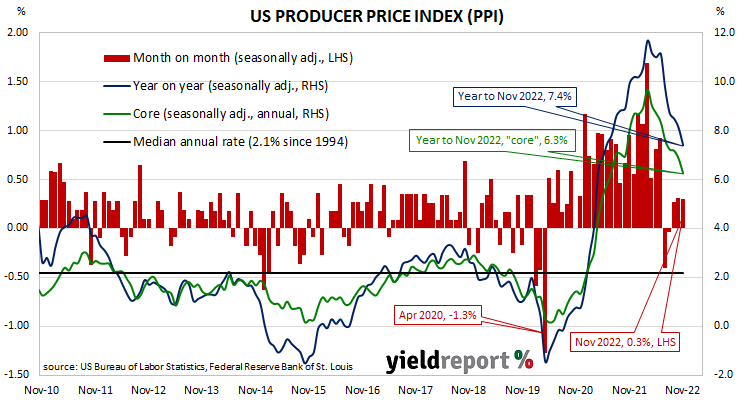
Around the end of 2018, the annual inflation rate of the US producer price index (PPI) began a downtrend which continued through 2019. Months in which producer prices increased suggested the trend may have been coming to an end, only for it to continue, culminating in a plunge in April 2020. Figures returned to “normal” towards the end of that year but annual rates through 2021 and 2022 have been well above the long-term average.

The latest figures published by the Bureau of Labor Statistics indicate producer prices increased by 0.3% after seasonal adjustments in November. The rise was higher than the 0.2% rise which had been generally expected but in line with October’s rise after it was revised up from 0.2%. On a 12-month basis, the rate of producer price inflation after seasonal adjustments and revisions slowed from 8.1% in October to 7.4%.

Producer prices excluding foods and energy, or “core” PPI, increased by 0.4% after seasonal adjustments. The result was double the generally expected 0.4% increase and up substantially from October’s 0.1% rise. The annual rate still slowed from October’s revised figure of 6.9% to 6.3%.

“While the monthly PPI print beat expectations, the detail showed further easing in goods pricing and margin inflation is trending lower,” said NAB Head of Markets Strategy Skye Masters. “However, price pressures remain elevated and there is a long way to go to get inflation back to target.”

US Treasury bond yields rose materially on the day. By the close of business, the 2-year Treasury yield had gained 8bps to 4.36%, the 10-year yield had added 9bps to 3.58% while the 30-year yield finished 13bps higher at 3.56%.

In terms of US Fed policy, expectations of higher federal funds rates over the next 12 months firmed a little. At the close of business, contracts implied the effective federal funds rate would average 4.12% in December, 29bps higher than the current spot rate, and then climb to an average of 4.71% in February 2023. May 2023 futures contracts implied a 4.95% average effective federal funds rate while November 2023 contracts implied 4.68%.

“The data continued the theme of a marked difference between the trajectory of goods and service prices,” said ANZ economist Gregorius Steven. “The data is consistent with consumer price service inflation ex rents increasing in the next CPI release.”

The producer price index is a measure of prices received by producers for domestically produced goods, services and construction. It is put together in a fashion similar to the consumer price index (CPI) except it measures prices received from the producer’s perspective rather than from the perspective of a retailer or a consumer. It is another one of the various measures of inflation tracked by the US Fed, along with core personal consumption expenditure (PCE) price data. 

Inflation Gauge jumps in November

05 December 2022

Summary: Melbourne Institute Inflation Gauge index up 1.0% in November; up 5.9% on annual basis.

The Melbourne Institute’s Inflation Gauge is an attempt to replicate the ABS consumer price index (CPI) on a monthly basis. It has turned out to be a reliable leading indicator of the CPI, although there are periods in which the Inflation Gauge and the CPI have diverged for as long as twelve months. On average, the Inflation Gauge’s annual rate tends to overestimate the ABS rate by around 0.1%.

The Melbourne Institute’s latest reading of its Inflation Gauge index indicates consumer prices increased by 1.0% in November. The rise follows increases of a 0.4% and 0.5% in October and September respectively. On an annual basis, the index rose by 5.9%, up from 5.2% in October.

Commonwealth Government bond yields moved lower on the day. By the close of business, the 3-year ACGB yield had slipped 1bp to 3.03%, the 10-year yield had lost 2bps to 3.37% while the 20-year yield finished 6bps lower at 3.71%.

In the cash futures market, expectations regarding future rate rises softened. At the end of the day, contracts implied the cash rate would rise from the current rate of 2.81% to average 2.96% in December and then increase to an average of 3.10% in February. May 2023 contracts implied a 3.345% average cash rate while August 2023 contracts implied 3.525%.

Central bankers desire a certain level of inflation which is “sufficiently low that it does not materially distort economic decisions in the community” but high enough so it does not constrain “a central bank’s ability to combat recessions.” Hence the recent obsession among central banks, including the RBA, to increase inflation.

US jobs market resilience; November figures beat estimates

05 December 2022

Summary: Non-farm payrolls up 263,000 in November, greater than expected; previous two months’ figures revised down by 23,000; jobless rate steady at 3.7%, participation rate slips to 62.1%; US jobs market “showing a lot of resilience”; jobs-to-population ratio slips to 59.9%; underutilisation rate down from 6.8% to 6.7%; annual hourly pay growth up from 4.9% to 5.1%.

The US economy ceased producing jobs in net terms as infection controls began to be implemented in March 2020. The unemployment rate had been around 3.5% but that changed as job losses began to surge through March and April of 2020. The May 2020 non-farm employment report represented a turning point and subsequent months provided substantial employment gains. Changes in recent months have been generally more modest but still above the average of the last decade.

According to the US Bureau of Labor Statistics, the US economy created an additional 263,000 jobs in the non-farm sector in November. The increase was greater than the 200,000 which had been generally expected but slightly less than the 284,000 jobs which had been added in October after revisions. Employment figures for September and October were revised down by a total of 23,000.

The total number of unemployed declined by 48,000 to 6.011 million while the total number of people who were either employed or looking for work decreased by 186,000 to 164.481 million. These changes led to the US unemployment rate remaining at 3.7% as the participation rate slipped from October’s rate of 62.2% to 62.1%.

“The labour market is showing a lot of resilience in the face of aggressive Fed tightening,” said ANZ Head of Australian Economics David Plank. “Labour force participation remains moribund amid the ongoing early retirement trend, suggesting wage growth will remain elevated.”

Short-term US Treasury yields rose noticeably on the day while long-term yields fell back. By the close of business, the 2-year yield had gained 7bps to 4.29%, the 10-year yield had lost 2bps to 3.49% while the 30-year yield finished 5bps lower at 3.55%.

In terms of US Fed policy, expectations of higher federal funds rates over the next 12 months firmed. At the close of business, contracts implied the effective federal funds rate would average 4.12% in December, 29bps higher than the current spot rate, and then climb to an average of 4.695% in February 2023. May 2023 futures contracts implied a 4.815% average effective federal funds rate while November 2023 contracts implied 4.62%.

One figure which is indicative of the “spare capacity” of the US employment market is the employment-to-population ratio. This ratio is simply the number of people in work divided by the total US population. It hit a cyclical-low of 58.2 in October 2010 before slowly recovering to just above 61% in late-2019. November’s reading slipped from 60.0% to 59.9%, some way from the April 2000 peak reading of 64.7%.

Apart from the unemployment rate, another measure of tightness in the labour market is the underutilisation rate and the latest reading of it registered 6.7%, down from 6.8% in October. Wage inflation and the underutilisation rate usually have an inverse relationship; hourly pay growth in the year to November increased from 4.9% after revisions to 5.1%.

US core PCE inflation undershoots in October

01 December 2022

Summary: US core PCE price index up 0.2% in October, less than expected; annual rate slows from 5.2% to 5.0%; reflects a number of one-offs; Treasury yields noticeably lower; Fed rate-rise expectations soften.

One of the US Fed’s favoured measures of inflation is the change in the core personal consumption expenditures (PCE) price index. After hitting the Fed’s target at the time of 2.0% in mid-2018, the annual rate then hovered in a range between 1.8% and 2.0% before it eased back to a range between 1.5% and 1.8% through 2019. It then plummeted below 1.0% in April 2020 before rising back to around 1.5% in the September quarter of that year. It has since increased significantly above the Fed’s target.

The latest figures have now been published by the Bureau of Economic Analysis as part of the October personal income and expenditures report. Core PCE prices rose by 0.2% over the month, less than the 0.3% which had been generally expected and September’s 0.5%. On a 12-month basis, the core PCE inflation rate slowed from September’s revised rate of 5.2% to 5.0%.

“The softer-than-expected 0.2% rise in core PCE inflation probably reflects a number of one-offs and monthly price gains may snap back,” said ANZ economist Jack Chambers.

US Treasury bond yields fell noticeably on the day. By the close of business, the 2-year Treasury bond yield had shed 11bps to 4.22%, the 10-year yield had lost 9bps to 3.51% while the 30-year yield finished 14bps lower at 3.60%.

In terms of US Fed policy, expectations of higher federal funds rates over the next 12 months softened. At the close of business, contracts implied the effective federal funds rate would average 4.1225% in December, 30bps higher than the current spot rate, and then climb to an average of 4.685% in February 2023. May 2023 futures contracts implied a 4.865% average effective federal funds rate while November 2023 contracts implied 4.575%.

The core version of PCE strips out energy and food components, which are volatile from month to month, in an attempt to identify the prevailing trend. It is not the only measure of inflation used by the Fed; the Fed also tracks the Consumer Price Index (CPI) and the Producer Price Index (PPI) from the Department of Labor. However, it is the one measure which is most often referred to in FOMC minutes.

October JOLTS figures “heading in the right direction”

30 November 2022

Summary: US quit rate slips to 2.6% in October; some indicators “heading in the right direction”; US yields down, expectations of higher rates soften; quits, openings down, separations up.

The number of US employees who quit their jobs as a percentage of total employment increased slowly but steadily after the GFC. It peaked in March 2019 and then tracked sideways until virus containment measures were introduced in March 2020. The quit rate then plummeted as alternative employment opportunities rapidly dried up. Following the easing of US pandemic restrictions, it proceeded to recover back to its pre-pandemic rate in the third quarter of 2020 and trended higher through 2021 before easing through much of 2022.

Figures released as part of the latest Job Openings and Labor Turnover Survey (JOLTS) report show the quit rate slowed in October. 2.6% of the non-farm workforce left their jobs voluntarily, down from September’s 2.7%, as quits in the month declined by 34,000 and an additional 261,000 people were employed in non-farm sectors.

“All in all [the report is] welcome news for the Fed that some of these indicators are heading in the right direction, but nothing to shake an assessment that the labour market is currently inconsistent with at-target inflation,” said NAB economist Taylor Nugent.

Charts of US quit rate against US annual wage growth

The report was followed by a much-anticipated speech by Fed chief Jerome Powell and US Treasury yields finished the day noticeably lower. By the close of business, the 2-year Treasury bond yield had shed 14bps to 4.33%, the 10-year yield had dropped by 15bps to 3.60% while the 30-year yield finished 6bps lower at 3.74%.

In terms of US Fed policy, expectations of higher federal funds rates over the next 12 months softened. At the close of business, contracts implied the effective federal funds rate would average 4.125% in December, 30bps higher than the current spot rate, and then climb to an average of 4.71% in February 2023. May 2023 futures contracts implied a 4.94% average effective federal funds rate while November 2023 contracts implied 4.675%.

The fall in total quits was led by 52,000 fewer resignations in the “Professional and business services” sector while the “Construction” sector experienced the largest gain, increasing by 31,000. Overall, the total number of quits for the month fell from September’s revised figure of 4.060 million to 4.026 million.

Total vacancies at the end of October decreased by 0.353 million, or 3.3%, from September’s revised figure of 10.687 million to 10.334 million. The fall was driven by a 146,000 decrease in the “Professional and business services” sector while the “Other services” sector experienced the single largest increase, rising by 76,000. Overall, 10 out of 18 sectors experienced fewer job openings than in the previous month.

Total separations increased by 18,000, or 0.3%, from September’s revised figure of 5.665 million to 5.683 million. The rise was led by the “Accommodation and food services” sector where there were 49,000 more separations than in September. Separations increased in 8 out of 18 sectors.

The “quit” rate time series produced by the JOLTS report is a leading indicator of US hourly pay. As wages account for around 55% of a product’s or service’s price in the US, wage inflation and overall inflation rates tend to be closely related. Former Federal Reserve chief and current Treasury Secretary Janet Yellen was known to pay close attention to it.

Lending growth slows in October

30 November 2022

Summary: Private sector credit up 0.6% in October, in line with expectations; annual growth rate up from 9.4% to 9.5%; new lending for housing now declining; business loans account for 50% of net growth.

The pace of lending to the non-bank private sector by financial institutions in Australia followed a steady-but-gradual downtrend from late-2015 through to early 2020 before hitting what appears to be a nadir in March 2021. That downtrend ended later in the same year and now annual growth rates are above the peak seen in the previous decade.

According to the latest RBA figures, private sector credit increased by 0.6% in October. The result was in line with expectations but slightly slower than September’s 0.7% rise. On an annual basis, the growth rate accelerated from 9.4% to 9.5%. “

The housing market is showing the adverse impacts of sharply higher interest rates,” Westpac senior economist Andrew Hanlan. “New lending for housing is now declining, and declining at a rate of knots, as borrowing capacity is reduced in recognition of higher interest rates.”

Commonwealth Government bond yields moved lower on the day. By the close of business, the 3-year ACGB yield had lost 7bps to 3.18%, the 10-year yield had shed 8bps to 3.53% while the 20-year yield finished 9bps lower at 3.91%.

In the cash futures market, expectations regarding future rate rises softened. At the end of the day, contracts implied the cash rate would rise from the current rate of 2.81% to average 2.97% in December and then increase to an average of 3.14% in February. May 2023 contracts implied a 3.515% average cash rate while August 2023 contracts implied 3.68%.

Business lending accounted for 50% of the net growth over the month, owner-occupier lending accounted just under 40% and investor lending accounted for just over 10%. Personal lending increased slightly.

The traditional driver of overall loan growth, the owner-occupier segment, grew by 0.5% over the month, the same growth rate as in September, August and July. The sector’s 12-month growth rate slowed again, this time from 7.8% to 7.7%.

Total lending in the business sector increased by 0.8%, down from the 1.3% increase recorded in September. Growth on an annual basis accelerated from 14.7% to 15.0%.

Monthly growth in the investor-lending segment slowed to a halt in early 2018. Shortly into the 2019/20 financial year, monthly growth rates slipped into the red before posting a series of flat or near-flat results until mid-2020. In October, net lending grew by 0.3%, the same rate as in September. The 12-month growth rate slowed from 6.4% to 6.2%.                                   

Total personal loans increased by 0.2%, up from September’s flat result, taking the annual growth rate from 0.1% to 0.3%. This category of debt includes fixed-term loans for large personal expenditures, credit cards and other revolving credit facilities.

US economy losing momentum: Conf. Board confidence index slips in November

29 November 2022

Summary: Conference Board Consumer Confidence Index falls in November, essentially in line with expectations; views of present conditions, short-term outlook both deteriorate; US economy “has lost momentum”.

US consumer confidence clawed its way back to neutral over the five years after the GFC in 2008/2009 and then went from strength to strength until late 2018. Measures of consumer confidence then oscillated within a relatively narrow band at historically high levels until they plunged in early 2020. Subsequent readings then fluctuated around the long-term average until March 2021 when they reached elevated levels. However, a noticeable gap has since opened between the two most-widely followed surveys.

The latest Conference Board survey held during the first half of November indicated US consumer confidence has resumed deteriorating. November’s Consumer Confidence Index registered 100.2 on a preliminary basis, essentially in line with the median consensus figure of 100.0 but down from October’s final figure of 102.2.

“Consumer confidence declined again in November, most likely prompted by the recent rise in gas prices,” said Lynn Franco, a senior director at The Conference Board.

US Treasury yields finished the day higher. By the close of business, the 2-year Treasury bond yield had gained 3bps to 4.47%, the 10-year yield had added 7bps to 3.75% while the 30-year yield finished 8bps higher at 3.80%.

In terms of US Fed policy, expectations of higher federal funds rates over the next 12 months remained largely unchanged. At the close of business, December contracts implied an effective federal funds rate of 4.13%, 30bps higher than the current spot rate while February contracts implied a rate of 4.735%. December 2023 futures contracts implied 4.70%, 87bps above the spot rate.

Consumers’ views of present conditions and the near-future both deteriorated. The Present Situation Index declined from October’s revised figure of 138.7 to 137.4 while the Expectations Index fell from a revised figure of 77.9 to 75.4.

Franco pointed to the decline in the Present Situation Index as an indicator the US economy “has lost momentum as the year winds down.”

The Consumer Confidence Survey is one of two widely followed monthly US consumer sentiment surveys which produce sentiment indices. The Conference Board’s index is based on perceptions of current business and employment conditions, as well as respondents’ expectations of conditions six months in the future. The other survey, conducted by the University of Michigan, is similar and it is used to produce an Index of Consumer Sentiment. That survey differs in that it does not ask respondents explicitly about their views of the labour market and it also includes some longer-term questions.

Euro-zone November ESI up, first time since February

29 November 2022

Summary: Euro-zone composite sentiment index up in November, slightly above expectations; readings up in two of five sectors; up in two of four largest euro-zone economies; German, French 10-year yields lower; index implies annual GDP growth rate of zero.

The European Commission’s Economic Sentiment Indicator (ESI) is a composite index comprising five differently weighted sectoral confidence indicators. It is heavily weighted towards confidence surveys from the business sector, with the consumer confidence sub-index only accounting for 20% of the ESI. However, it has a good relationship with euro-zone GDP, although not necessarily as a leading indicator.

The ESI posted a reading of 93.7 in November, slightly above the consensus expectation of 93.0 as well as October’s revised reading of 92.7. The average reading since 1985 is approximately 100.

German and French 10-year bond yields finished the day lower. By the close of business, the German 10-year bund yield had lost 5bps to 1.93% while the French 10-year OAT yield had shed 7bps to 2.55%.

Confidence improved in two of the five sectors of the economy, deteriorated in one and were broadly unchanged in another two. On a geographical basis, the ESI increased in Germany and Italy but decreased in France and Spain.

End-of-quarter ESI readings and annual euro-zone GDP growth rates are highly correlated. This latest reading corresponds to a year-to-November GDP growth rate of zero, up from October’s implied growth rate of -0.2%.

 Euro-zone composite sentiment

“A broad-based weakening”: October retail sales down 0.2%

28 November 2022

Summary: Retail sales down 0.2% in October, below expectations; first monthly fall in 2022; “a broad-based weakening”, coming off high base; largest influence on month from food sales.

Growth figures of domestic retail sales spent most of the 2010s at levels below the post-1992 average. While economic conditions had been generally favourable, wage growth and inflation rates were low. Expenditures on goods then jumped in the early stages of 2020 as government restrictions severely altered households’ spending habits. Households mostly reverted to their usual patterns as restrictions eased in the latter part of 2020 and throughout 2021, although not for all categories.

According to the latest ABS figures, total retail sales decreased by 0.2% in October on a seasonally adjusted basis. The fall was in contrast with the 0.5% increase which had been generally expected as well as September’s 0.6% rise. Sales increased by 12.5% on an annual basis, down from September’s comparable figure of 17.9%.

“This is the first time retail sales have fallen this year and could add fuel to discussions about a possible RBA pause in December,” said ANZ economist Madeline Dunk.

Commonwealth Government bond yields moved lower on the day with the exception of ultra-long yields. By the close of business, the 3-year ACGB yield had shed 3.21%, the 10-year yield had lost 6bps to 3.52% while the 20-year yield finished 4bps higher at 4.00%.

Westpac senior economist Matthew Hassan described the month’s figures as indicative of “a broad-based weakening.” However he also acknowledged sales were “coming from a very high starting point” given the 12.5% rise over a twelve-month period.

Retail sales are typically segmented into six categories (see below), with the “food” segment accounting for nearly 40% of total sales. This segment was the largest influence on the total during the month as food sales increased by 0.4% on average over the month and contributed 0.15 percentage points to the net result.

German firms less pessimistic; ifo index rises in November

24 November 2022

Summary: ifo business climate index up in November, above expected figure; “recession could prove less severe” than previously expected; current conditions index down, expectations index up; expectations index implies euro-zone GDP contraction of 4.9% in year to February.

Following a recession in 2009/2010, the ifo Institute’s Business Climate Index largely ignored the European debt-crisis of 2010-2012, mostly posting average-to-elevated readings through to early-2020. However, the index was quick to react in the March 2020 survey, falling precipitously. Readings through much of 2021 generally fluctuated around the long-term average before dropping away this year.

According to the latest report released by ifo, German business sentiment has improved, albeit to a still-depressed level. November’s Business Climate Index recorded a reading of 86.3, higher than the generally expected figure of 85.0 as well as October’s final reading of 84.5. The average reading since January 2005 is just under 97.

“While companies were somewhat less satisfied with their current business, pessimism regarding the coming months reduced sharply,” said Clemens Fuest, President of the ifo Institute. ”The recession could prove less severe than many had expected.”

German firms’ views of current conditions deteriorated slightly while their outlook improved. The current situation index declined from October’s figure of 94.2 to 93.1 while the expectations index increased from 75.9 after revisions to 80.0.

German and French long-term bond yields both fell noticeably on the day. By the close of business, the German bund yield had shed 14bps to 2.18% and the French 10-year bond rates had lost 15bps to 2.71%.

The ifo Institute’s business climate index is a composite index which combines German companies’ views of current conditions with their outlook for the next six months. It has similarities to consumer sentiment indices in the US such as the ones produced by The Conference Board and the University of Michigan.

It also displays a solid correlation with euro-zone GDP growth rates. However, the expectations index is a better predictor as it has a higher correlation when lagged by one quarter. November’s expectations index implies a 4.9% year-on-year GDP contraction to the end of February.

Click for more news