News

Second consecutive month of improvement for consumer sentiment in euro-zone

22 November 2022

Summary: Euro-zone households less pessimistic in November; consumer confidence Index up 3.6 points; still well below long-term average, lower bound of “normal” readings; supported by easing utility prices, gas storage levels, hopes of geopolitical solutions; euro-zone bond yields moderately lower.

EU consumer confidence plunged during the GFC and again in 2011/12 during the European debt crisis. After bouncing back through 2013 and 2014, it fell back significantly in late 2018 but only to a level which corresponds to significant optimism among households. Following the plunge which took place in April 2020, a recovery began a month later, with household confidence returning to above-average levels from March 2021. However, recent readings have been extremely low by historical standards.

Consumer confidence improved for a second consecutive month in November according to the latest survey conducted by the European Commission. Its Consumer Confidence Indicator recorded a reading of -23.9, above the generally expected figure of -26.0 as well as October’s revised figure of -27.5. However, this latest reading is still well below the long-term average of -11.6 as well as the lower end of the range in which “normal” readings usually occur.

“That was the highest reading since June and has been supported by easing utility prices, high levels of EU gas storage and some hopes that geopolitical tensions in Europe may improve,” said ANZ senior economist Felicity Emmett.

Sovereign bond yields fell moderately in major euro-zone bond markets on the day. By the end of it, the German 10-year bund yield had lost 4bps to 1.98% while the French 10-year OAT yield finished 3bps lower at 2.45%.

US October retail report: consumer demand “still strong”

16 November 2022

Summary: US retail sales up 1.3% in October, greater than expected; annual growth rate slows from 8.6% to 8.3%; figures “point to still-strong consumer demand”; short-term Treasury bond yields up, longer term yields down; rate rise expectations firm slightly; rises in nine of thirteen retail categories; gas station segment largest single influence on month’s result.

US retail sales had been trending up since late 2015 but, commencing in late 2018, a series of weak or negative monthly results led to a drop-off in the annual growth rate below 2.0%. Growth rates then increased in trend terms through 2019 and into early 2020 until pandemic restrictions sent it into negative territory. A “v-shaped” recovery then took place which was followed by some short-term spikes as federal stimulus payments hit US households in the first and second quarters of 2021.

According to the latest “advance” numbers released by the US Census Bureau, total retail sales increased by 1.3% in October. The result was greater than the 0.9% increase which had been generally expected and well above September’s flat result. On an annual basis, the growth rate slowed from September’s revised figure of 8.6% to 8.3%.

“The data point to still-strong consumer demand which is something that the Fed is trying to reduce via its rapid monetary tightening,” said ANZ economist John Bromhead.

chart of monthly and annual US retail sales over time

Shorter-term US Treasury bond yields moved higher on the day while long-term yields fell back considerably. By the close of business, the 2-year Treasury yield had added 4bps to 4.38%, the 10-year yield had shed 8bps to 3.69% while the 30-year yield finished 12bps lower at 3.84%.

In terms of US Fed policy, expectations of higher federal funds rates over the next 12 months firmed slightly. At the close of business, contracts implied the effective federal funds rate would average 4.125% in December, 30bps higher than the current spot rate, and then climb to an average of 4.685% in February 2023. May 2023 futures contracts implied a 4.915% average effective federal funds rate while November 2023 contracts implied 4.605%.

Nine of the thirteen categories recorded higher sales over the month. The “Gasoline stations” segment again provided the largest single influence on the overall result, rising by 4.1% over the month.

percentage point contribution to month's change by segment

The non-store segment includes vending machine sales, door-to-door sales and mail-order sales but nowadays this segment has become dominated by online sales. It now accounts for 16% of all US retail sales and it is the second-largest segment after vehicles and parts.

US industrial output slips in October

16 November 2022

Summary: US industrial output down 0.1% in October, below expectations; up 3.3% over past 12 months; capacity utilisation rate down 0.2ppts to 79.9%, slightly below long-term average.

The Federal Reserve’s industrial production (IP) index measures real output from manufacturing, mining, electricity and gas company facilities located in the United States. These sectors are thought to be sensitive to consumer demand and so some leading indicators of GDP use industrial production figures as a component. US production collapsed through March and April of 2020 before recovering the ground lost over the fifteen months to July 2021.

According to the Federal Reserve, US industrial production contracted by 0.1% on a seasonally adjusted basis in October. The result contrasted with the 0.2% increase which had been generally expected as well as September’s 0.1% increase after it was revised down from 0.4%. On an annual basis the growth rate slowed from September’s revised figure of 5.0% to 3.3%.

chart of US industrial production changes over time against US GDP growth

Shorter-term US Treasury bond yields moved higher on the day while long-term yields fell back considerably. By the close of business, the 2-year Treasury yield had added 4bps to 4.38%, the 10-year yield had shed 8bps to 3.69% while the 30-year yield finished 12bps lower at 3.84%.

In terms of US Fed policy, expectations of higher federal funds rates over the next 12 months firmed slightly. At the close of business, contracts implied the effective federal funds rate would average 4.125% in December, 30bps higher than the current spot rate, and then climb to an average of 4.685% in February 2023. May 2023 futures contracts implied a 4.915% average effective federal funds rate while November 2023 contracts implied 4.605%.

The same report includes US capacity utilisation figures which are generally accepted as an indicator of future investment expenditure and/or inflationary pressures. Capacity usage had hit a high for the last business cycle in early 2019 before it began a downtrend which ended with April 2020’s multi-decade low of 64.2%. October’s reading declined from September’s revised figure of 80.1% to 79.9%, slightly below the long-term average of 80.0%.

While the US utilisation rate’s correlation with the US jobless rate is solid, it is not as high as the comparable correlation in Australia.

chart of US capacity utilisation rates over time against US unemployment rate

Latest Westpac-MI leading index reading supportive of “substantially lower” GDP growth in 2023

16 November 2022

Summary: Leading index growth rate down again in September; further support for forecasts of substantially slower growth in 2023; reading implies annual GDP growth of around 1.50%; ACGB yields mostly lower; rate-rise expectations firm; “sharp turnaround” from April attributed to higher interest rates, lower prices for commodities in AUD terms, slowing of “hours worked” growth.

Westpac and the Melbourne Institute describe their Leading Index as a composite measure which attempts to estimate the likely pace of Australian economic growth in the short-term. After reaching a peak in early 2018, the index trended lower through 2018 and 2019 before plunging to recessionary levels in the second quarter of 2020. Subsequent readings spiked towards the end of 2020 but then trended lower through 2021 and 2022.

The October reading of the six month annualised growth rate of the indicator registered -1.19%, down from September’s figure of -1.09% after it was revised from -1.15%.

“As the growth rate continues to fall, albeit at a much slower pace than we saw last month, we continue to get further support from the Leading Index that growth will slow substantially in 2023,” said Westpac Chief Economist Bill Evans.

Index figures represent rates relative to “trend” GDP growth, which is generally thought to be around 2.75% per annum in Australia. The index is said to lead GDP by “three to nine months into the future” but the highest correlation between the index and actual GDP figures occurs with a three-month lead. The current reading thus represents an annual GDP growth rate of around 1.50% at the end of the December quarter.

chart of leading index over time against GDP growth rates less 2.75%

Domestic Treasury bond yields mostly moved lower on the day following noticeable falls of US Treasury yields overnight. By the close of business, 3-year and 10-year ACGB yields had both lost 4bps to 3.29% and 3.73% respectively while the 20-year yield finished 1bp higher at 4.20%.

In the cash futures market, expectations regarding future rate rises firmed. At the end of the day, contracts implied the cash rate would rise from the current rate of 2.81% to average 2.97% in December and then increase to an average of 3.185% in February. May 2023 contracts implied a 3.62% average cash rate while August 2023 contracts implied 3.79%.

Evans noted the “sharp turnaround” from April’s reading of 1.19 to -1.19 to this latest reading. He attributed higher short-term interest rates, lower prices for commodities in Aussie dollar terms and a slowing of the “hours worked” growth rate as the main contributors to the change over the six month period.

“Disinflation evident in goods prices”; US October PPI less than expected

15 November 2022

Summary: US producer price index (PPI) up 0.2% in October, less than half expected figure; annual rate slows to 8.0%; “core” PPI flat; “disinflation evident in goods prices”; Treasury yields fall, rate-rise expectations soften.

Around the end of 2018, the annual inflation rate of the US producer price index (PPI) began a downtrend which continued through 2019. Months in which producer prices increased suggested the trend may have been coming to an end, only for it to continue, culminating in a plunge in April 2020. Figures returned to “normal” towards the end of that year but annual rates through 2021 and 2022 have been well above the long-term average.

The latest figures published by the Bureau of Labor Statistics indicate producer prices increased by 0.2% after seasonal adjustments in October. The rise was less than half the 0.5% increase which had been generally expected but in line with September’s rise after it was revised down from 0.4%. On a 12-month basis, the rate of producer price inflation after seasonal adjustments slowed from 8.4% in September to 8.0%.

Producer prices excluding foods and energy, or “core” PPI, effectively remained unchanged after seasonal adjustments. The result was less than the generally expected 0.3% increase as well as September’s 0.2% rise. The annual rate slowed from September’s revised figure of 7.1% to 6.7%.

“The data reflects ongoing improvement in supply chains and confirms the disinflation evident in goods prices,” said ANZ Head of FX Research Mahjabeen Zaman. “However, potentially far-stickier services and wage inflation is the primary concern for the Fed at this point.”

Chart of US PPI over time

US Treasury bond yields fell on the day. By the close of business, the 2-year Treasury yield had lost 5bps to 4.34%, the 10-year yield had shed 9bps to 3.77% while the 30-year yield finished 8bps lower at 3.96%.

In terms of US Fed policy, expectations of higher federal funds rates over the next 12 months softened. At the close of business, contracts implied the effective federal funds rate would average 4.125% in December, 30bps higher than the current spot rate, and then climb to an average of 4.685% in February 2023. May 2023 futures contracts implied a 4.895% average effective federal funds rate while November 2023 contracts implied 4.485%.

The producer price index is a measure of prices received by producers for domestically produced goods, services and construction. It is put together in a fashion similar to the consumer price index (CPI) except it measures prices received from the producer’s perspective rather than from the perspective of a retailer or a consumer. It is another one of the various measures of inflation tracked by the US Fed, along with core personal consumption expenditure (PCE) price data.

Germany leads euro production gain in September

14 November 2022

Summary: Euro-zone industrial production up 0.9% in September, greater than expected; annual growth rate rises from 2.8% to 4.9%; German, French 10-year yields hardly move; expansion in just one of euro-zone’s four largest economies.

Following a recession in 2009/2010 and the debt-crisis which flowed from it, euro-zone industrial production recovered and then reached a peak four years later in 2016. Growth rates then fluctuated for two years before beginning a steady and persistent slowdown from the start of 2018. That decline was transformed into a plunge in March and April of 2020 which then took over a year to claw back. Production levels in more-recent months have generally stagnated.

According to the latest figures released by Eurostat, euro-zone industrial production expanded by 0.9% in September on a seasonally-adjusted and calendar-adjusted basis. The rise was greater than the 0.5% increase which had been generally expected but considerably less than August’s 2.0% gain after revisions. The calendar-adjusted growth rate on an annual basis increased from August’s revised rate of +2.8% to +4.9%.

German and French sovereign bond yields hardly moved on the day. By the close of business, the German 10-year bund yield had slipped 1bp to 2.15% while the French 10-year OAT yield finished unchanged at 2.66%.

Industrial production expanded in just one of the euro-zone’s four largest economies. Germany’s production expanded by 0.8% over the month while the growth figures for France, Spain and Italy were -0.7%, -0.4% and -1.8% respectively.

“Some optimism” US inflationary pulse waning after October CPI report

10 November 2022

Summary: US CPI up 0.4% in October, less than expected; “core” rate up 0.3%; “some optimism” inflationary pulse starting to wane; “some moderation in services inflation”; Treasury yields fall significantly; rate-rise expectations soften; non-energy services again main driver, adds 0.29 ppts.

The annual rate of US inflation as measured by changes in the consumer price index (CPI) halved from nearly 3% in the period from July 2018 to February 2019. It then fluctuated in a range from 1.5% to 2.0% through 2019 before rising above 2.0% in the final months of that year. Substantially lower rates were reported from March 2020 to May 2020 and they remained below 2% until March 2021. Rates have since risen significantly.

The latest CPI figures released by the Bureau of Labor Statistics indicated seasonally-adjusted consumer prices increased by 0.4% on average in October. The result was well below the generally expected figure of 0.7% but in line with September’s increase. On a 12-month basis, the inflation rate slowed from 8.2% to 7.8%.

“Headline” inflation is known to be volatile and so references are often made to “core” inflation for analytical purposes. The core prices index, the index which excludes the more variable food and energy components, increased by 0.3% on a seasonally-adjusted basis for the month. The rise was less than the expected increase of 0.5% as well as the 0.6% increase in September and the annual growth rate slowed from 6.7% to 6.3%.

“Whilst the data allow some optimism that the inflationary pulse may be starting to wane, it is wise not to read too much into it,” said ANZ’s Head of G3 Economics Brian Martin. “The market was wrongfooted in the summer when July core inflation rose 0.3% only to roar back in August and September. A sequence of moderate prints is required to be confident that it is sustainably lower.”

chart of US CPI inflation over time

US Treasury bond yields finished significantly lower on the day. By the close of business, the 2-year Treasury yield had shed 33bps to 4.32%, the 10-year yield had lost 28bps to 3.82% while the 30-year yield finished 20bps lower at 4.06%.

In terms of US Fed policy, expectations of higher federal funds rates over the next 12 months softened noticeably. At the close of business, contracts implied the effective federal funds rate would average 4.12% in December, 29bps higher than the current spot rate, and then climb to an average of 4.68% in February 2023. May 2023 futures contracts implied a 4.875% average effective federal funds rate while November 2023 contracts implied 4.535%.

“In more normal times the annualised numbers, 7.7% for headline and 5.4% for core, would hardly be cause for cheer, but these are not normal times,” said NAB senior interest rate strategist Ken Crompton. “The most notable trend in the detail is some moderation in services inflation, especially rents and health insurance.”

The largest influence on headline results is often the change in fuel prices. Prices of “Energy commodities”, the segment which contains vehicle fuels, increased by 4.4% and added 0.19 percentage points. However, prices of non-energy services, the segment which includes actual and implied rents, again had the largest effect on the total, adding 0.29 percentage points after increasing by 0.5% on average.

WBC-MI sentiment index “plumbs historic lows” in November

08 November 2022

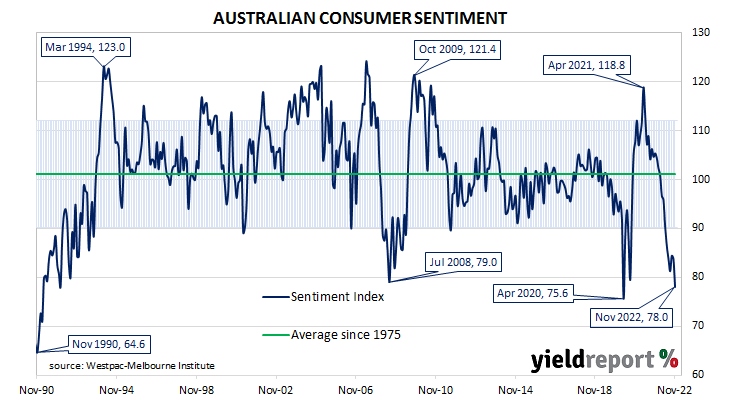
Summary: Household sentiment deteriorates again in November; only slightly higher than April 2020; rate increases, forecasts of higher electricity prices play roles in latest reading; UBS: “historically consistent” with falling real consumption; all five sub-indices lower; more respondents expecting higher jobless rate.

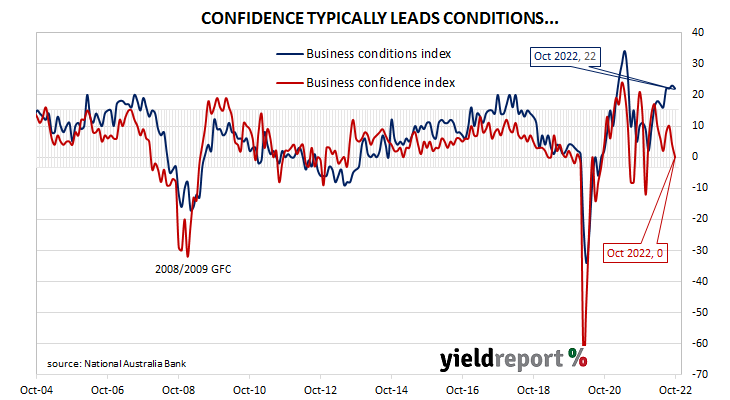
After a lengthy divergence between measures of consumer sentiment and business confidence in Australia which began in 2014, confidence readings of the two sectors converged again in mid-July 2018. Both measures then deteriorated gradually in trend terms, with consumer confidence leading the way. Household sentiment fell off a cliff in April 2020 but, after a few months of to-ing and fro-ing, it then staged a full recovery. However, consumer sentiment has deteriorated significantly over the past year, while business sentiment has been more robust.

According to the latest Westpac-Melbourne Institute survey conducted in the first week of November, household sentiment deteriorated again in November. Their Consumer Sentiment Index fell from October’s reading of 83.7 to 78.0, a reading which is well below the “normal” range and significantly lower than the long-term average reading of just over 101.

“Sentiment continues to plumb historic lows,” said Westpac Chief Economist Bill Evans. “This print of 78.0 is now below the low point of the GFC and only slightly higher than when the COVID pandemic first hit in April 2020. Prior to that, we need to go back to the deep recession in the early 1990s to find a weaker read.”

Any reading of the Consumer Sentiment Index below 100 indicates the number of consumers who are pessimistic is greater than the number of consumers who are optimistic.

Commonwealth Government bond yields moved substantially higher on the day, outpacing the overnight rises of their US Treasury counterparts. By the close of business, the 3-year ACGB yield had gained 14bps to 3.56% while 10-year and 20-year yield both finished 13bps higher at 4.05% and 4.40% respectively.

In the cash futures market, expectations regarding future rate rises firmed. At the end of the day, contracts implied the cash rate would rise from the current rate of 2.81% to average 2.995% in December and then increase to an average of 3.225% in February. May 2023 contracts implied a 3.815% average cash rate while August 2023 contracts implied 4.15%.

Evans noted respondents surveyed after the announcement of the RBA’s latest rate increase were generally more pessimistic than respondents surveyed prior to the announcement. However, he also suggested the Federal Budget may have played a part. “Consumers would also have been unnerved by forecasts in the Government’s October Budget showing electricity prices are expected to increase by 56% over the next two years.”

UBS economist George Tharenou expects pessimism in the household sector to eventually result in a fall in real household consumption figures. “At face value this is historically consistent with real consumption growth turning negative,” he said. “This indicates a very sharp slowing over coming months, albeit still likely only after the current very large boost from economic re-opening fades, which has been underpinned by a rapid drawdown of excess household savings.”

All five sub-indices registered lower readings, with the “Family finances – next 12 months” sub-index posting the largest monthly percentage loss.

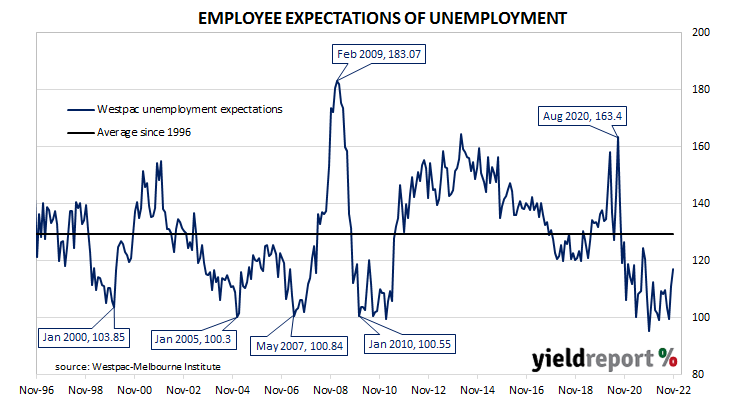
The Unemployment Expectations index, formerly a useful guide to RBA rate changes, rose from 111.3 to 117.3. Higher readings result from more respondents expecting a higher unemployment rate in the year ahead.

Business conditions “robust” but confidence slides in NAB October survey

08 November 2022

Summary: Business conditions deteriorate a touch in October; conditions “fairly robust” across states, sectors; confidence deteriorates, below long-term average; as many firms pessimistic as optimistic; ANZ: “strong result” reinforces need for RBA to raise cash rate to restrictive level; capacity utilisation rate steady, all 8 sectors of economy still above respective long-run averages.

NAB’s business survey indicated Australian business conditions were robust in the first half of 2018, with a cyclical-peak reached in April of that year. Readings from NAB’s index then began to slip and forecasts of a slowdown in the domestic economy began to emerge in the first half of 2019 as the index trended lower. It hit a nadir in April 2020 as pandemic restrictions were introduced but then conditions improved markedly over the next twelve months. Readings have been generally in a historically-normal range since then.

According to NAB’s latest monthly business survey of over 400 firms conducted over the last week of October, business conditions have deteriorated a touch, albeit to a still-elevated level. NAB’s conditions index registered 22, down 1 from September’s revised reading of 23.

“Conditions remain fairly robust across the states and across sectors,” said NAB Chief Economist Alan Oster. “There was something of a correction in wholesale and retail conditions this month from very high readings in the previous survey but they both remain at very strong levels, as do conditions in mining, transport and utilities and recreation and personal services.”

Business confidence also deteriorated. NAB’s confidence index fell from September’s revised reading of 4 to 0, a reading which is below the long-term average. Typically, NAB’s confidence index leads the conditions index by one month, although some divergences have appeared from time to time.

“Confidence is now below the long-run average at 0 index points, which effectively means that just as many firms in our survey are pessimistic as optimistic,” noted Oster.

Commonwealth Government bond yields moved substantially higher on the day, outpacing the overnight rises of their US Treasury counterparts. By the close of business, the 3-year ACGB yield had gained 14bps to 3.56% while 10-year and 20-year yield both finished 13bps higher at 4.05% and 4.40% respectively.

In the cash futures market, expectations regarding future rate rises firmed. At the end of the day, contracts implied the cash rate would rise from the current rate of 2.81% to average 2.995% in December and then increase to an average of 3.225% in February. May 2023 contracts implied a 3.815% average cash rate while August 2023 contracts implied 4.15%.

“Business conditions are still very strong, capacity utilisation is barely off its peak and cost and price growth remains elevated…” said ANZ economist Madeline Dunk. “We think the strong result reinforces the need for the RBA to take the cash rate to a restrictive 3.85% next year.”

NAB’s measure of national capacity utilisation remained at a historically-elevated level as it held steady at 85.8%. All eight sectors of the economy were reported to be operating above their respective long-run averages.

Capacity utilisation is generally accepted as an indicator of future investment expenditure and it also has a strong inverse relationship with the unemployment rate.

US October payrolls beats expectations but jobless rate rises

04 November 2022

Summary: Non-farm payrolls up 261,000 in October, greater than expected; previous two months’ figures revised up by 29,000; jobless rate rises to 3.7%, participation rate slips to 62.2%; “not much ‘signal’ in the current movement”; jobs-to-population ratio slips to 60.0%; underutilisation rate up from 6.7% to 6.8%; annual hourly pay growth slows from 5.0% to 4.7%.

The US economy ceased producing jobs in net terms as infection controls began to be implemented in March 2020. The unemployment rate had been around 3.5% but that changed as job losses began to surge through March and April of 2020. The May 2020 non-farm employment report represented a turning point and subsequent months provided substantial employment gains. Changes in recent months have been generally more modest but still above the average of the last decade.

According to the US Bureau of Labor Statistics, the US economy created an additional 261,000 jobs in the non-farm sector in October. The increase was greater than the 200,000 which had been generally expected but less than the 315,000 jobs which had been added in September after revisions. Employment figures for August and September were revised up by a total of 29,000.

The total number of unemployed increased by 306,000 to 6.059 million while the total number of people who are either employed or looking for work decreased by 22,000 to 164.667 million. These changes led to the US unemployment rate rising from 3.5% to 3.7% even as the participation rate slipped from September’s rate of 62.3% to 62.2%.

“The unemployment rate has been in a 3.5%–3.7% range for the past eight months, so there’s not much ‘signal’ in the current movement, especially with non-farm payrolls still posting reasonable monthly gains,” said ANZ Head of Australian Economics David Plank.

Chart of US unemployment rate over time

Short-term US Treasury yields fell back on the day while long-term yields increased. By the close of business, the 2-year yield had shed 3bps to 4.69%, the 10-year yield had inched up 1bp to 4.16% while the 30-year yield finished 6bps higher at 4.25%.

In terms of US Fed policy, expectations of higher federal funds rates over the next 12 months softened somewhat. At the close of business, contracts implied the effective federal funds rate would average 4.15% in December, 32bps higher than the current spot rate, and then climb to an average of 4.785% in February 2023. May 2023 futures contracts implied a 5.075% average effective federal funds rate while November 2023 contracts implied 4.90%.

One figure which is indicative of the “spare capacity” of the US employment market is the employment-to-population ratio. This ratio is simply the number of people in work divided by the total US population. It hit a cyclical-low of 58.2 in October 2010 before slowly recovering to just above 61% in late-2019. October’s reading slipped from 60.1% to 60.0%, some way from the April 2000 peak reading of 64.7%.

Apart from the unemployment rate, another measure of tightness in the labour market is the underutilisation rate and the latest reading of it registered 6.8%, up from 6.7% in September. Wage inflation and the underutilisation rate usually have an inverse relationship; hourly pay growth in the year to October declined from 5.0% to 4.7%.

Click for more news