News

“Supply constraints, not demand”; home approvals down 5.8% in September

02 November 2022

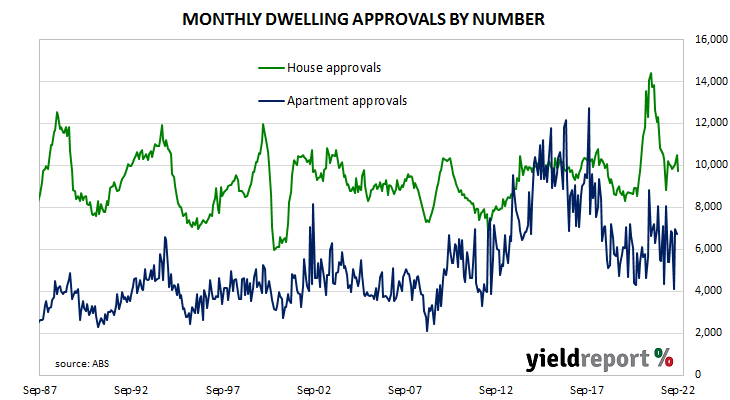
Summary: Home approval numbers down 5.8% in August, above expectations; 13.0% lower than September 2021; HomeBuilder effect unwound; higher interest rates yet to be felt; reflects supply constraints, not demand; house approvals down 7.5%, apartments down 3.1%; non-residential approvals up 3.7% in dollar terms, residential alterations down 2.9%.

Building approvals for dwellings, that is apartments and houses, headed south after mid-2018. As an indicator of investor confidence, falling approvals had presented a worrying signal, not just for the building sector but for the overall economy. However, approval figures from late-2019 and the early months of 2020 painted a picture of a recovery taking place, even as late as April of that year. Subsequent months’ figures then trended sharply upwards before falling back in 2021 and the first half of 2022.

The Australian Bureau of Statistics has released the latest figures from September which show total residential approvals fell by 5.8% on a seasonally-adjusted basis. The fall was not as great as the 10.0% decrease which had been generally expected and it contrasted with the 23.1% increase in August. Total approvals fell by 13.0% on an annual basis, below the previous month’s figure of -9.4%. Monthly growth rates are often volatile.

“The effect of HomeBuilder on approvals has unwound but approvals do not seem to be turning down as a result of higher interest rates yet,” said ANZ senior economist Adelaide Timbrell.

Commonwealth Government bond yields rose on the day, especially at the short end of the yield curve. By the close of business, the 3-year ACGB yield had gained 9bps to 3.39% while 10-year and 20-year yields both finished 4bps higher at 3.82% and 4.18% respectively.

In the cash futures market, expectations regarding future rate rises firmed. At the end of the day, contracts implied the cash rate would rise from the current rate of 2.81% to average 2.995% in December and then increase to an average of 3.235% in February. May 2023 contracts implied a 3.80% average cash rate while August 2023 contracts implied 4.00%.

“The current limitation on construction activity reflects supply constraints, not demand,” Timbrell noted.

Approvals for new houses fell by 7.5% over the month after rising by 4.5% in August. On a 12-month basis, house approvals were 10.4% lower than they were in September 2021, up from August’s comparable figure of -14.5%.

Apartment approval figures are usually a lot more volatile and September’s total declined by 3.1% after a 68.8% jump in August. The 12-month growth rate fell from August’s revised rate of -0.3% to -16.6%.

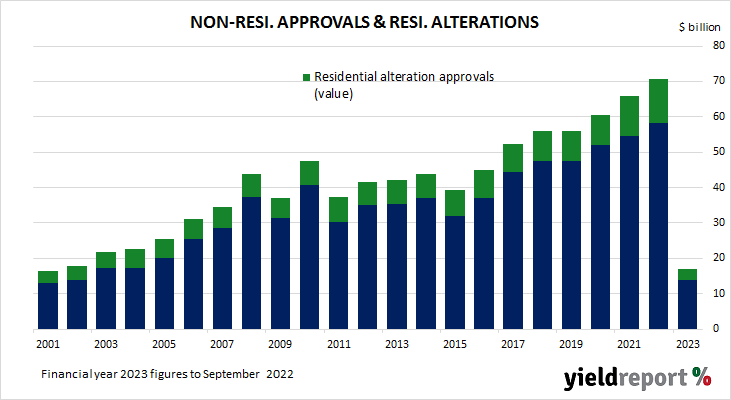
Non-residential approvals increased by 3.7% in dollar terms over the month and by 3.8% on an annual basis. Figures in this segment also tend to be rather volatile.

Residential alteration approvals declined by 2.9% in dollar terms over the month but were 5.7% higher than in September 2021.

September approvals data sinks; home lending to keep falling

02 November 2022

Summary: Value of loan commitments down 8.2% in September; 18.5% lower than September 2021; market correction “has further to run”; further reductions in borrowing capacity, loan sizes “still to come”; value of owner-occupier loan approvals down 9.3%, investor approvals down 6.0%; number of home loan approvals down 7.9%.

The number and value of approvals began to noticeably increase after the RBA reduced its cash rate target in a series of cuts beginning in mid-2019, potentially ending the downtrend which had been in place since mid-2017. Figures from February through to May of 2020 provided an indication the downtrend was still intact but subsequent figures then pushed both back to elevated levels in 2021.

September’s housing finance figures have now been released and total loan approvals excluding refinancing decreased by 8.2% In dollar terms over the month, lower than the 3.0% fall which had been generally expected and below August’s -3.4%. On a year-on-year basis, total approvals excluding refinancing fell by 18.5%, down from the previous month’s comparable figure of -12.5%.

“Overall, while the September fall in housing finance approvals was larger than expected, both the headline move and the detail was broadly in line with the wider picture of a market correction that has further to run,” said Westpac senior economist Matthew Hassan.

Chart of total monthly home loans approved by category over time

Commonwealth Government bond yields rose on the day, especially at the short end of the yield curve. By the close of business, the 3-year ACGB yield had gained 9bps to 3.39% while 10-year and 20-year yields both finished 4bps higher at 3.82% and 4.18% respectively.

In the cash futures market, expectations regarding future rate rises firmed. At the end of the day, contracts implied the cash rate would rise from the current rate of 2.81% to average 2.995% in December and then increase to an average of 3.235% in February. May 2023 contracts implied a 3.80% average cash rate while August 2023 contracts implied 4.00%.

“Rate hikes are hitting housing lending sharply,” observed ANZ senior economist Adelaide Timbrell. “Our new forecast of 3.85% for the peak cash rate implies further reductions in both borrowing capacity and loan sizes are still to come.”

The total value of owner-occupier loan commitments excluding refinancing decreased by 9.3%, down from August’s -2.7%. On an annual basis, owner-occupier loan commitments were 19.9% lower than in September 2021, below August’s comparable figure of -15.1%.

The total value of investor commitments excluding refinancing arrangements fell by 6.0%. The decline followed a 4.8% fall in August, taking the growth rate over the previous 12 months to -15.3%, down from -6.4%.

The total number of loan commitments (excluding refinancing loans) to owner-occupiers fell by 7.9% to 23,557. The fall was a larger one than August’s 0.4% decline and the annual contraction rate accelerated from -19.2% to -21.9%.

Chart of monthly owner-occupier loans by number

ISM PMI down again in October

01 November 2022

Summary: ISM PMI down, at 50.9% in October, slightly above expectations; ISM: reading corresponds to 0.5% US GDP growth annualised.

The Institute of Supply Management (ISM) manufacturing Purchasing Managers Index (PMI) reached a cyclical peak in September 2017. It then started a downtrend which ended in March 2020 with a contraction in US manufacturing which lasted until June 2020. Subsequent month’s readings implied growth had resumed, with the index becoming stronger through to March 2021. Since then, readings have declined steadily.

According to the ISM’s October survey, its PMI recorded a reading of 50.2%, slightly above the generally expected figure of 50.0% but below September’s 50.9%. The average reading since 1948 is 53.0% and any reading above 50% implies an expansion in the US manufacturing sector relative to the previous month.

“The US manufacturing sector continues to expand, but at the lowest rate since the pandemic recovery began,” said Timothy Fiore, Chair of the ISM’s Manufacturing Business Survey Committee.

Short-term US Treasury yields finished the day noticeably higher while longer-term yields fell. By the close of business, the 2-year Treasury bond yield had gained 7bps to 4.55%, the 10-year yield had slipped 1bp to 4.04% while the 30-year yield finished 11bps lower at 4.09%.

In terms of US Fed policy, expectations of higher federal funds rates over the next 12 months hardened. At the close of business, November contracts implied an effective federal funds rate of 3.785%, 71bps higher than the current spot rate while December contracts implied a rate of 4.17%. November 2023 futures contracts implied 4.755%, 168bps above the spot rate.

Fiore noted “four straight months of panellists’ companies reporting softening new orders rates” and stated this represented “companies adjusting to potential future lower demand.”

Purchasing managers’ indices (PMIs) are economic indicators derived from monthly surveys of executives in private-sector companies. They are diffusion indices, which means a reading of 50% represents no change from the previous period, while a reading under 50% implies respondents reported a deterioration on average. A reading “above 48.7%, over a period of time, generally indicates an expansion of the overall economy” according to the ISM.

The ISM’s manufacturing PMI figures appear to lead US GDP by several months despite a considerable error in any given month. The chart below shows US GDP on a “year on year” basis (and not the BEA annualised basis) against US GDP implied by monthly PMI figures. .

According to the ISM and its analysis of past relationships between the PMI and US GDP, October’s PMI corresponds to an annualised growth rate of 0.5%, or 0.1% over a quarter. Regression analysis on a year-on-year basis suggests a 12-month GDP growth rate of 2.5% five months after this latest report.

The ISM index is one of two monthly US PMIs, the other being an index published by S&P Global. S&P Global produces a “flash” estimate in the last week of each month which comes out about a week before the ISM index is published. The S&P Global flash October manufacturing PMI registered 49.9%, 2.1 percentage points lower than September’s final figure.

“Frustrating outcome” for Fed from September JOLTS report

01 November 2022

Summary: US quit rate steady at 2.7% in September; report a “frustrating outcome” for Fed; US short-term yields up, longer-term yields down; expectations of higher rates harden; quits, separations down, openings up.

The number of US employees who quit their jobs as a percentage of total employment increased slowly but steadily after the GFC. It peaked in March 2019 and then tracked sideways until virus containment measures were introduced in March 2020. The quit rate then plummeted as alternative employment opportunities rapidly dried up. Following the easing of US pandemic restrictions, it proceeded to recover back to its pre-pandemic rate in the third quarter of 2020 and trended higher through 2021 before easing in the first half of 2022.

Figures released as part of the most recent Job Openings and Labor Turnover Survey (JOLTS) report show the quit rate remained steady in September. 2.7% of the non-farm workforce left their jobs voluntarily, unchanged from August, even as quits fell by 123,000 and an additional 263,000 people were employed in non-farm sectors.

“The report is a frustrating outcome for the Fed, which had been hoping the increase in the funds rate so far would take some pressure off the labour market and wages,” said NAB Currency Strategist Rodrigo Catril. “The lack of softening in the JOLTS report alongside a still resilient ISM manufacturing, suggest the Fed still has a fair bit work to do in order to bring inflation to heal.”

Charts of US quit rate against US annual wage growth

Short-term US Treasury yields finished the day noticeably higher while longer term yields fell. By the close of business, the 2-year Treasury bond yield had gained 7bps to 4.55%, the 10-year yield had slipped 1bp to 4.04% while the 30-year yield finished 11bps lower at 4.09%.

In terms of US Fed policy, expectations of higher federal funds rates over the next 12 months hardened. At the close of business, November contracts implied an effective federal funds rate of 3.785%, 71bps higher than the current spot rate while December contracts implied a rate of 4.17%. November 2023 futures contracts implied 4.755%, 168bps above the spot rate.

The decline in total quits was led by 62,000 fewer resignations in the “Accommodation and food services” sector while the “Professional and business services” sector experienced the largest gain, increasing by 58,000. Overall, the total number of quits for the month fell from August’s revised figure of 4.184 million to 4.061 million.

Total vacancies at the end of September increased by 0.437 million, or 4.3%, from August’s revised figure of 10.280 million to 10.717 million. The rise was driven by a 215,000 increase in the “Accommodation and food services” sector as well as sizable increases in the “Health care and social assistance” and “Transportation, warehousing, and utilities” sectors while the “Wholesale trade” sector experienced the single largest decrease, falling by 104,000. Overall, 13 out of 18 sectors experienced more job openings than in the previous month.

NAB Head of FX Strategy, Ray Attrill, described the fall as ”the first meaningful sign of some cracks in the labour market.” However, he also said “the absolute levels are still consistent with a very tight labour market…” He noted “the Fed will undoubtedly welcome the tentative signs of easing demand for labour.”

Total separations decreased by 370,000, or 6.1%, from August’s revised figure of 6.058 million to 5.688 million. The fall was led by the “Accommodation and food services” sector where there were 103,000 fewer separations than in August. Separations decreased in 14 out of 18 sectors.

The “quit” rate time series produced by the JOLTS report is a leading indicator of US hourly pay. As wages account for around 55% of a product’s or service’s price in the US, wage inflation and overall inflation rates tend to be closely related. Former Federal Reserve chief and current Treasury Secretary Janet Yellen was known to pay close attention to it.

Higher prices: retail sales up 0.6% in September

31 October 2022

Summary: Retail sales up 0.6% in September, slightly greater than expected; recent monthly gains likely due to higher prices; detail suggests rate-rise effect coming through; largest influence on month from household goods sales.

Growth figures of domestic retail sales spent most of the 2010s at levels below the post-1992 average. While economic conditions had been generally favourable, wage growth and inflation rates were low. Expenditures on goods then jumped in the early stages of 2020 as government restrictions severely altered households’ spending habits. Households mostly reverted to their usual patterns as restrictions eased in the latter part of 2020 and throughout 2021, although not for all categories.

According to the latest ABS figures, total retail sales increased by 0.6% in September on a seasonally adjusted basis. The rise was slightly greater than the 0.5% increase which had been generally expected but in line with August’s result. On an annual basis, retail sales increased by 17.9%, down from August’s comparable figure of 19.2%.

“Note that the headline here is nominal sales, which includes changes due to price variations,” said Westpac senior economist Matthew Hassan. “Indeed, almost all of the recent monthly gains are likely due to higher prices rather than volumes.”

Commonwealth Government bond yields moved modestly higher on the day. By the close of business, the 3-year ACGB yield had crept up 1bps to 3.34% while 10-year and 20-year yields both finished 2bps higher at 3.77% and 4.10% respectively.

In the cash futures market, expectations regarding future rate rises firmed a touch on average. At the end of the day, contracts implied the cash rate would rise from the current rate of 2.31% to average 2.845% in November and then increase to an average of 3.05% in November. May 2023 contracts implied a 3.82% average cash rate while August 2023 contracts implied 3.945%.

“While price effects are difficult to disentangle, the detail does suggest there may be a rate rise effect coming through over and above the direct ‘eroding’ effect of higher prices,” added Hassan.

Retail sales are typically segmented into six categories (see below), with the “food” segment accounting for nearly 40% of total sales. This segment was the largest influence on the total during the month as sales increased by 1.0% on average over the month and thus contributed 0.39 percentage points of the 0.62% increase.

October Inflation Gauge slows, posts 0.4%

31 October 2022

Summary: Melbourne Institute Inflation Gauge index up 0.4% in October; up 5.2% on annual basis.

The Melbourne Institute’s Inflation Gauge is an attempt to replicate the ABS consumer price index (CPI) on a monthly basis. It has turned out to be a reliable leading indicator of the CPI, although there are periods in which the Inflation Gauge and the CPI have diverged for as long as twelve months. On average, the Inflation Gauge’s annual rate tends to overestimate the ABS rate by around 0.1%.

The Melbourne Institute’s latest reading of its Inflation Gauge index indicates consumer prices increased by 0.4% in October. The rise follows a 0.5% increase in September and a 0.5% fall in August. On an annual basis, the index rose by 5.2%, up from 5.0% in September.

Commonwealth Government bond yields moved modestly higher on the day. By the close of business, the 3-year ACGB yield had crept up 1bps to 3.34% while 10-year and 20-year yields both finished 2bps higher at 3.77% and 4.10% respectively.

In the cash futures market, expectations regarding future rate rises firmed a touch on average. At the end of the day, contracts implied the cash rate would rise from the current rate of 2.31% to average 2.845% in November and then increase to an average of 3.05% in November. May 2023 contracts implied a 3.82% average cash rate while August 2023 contracts implied 3.945%.

Central bankers desire a certain level of inflation which is “sufficiently low that it does not materially distort economic decisions in the community” but high enough so it does not constrain “a central bank’s ability to combat recessions.” Hence the recent obsession among central banks, including the RBA, to bring inflation back to their various targets.

“Further confirmation of anticipated slowing” from Sep. lending growth figures

31 October 2022

Summary: Private sector credit up 0.7% in September, in line with expectations; annual growth rate accelerates from 9.3% to 9.4%; provides further confirmation of anticipated slowing; “business credit growth will cool appreciably” as firms reduce investment in 2023; business loans account for nearly 60% of net growth.

The pace of lending to the non-bank private sector by financial institutions in Australia followed a steady-but-gradual downtrend from late-2015 through to early 2020 before hitting what appears to be a nadir in March 2021. That downtrend ended later in the same year and now annual growth rates are above the peak seen in the previous decade.

According to the latest RBA figures, private sector credit increased by 0.7% in September. The result was in line with expectations but slightly slower than August’s 0.8% rise. On an annual basis, the growth rate accelerated from 9.3% in August to 9.4%.

“The September private sector update provided further confirmation of the anticipated slowing in the face of rapidly rising interest rates,” observe Westpac senior economist Andrew Hanlan.

Commonwealth Government bond yields moved modestly higher on the day. By the close of business, the 3-year ACGB yield had crept up 1bps to 3.34% while 10-year and 20-year yields both finished 2bps higher at 3.77% and 4.10% respectively.

In the cash futures market, expectations regarding future rate rises firmed a touch on average. At the end of the day, contracts implied the cash rate would rise from the current rate of 2.31% to average 2.845% in November and then increase to an average of 3.05% in November. May 2023 contracts implied a 3.82% average cash rate while August 2023 contracts implied 3.945%.

“With the economy set to slow sharply in 2023, impacted by high inflation and rising interest rates, non-mining firms will likely cut equipment investment and business credit growth will cool appreciably,” forecasted Hanlan.

Business lending accounted for nearly 60% of the net growth over the month while owner-occupier lending accounted just over 30%. Investor loans and personal loans both increased modestly.

The traditional driver of overall loan growth, the owner-occupier segment, grew by 0.5% over the month, the same growth rate as in August and July. The sector’s 12-month growth rate slowed again, this time from 8.0% to 7.8%.

Total lending in the business sector increased by 1.3%, up from the 1.2% increase recorded in August. Growth on an annual basis accelerated from 14.1% to 14.7%.

Monthly growth in the investor-lending segment slowed to a halt in early 2018. Shortly into the 2019/20 financial year, monthly growth rates slipped into the red before posting a series of flat or near-flat results until mid-2020. In September, net lending grew by 0.3%, down from August’s revised rate of 0.4%. The 12-month growth rate slowed from 6.6% to 6.4%.

Total personal loans were unchanged in percent terms, down from 0.3% in August, taking the annual growth rate from -0.6% to 0.1%. This category of debt includes fixed-term loans for large personal expenditures, credit cards and other revolving credit facilities.

September core PCE inflation up 0.5%; still rising but at slower rate

28 October 2022

Summary: US core PCE price index up 0.5% in September, in line with expectations; annual rate accelerates from 4.9% to 5.1%; core inflation rising but at slightly slower rate; Treasury yields up; Fed rate-rise expectations harden.

One of the US Fed’s favoured measures of inflation is the change in the core personal consumption expenditures (PCE) price index. After hitting the Fed’s target at the time of 2.0% in mid-2018, the annual rate then hovered in a range between 1.8% and 2.0% before it eased back to a range between 1.5% and 1.8% through 2019. It then plummeted below 1.0% in April 2020 before rising back to around 1.5% in the September quarter of that year. It has since increased significantly above the Fed’s target.

The latest figures have now been published by the Bureau of Economic Analysis as part of the September personal income and expenditures report. Core PCE prices rose by 0.5% over the month, in line with expectations as well as August’s result after it was revised down from 0.6%. On a 12-month basis, the core PCE inflation rate accelerated from August’s figure of 4.9% to 5.1%.

“Core inflation is still rising but at a slightly slower rate,” said ANZ rates strategist Gregorius Steven.

Chart of core PCE inflation over time

US Treasury bond yields increased materially on the day. By the close of business, the 2-year Treasury bond yield had gained 11bps to 4.40%, the 10-year yield had added 9bps to 4.01% while the 30-year yield finished 6bps higher at 4.14%.

In terms of US Fed policy, expectations of a higher federal funds rate over the next 12 months hardened. At the close of business, November contracts implied an effective federal funds rate of 3.775%, 70bps higher than the current spot rate while December contracts implied a rate of 4.155%. September 2023 futures contracts implied 4.595%, 152bps above the spot rate.

The core version of PCE strips out energy and food components, which are volatile from month to month, in an attempt to identify the prevailing trend. It is not the only measure of inflation used by the Fed; the Fed also tracks the Consumer Price Index (CPI) and the Producer Price Index (PPI) from the Department of Labor. However, it is the one measure which is most often referred to in FOMC minutes.

US GDP growth back in black despite demand slowdown

27 October 2022

Summary: US GDP up 0.6% (2.6% annualised) in September quarter, essentially in line with expectations; confirms deceleration in private domestic demand; GDP price deflator annual rate falls from 7.6% to 7.1%.

US GDP growth slowed in the second quarter of 2019 before stabilising at about 0.5% per quarter. At the same time, US bond yields suggested future growth rates would be below trend. The US Fed agreed and it reduced its federal funds range three times in the second half of 2019. Pandemic restrictions in the June quarter of 2020 sent parts of the US economy into hibernation; the lifting of those same restrictions sparked a rapid recovery which lasted until 2022.

The US Bureau of Economic Analysis has now released the September quarter’s “advance” GDP estimates and they indicate the US economy expanded by 0.6% or at an annualised rate of 2.6%. The expansion was essentially in line with the 0.6% increase (2.3% annualised) which had been generally expected but in contrast with the June quarter’s -0.1% after revisions.

ANZ economist Jack Chambers said the details of the report “confirmed a deceleration in private domestic demand…This is the main driver of GDP and has been moderating for five quarters now, following the economy’s reopening.”

Chart of US GDP growth over time

US GDP numbers are published in a manner which is different to most other countries; quarterly figures are compounded to give an annualised figure. In countries such as Australia and the UK, an annual figure is calculated by taking the latest number and comparing it with the figure from the same period in the previous year. The diagram above shows US GDP once it has been expressed in the normal manner, as well as the annualised figure.

US Treasury bond yields fell on the day, especially at the short end of the yield curve. By the close of business, the 2-year Treasury bond yield had shed 13bps to 4.29%, the 10-year yield had lost 8bps to 3.92% while the 30-year yield finished 6bps lower at 4.08%.

In terms of US Fed policy, expectations for a higher federal funds rate over the next 12 months softened. At the close of business, November contracts implied an effective federal funds rate of 3.785%, 70bps higher than the current spot rate while December contracts implied 4.15%. May 2023 futures contracts implied an effective federal funds rate of 4.805% and November 2023 contracts implied 4.46%.

One part of the report which is often overlooked are the figures regarding the GDP price deflator, which is another measure of inflation. The GDP price deflator is restricted to new, domestically-produced goods and services and it is not based on a fixed basket as is the case for the consumer price index (CPI). The annual rate fell from the June quarter’s revised figure of 7.6% to 7.1%.

Conf. Board confidence index resumes falling, outlook “dismal”

25 October 2022

Summary: Conference Board Consumer Confidence Index falls in October, above expectations; views of present conditions, short-term outlook both deteriorate; consumers’ short-term outlook “dismal”.

US consumer confidence clawed its way back to neutral over the five years after the GFC in 2008/2009 and then went from strength to strength until late 2018. Measures of consumer confidence then oscillated within a relatively narrow band at historically high levels until they plunged in early 2020. Subsequent readings then fluctuated around the long-term average until March 2021 when they reached elevated levels. However, a noticeable gap has since opened between the two most-widely followed surveys.

The latest Conference Board survey held during the first three weeks of October indicated US consumer confidence has deteriorated after improving for two months. October’s Consumer Confidence Index registered 102.5 on a preliminary basis, lower than the median consensus figure of 105.5 as well as September’s final figure of 107.8.

Consumers’ views of present conditions and the near-future both improved again. The Present Situation Index increased from August’s revised figure of 145.3 to 149.6 while the Expectations Index rose from a revised figure of 75.8 to 80.3.

US Treasury yields finished the day higher. By the close of business, the 2-year Treasury bond yield had gained 3bps to 4.48%, the 10-year yield had added 1bp to 4.18% while the 30-year yield finished 5bps higher at 4.34%.

In terms of US Fed policy, expectations of higher federal funds rates over the next 12 months softened a little. At the close of business, November contracts implied an effective federal funds rate of 3.80%, 72bps higher than the current spot rate while December contracts implied a rate of 4.19%. November 2023 futures contracts implied 4.67%, 159bps above the spot rate.

Consumers’ views of present conditions and the near-future both deteriorated. The Present Situation Index fell from September’s revised figure of 150.2 to 138.9 while the Expectations Index declined from a revised figure of 79.5 to 78.1.

“Consumers’ expectations regarding the short-term outlook remained dismal,” said Lynn Franco, a senior director at The Conference Board. “The Expectations Index is still lingering below a reading of 80, a level associated with recession, suggesting recession risks appear to be rising.”

The Consumer Confidence Survey is one of two widely followed monthly US consumer sentiment surveys which produce sentiment indices. The Conference Board’s index is based on perceptions of current business and employment conditions, as well as respondents’ expectations of conditions six months in the future. The other survey, conducted by the University of Michigan, is similar and it is used to produce an Index of Consumer Sentiment. That survey differs in that it does not ask respondents explicitly about their views of the labour market and it also includes some longer-term questions.

Click for more news