News

“First sign of stability” from October ifo index

25 October 2022

Summary: ifo business climate index slips in October, slightly above expected figure; German companies’ sentiment “grim; “first sign of stability” following gas price’s sharp fall; current conditions index down, expectations index up; expectations index implies euro-zone GDP contraction of 9.6% in year to January.

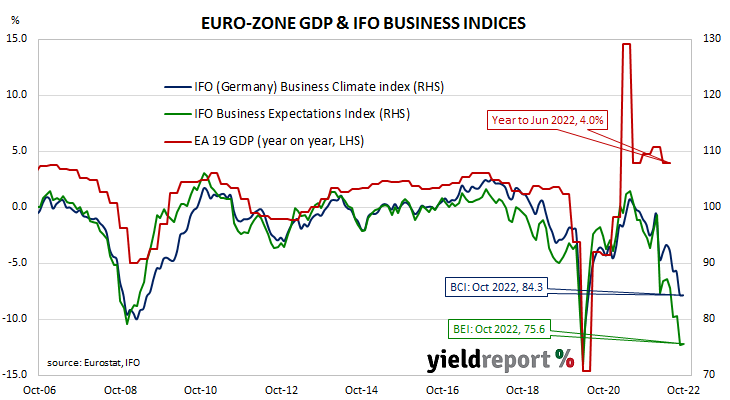
Following a recession in 2009/2010, the ifo Institute’s Business Climate Index largely ignored the European debt-crisis of 2010-2012, mostly posting average-to-elevated readings through to early-2020. However, the index was quick to react in the March 2020 survey, falling precipitously. Readings through much of 2021 generally fluctuated around the long-term average before dropping away this year.

According to the latest report released by ifo, German business sentiment has stabilised, at least in the short-term, at a level slightly better than it was in April 2020. October’s Business Climate Index recorded a reading of 84.3, higher than the consensus expectation of 83.5 but down a touch from September’s final reading of 84.4. The average reading since January 2005 is just above 97.

“Sentiment in the German economy continues to be grim,” said Clemens Fuest, President of the ifo Institute. ”The German economy is facing a difficult winter.”

German firms’ views of current conditions deteriorated slightly while their outlook improved a little. The current situation index declined from September’s figure of 94.5 to 94.1 while the expectations index crept up from 75.3 after revisions to 75.6.

German and French long-term bond yields both fell noticeably on the day. By the close of business, the German bund yield had shed 14bps to 2.18% and the French 10-year bond rates had lost 15bps to 2.71%.

“This is the first sign of stability in four months and may have been influenced by the recent sharp fall in European gas prices,” noted ANZ economist Kishti Sen

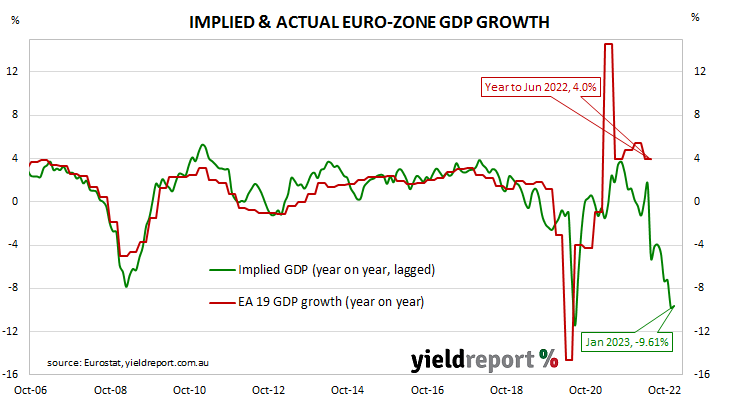
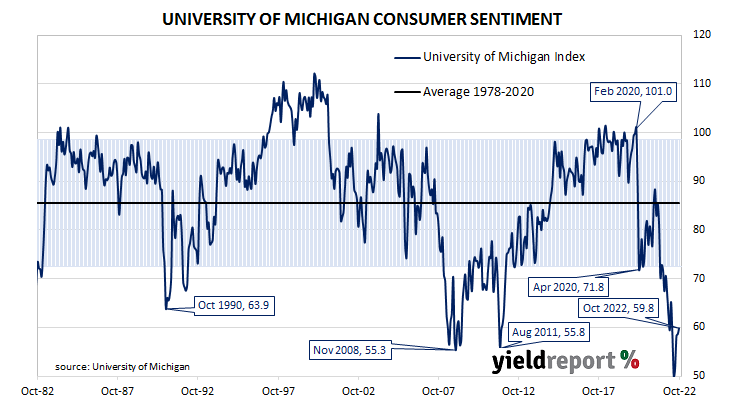
The ifo Institute’s business climate index is a composite index which combines German companies’ views of current conditions with their outlook for the next six months. It has similarities to consumer sentiment indices in the US such as the ones produced by The Conference Board and the University of Michigan.

It also displays a solid correlation with euro-zone GDP growth rates. However, the expectations index is a better predictor as it has a higher correlation when lagged by one quarter. October’s expectations index implies a 9.6% year-on-year GDP contraction to the end of January.

Conference Board leading index: US recession “increasingly likely before year-end”

20 October 2022

Summary: Conference Board leading index down 0.4% in September, lower than expected; suggests recession “increasingly likely before year-end”; Conference Board forecasts 1.5% GDP growth in 2022; regression analysis implies 0.8% US GDP growth to December.

The Conference Board Leading Economic Index (LEI) is a composite index composed of ten sub-indices which are thought to be sensitive to changes in the US economy. The Conference Board describes it as an index which attempts to signal growth peaks and troughs; turning points in the index have historically occurred prior to changes in aggregate economic activity. Readings from March and April of 2020 signalled “a deep US recession” while subsequent readings indicated the US economy would recover rapidly. More recent readings have trended lower, implying implied lower US GDP growth rates.

The latest reading of the LEI indicates it decreased by 0.4% in September. The result was lower than the 0.3% fall which had been generally expected as well as August’s revised flat result.

“The US LEI fell again in September and its persistent downward trajectory in recent months suggests a recession is increasingly likely before year-end,” said Ataman Ozyildirim, Senior Director, Economics, at The Conference Board.

standardised Conference Board leading index chart against standardised US GDP

US Treasury bond yields moved considerably higher on the day. By the close of business, the 2-year Treasury yield had gained 12bps to 4.60%, the 10-year yield had added 11bps to 4.17% while the 30-year yield finished 10bps higher at 4.16%.

In terms of US Fed policy, expectations of a steeper path for the federal funds rate over the next 12 months firmed. At the close of business, November contracts implied an effective federal funds rate of 3.805%, 73bps higher than the current spot rate while December contracts implied 4.23%. November 2023 futures contracts implied an effective federal funds rate of 4.84%, 176bps above the spot rate.

Ozyildirim said The Conference Board’s current forecast for US GDP in 2022 is 1.5% “amid high inflation, slowing labour markets, rising interest rates and tighter credit conditions.” GDP growth in 2023 is expected to further slow in the first half.

Regression analysis suggests the latest reading implies a 0.8% year-on-year growth rate in December, down from November’s revised figure of 1.3%.

chart of US GDP growth implied by leading index regression analysis against US GDP growth

September Westpac-MI leading index weakest since pandemic hit

19 October 2022

Summary:Leading index growth rate down again in September; weakest since pandemic first hit; reading implies annual GDP growth of around 1.60%; ACGB yields finish higher; rate-rise expectations firm; consistent with economic slowdown in 2023.

Westpac and the Melbourne Institute describe their Leading Index as a composite measure which attempts to estimate the likely pace of Australian economic growth in the short-term. After reaching a peak in early 2018, the index trended lower through 2018 and 2019 before plunging to recessionary levels in the second quarter of 2020. Subsequent readings spiked towards the end of 2020 but then trended lower through 2021 and 2022.

The September reading of the six month annualised growth rate of the indicator registered -1.15%, down from August’s figure of -0.33% after it was revised from -0.38%.

“The Leading Index continues to point to a material loss in momentum to a below-trend growth pace heading into 2023,” said Westpac Chief Economist Bill Evans. “The September Leading Index read is the weakest since the pandemic first hit in 2020 and, prior to that, since early 2016.”

Index figures represent rates relative to “trend” GDP growth, which is generally thought to be around 2.75% per annum in Australia. The index is said to lead GDP by “three to nine months into the future” but the highest correlation between the index and actual GDP figures occurs with a three-month lead. The current reading thus represents an annual GDP growth rate of around 1.60% at the end of the December quarter.

Leading index growth rate down again September; weakest since pandemic first hit; reading implies annual GDP growth of around 1.60%; ACGB yields finish higher; rate-rise expectations firm; consistent with economic slowdown in 2023.

Domestic Treasury bond yields moved higher on the day. By the close of business, the 3-year ACGB yield had gained 5bps to 3.58% while 10-year and 20-year yields both finished 3bps higher at 3.97% and 4.28% respectively.

In the cash futures market, expectations of higher rates firmed. At the end of the day, contracts implied the cash rate would rise from the current rate of 2.56% to 2.82% in November and then increase to 3.025% in December. May 2023 contracts implied a 3.84% cash rate while August 2023 contracts implied 4.02%.

Evans said this latest result is consistent with Westpac’s forecast of an economic slowdown in 2023. Westpac expects 3.4% GDP growth for calendar 2022 but only 1.0% GDP growth in 2023, driven by “sharp slowdown in consumer spending” as interest rates rise and the labour market softens.

Not expected to persist: US industrial output surprises in September

18 October 2022

Summary: US industrial output up 0.4% in September, above market expectations; up 5.3% over past 12 months; goes against ISM data signal, not expected to persist; capacity utilisation rate up 0.2ppts to 80.3%, slightly above long-term average.

The Federal Reserve’s industrial production (IP) index measures real output from manufacturing, mining, electricity and gas company facilities located in the United States. These sectors are thought to be sensitive to consumer demand and so some leading indicators of GDP use industrial production figures as a component. US production collapsed through March and April of 2020 before recovering the ground lost over the fifteen months to July 2021.

According to the Federal Reserve, US industrial production expanded by 0.4% on a seasonally adjusted basis in September. The result contrasted with the 0.1% decline which had been generally expected as well as August’s 0.1% decrease after it was revised up from -0.2%. On an annual basis the growth rate accelerated from August’s revised figure of 3.9% to 5.3%.

“These results go against the signal in the ISM data, which has been on a softening trajectory for some months now,” said ANZ Head of FX Research Mahjabeen Zaman. “Part of the strength in manufacturing of late has been an auto production catch-up story, and therefore isn’t expected to persist.“

US industrial output up 0.4% in September, above market expectations; up 5.3% over past 12 months; goes against ISM data signal, not expected to persist; capacity utilisation rate up 0.2ppts to 80.3%, slightly above long-term average.

Long-term US Treasury bond yields moved higher on the day while short-term yields declined. By the close of business, the 10-year Treasury yield had added 2bps to 3.99% and the 30-year yield had gained 5bps to 4.01%. The 20-year yield finished 1bp lower at 4.44%.

In terms of US Fed policy, expectations of a steeper path for the federal funds rate over the next 12 months softened. At the close of business, November contracts implied an effective federal funds rate of 3.80%, 72bps higher than the current spot rate while December contracts implied 4.21%. November 2023 futures contracts implied an effective federal funds rate of 4.625%, about 145bps above the spot rate.

The same report includes US capacity utilisation figures which are generally accepted as an indicator of future investment expenditure and/or inflationary pressures. Capacity usage had hit a high for the last business cycle in early 2019 before it began a downtrend which ended with April 2020’s multi-decade low of 64.2%. September’s reading increased from August’s revised figure of 80.1% to 80.3%, slightly above the long-term average of 80.0%.

While the US utilisation rate’s correlation with the US jobless rate is solid, it is not as high as the comparable correlation in Australia.

US retail spending “remains firm” despite flat September

14 October 2022

Summary: US retail sales flat in September, less than expected; annual growth rate slows from 9.4% to 8.2%; spending “remains firm”; short-term Treasury bond yields up, longer term yields down; rate rise expectations firm; falls in seven of thirteen retail categories; gas station segment largest single influence on month’s result.

US retail sales had been trending up since late 2015 but, commencing in late 2018, a series of weak or negative monthly results led to a drop-off in the annual growth rate below 2.0%. Growth rates then increased in trend terms through 2019 and into early 2020 until pandemic restrictions sent it into negative territory. A “v-shaped” recovery then took place which was followed by some short-term spikes as federal stimulus payments hit US households in the first and second quarters of 2021.

According to the latest “advance” numbers released by the US Census Bureau, total retail sales remained flat in percentage terms in September. The result was less than the 0.2% increase which had been generally expected and below August’s +0.4% after it was revised up from 0.3%. On an annual basis, the growth rate slowed from August’s revised figure of 9.4% to 8.2%.

“Retail spending remains firm, supported of late by lower gas prices and households dipping into their large saving balances,” said NAB currency strategist Rodrigo Catril.

Short-term US Treasury bond yields moved considerably higher on the day while longer-term yields moved lower. By the close of business, the 2-year Treasury yield had gained 10bps to 4.42% while 10-year and 30-year yields each finished 3bps lower at 3.90% and 3.88% respectively.

In terms of US Fed policy, expectations of a steeper path for the federal funds rate over the next 12 months firmed. At the close of business, November contracts implied an effective federal funds rate of 3.805%, 73bps higher than the current spot rate. December contracts implied 4.22% while September 2023 futures contracts implied an effective federal funds rate of 4.86%, nearly 180bps above the spot rate.

Seven of the thirteen categories recorded lower sales over the month. The “Gasoline stations” segment provided the largest single influence on the overall result, falling by 1.4% over the month. “Non-store” sales had the largest single positive influence on the month’s result after sales in the segment increased by 0.5%.

The non-store segment includes vending machine sales, door-to-door sales and mail-order sales but nowadays this segment has become dominated by online sales. It now accounts for 16% of all US retail sales and it is the second-largest segment after vehicles and parts.

“Unambiguous bad news” regarding inflation in UoM October sentiment report

14 October 2022

Summary: University of Michigan consumer confidence index improves slightly in October, above consensus expectations; views of present conditions improves, future conditions deteriorate; “improvement remains tentative”; “unambiguous bad news” regarding inflation expectations.

US consumer confidence started 2020 at an elevated level but, after a few months, surveys began to reflect a growing unease with the global spread of COVID-19 and its reach into the US. Household confidence plunged in April 2020 and then recovered in a haphazard fashion, generally fluctuating at below-average levels according to the University of Michigan. The University’s measure of confidence had recovered back to the long-term average by April 2021 but then it plunged again in the September quarter and has since remained at historically low levels.

The latest survey conducted by the University indicates confidence among US households improved slightly on average in October. The preliminary reading of the Index of Consumer Sentiment registered 59.8, above the generally expected figure of 58.8 as well as September’s final figure of 58.6. Consumers’ views of current conditions improved while expectations regarding future conditions deteriorated in comparison to those held at the time of the September survey.

“Sentiment is now 9.8 points above the all-time low reached in June but this improvement remains tentative, as the expectations index declined by 3% from last month,” said the University’s Surveys of Consumers Director Joanne Hsu. “Continued uncertainty over the future trajectory of prices, economies and financial markets around the world indicate a bumpy road ahead for consumers.”

Short-term US Treasury bond yields moved considerably higher on the day while longer-term yields moved lower. By the close of business, the 2-year Treasury yield had gained 10bps to 4.42% while 10-year and 30-year yields each finished 3bps lower at 3.90% and 3.88% respectively.

ANZ rates strategist Gregorius Steven said “there was also unambiguous bad news” regarding inflation expectations in the report. “One year ahead inflation expectations rose from 4.7% to 5.1%, and the five-to-ten-year measure also ticked up, to close to 3%.”

It was once thought less-confident households are generally inclined to spend less and save more; some decline in household spending could be expected to follow. However, recent research suggests the correlation between household confidence and retail spending is quite weak.

“No ease in inflationary pressures” evident in latest US CPI report

13 October 2022

Summary: US CPI up 0.4% in September, more than expected; “core” rate up 0.6%; core inflation highest in 40 years, “no ease in inflationary pressures”; Treasury yields up during volatile day, rate rise harden noticeably; non-energy services main driver, adds 0.46 ppts.

The annual rate of US inflation as measured by changes in the consumer price index (CPI) halved from nearly 3% in the period from July 2018 to February 2019. It then fluctuated in a range from 1.5% to 2.0% through 2019 before rising above 2.0% in the final months of that year. Substantially lower rates were reported from March 2020 to May 2020 and they remained below 2% until March 2021. Rates have since risen significantly.

The latest CPI figures released by the Bureau of Labor Statistics indicated seasonally-adjusted consumer prices increased by 0.4% on average in September. The result was above the generally expected figure of 0.2% as well as August’s 0.1% increase. On a 12-month basis, the inflation rate remained steady at 8.2%.

“Headline” inflation is known to be volatile and so references are often made to “core” inflation for analytical purposes. The core prices index, the index which excludes the more variable food and energy components, increased by 0.6% on a seasonally-adjusted basis for the month. The rise was greater than the 0.4% expected but in line with August’s figure, taking the annual growth rate from 6.3% to 6.7%.

“The core CPI print was the highest in 40 years with the monthly reading lifting to 0.6%, implying no ease in inflationary pressures yet, with five of the past six months coming in at that rate or higher,” said NAB currency strategist Rodrigo Catril.

US CPI up 0.4% in September, more than expected; “core” rate up 0.6%; core inflation highest in 40 years, “no ease in inflationary pressures”; Treasury yields up during volatile day, rate rise harden noticeably; non-energy services main driver, adds 0.46 ppts.

US Treasury bond yields closed higher after experiencing a volatile day. By the close of business, the 2-year Treasury yield had gained 4bps to 4.32%, the 10-year yield had inched up 1bp to 3.93% while the 30-year yield returned to its starting point at 3.91%.

In terms of US Fed policy, expectations of higher federal funds rates over the next 12 months noticeably hardened. At the close of business, November contracts implied an effective federal funds rate of 3.815%, 73bps higher than the current spot rate. December contracts implied 4.22% while September 2023 futures contracts implied an effective federal funds rate of 4.77%, nearly 170bps above the spot rate.

The largest influence on headline results is often the change in fuel prices. Prices of “Energy commodities”, the segment which contains vehicle fuels, decreased by 4.7% and subtracted 0.22 percentage points. However, prices of non-energy services, the segment which includes actual and implied rents, had the largest effect on the total, adding 0.46 percentage points after increasing by 0.8% on average.

“Strong inflation narrative” continues; US September PPI up 0.4%

12 October 2022

Summary: US producer price index (PPI) up 0.4% in September, double expected figure; annual rate slows to 8.5%; “core” PPI up 0.3%; figures “little respite” from “strong inflation narrative”; “will put pressure on Fed to continue to aggressively hike rates”; Treasury yields decline, rate-rise expectations soften.

Around the end of 2018, the annual inflation rate of the US producer price index (PPI) began a downtrend which continued through 2019. Months in which producer prices increased suggested the trend may have been coming to an end, only for it to continue, culminating in a plunge in April 2020. Figures returned to “normal” towards the end of that year but annual rates through 2021 and 2022 have been well above the long-term average.

The latest figures published by the Bureau of Labor Statistics indicate producer prices increased by 0.4% after seasonal adjustments in September. The rise was double the 0.2% increase which had been generally expected and in contrast with August’s -0.2% after revisions. On a 12-month basis, the rate of producer price inflation after seasonal adjustments slowed from 8.6% in August to 8.5%.

Producer prices excluding foods and energy, or “core” PPI, rose by 0.3% after seasonal adjustments. The increase was in line with expectations as well as August’s rise. The annual rate accelerated slightly, from August’s revised figure of 7.2% to 7.3%.

Ray Attrill, NAB’s Head of FX Strategy within its FICC division said the figures “offered little respite from the strong inflation narrative…”

US producer price index (PPI) up 0.4% in September, double expected figure; annual rate slows to 8.5%; “core” PPI up 0.3%; figures “little respite” from “strong inflation narrative”; “will put pressure on Fed  to continue to aggressively hike rates”; Treasury yields decline, rate-rise expectations soften.

US Treasury bond yields generally declined on the day. By the close of business, 2-year and 10-year Treasury yields had each lost 3bps to 4.28% and 3.92% respectively while the 30-year yield finished unchanged at 3.91%.

In terms of US Fed policy, expectations of the path of the federal funds rate over the next 12 months generally softened. At the close of business, November contracts implied an effective federal funds rate of 3.765%, nearly 70bps higher than the current spot rate. December contracts implied 4.14% while September 2023 futures contracts implied an effective federal funds rate of 4.555%, almost 150bps above the spot rate.

“The ongoing strength in prices will put pressure on the Fed Reserve to continue to aggressively hike rates,” said ANZ economist Madeline Dunk.

The producer price index is a measure of prices received by producers for domestically produced goods, services and construction. It is put together in a fashion similar to the consumer price index (CPI) except it measures prices received from the producer’s perspective rather than from the perspective of a retailer or a consumer. It is another one of the various measures of inflation tracked by the US Fed, along with core personal consumption expenditure (PCE) price data.

Euro-zone production up 1.5% in August; “may not last”

12 October 2022

Summary: Euro-zone industrial production up 1.5% in August, greater than expected; annual growth rate swings from -2.5% to +2.5%; rebound “may not last”; German, French 10-year yields increase slightly; expansion in three of euro-zone’s four largest economies.

Following a recession in 2009/2010 and the debt-crisis which flowed from it, euro-zone industrial production recovered and then reached a peak four years later in 2016. Growth rates then fluctuated for two years before beginning a steady and persistent slowdown from the start of 2018. That decline was transformed into a plunge in March and April of 2020 which then took over a year to claw back. Production levels in more-recent months have generally stagnated.

According to the latest figures released by Eurostat, euro-zone industrial production expanded by 1.5% in August on a seasonally-adjusted and calendar-adjusted basis. The rise was greater than the 1.3% increase which had been generally expected and in contrast with July’s 2.3% fall after revisions. The calendar-adjusted growth rate on an annual basis swung from July’s revised rate of -2.5% to +2.5%.

“The rebound…may not last, as energy-intense factories are constrained by the energy shortage and high input prices,” said ANZ economist Madeline Dunk.

German and French sovereign bond yields moved slightly higher on the day. By the close of business, the German 10-year bund yield had inched up 1bp to 2.32% while the French 10-year OAT yield finished 2bps higher at 2.92%.

Industrial production expanded in three of the euro-zone’s four largest economies but not in the largest of them. Germany’s production shrank by 0.5% over the month while the growth figures for France, Spain and Italy were +2.5%, +5.7% and +2.3% respectively.

“Deeply pessimistic”; WBCMI sentiment index falls back in October

11 October 2022

Summary: Household sentiment deteriorates in October; “in deeply pessimistic territory”; would have been “significantly worse” had RBA delivered 50bps increase; three of five sub-indices lower; more respondents expecting higher jobless rate.

After a lengthy divergence between measures of consumer sentiment and business confidence in Australia which began in 2014, confidence readings of the two sectors converged again in mid-July 2018. Both measures then deteriorated gradually in trend terms, with consumer confidence leading the way. Household sentiment fell off a cliff in April 2020 but, after a few months of to-ing and fro-ing, it then staged a full recovery. However, consumer sentiment has deteriorated significantly over the past year, while business sentiment has been more robust.

According to the latest Westpac-Melbourne Institute survey conducted in early October, household sentiment has deteriorated after a brief improvement in September. Their Consumer Sentiment Index declined from September’s reading of 84.4 to 83.7, a reading which is well below the “normal” range and significantly lower than the long-term average reading of just over 101.

“The Index remains in deeply pessimistic territory at a level comparable to the lows briefly reached during the pandemic and the extended weakness experienced during the Global Financial Crisis,” said Westpac Chief Economist Bill Evans.

Any reading of the Consumer Sentiment Index below 100 indicates the number of consumers who are pessimistic is greater than the number of consumers who are optimistic.

Commonwealth Government bond yields moved substantially higher on the day. By the close of business, the 3-year ACGB yield had gained 11bps to 3.62%, the 10-year yield had jumped 17bps to 4.06% while the 20-year yield finished 19bps higher at 4.34%.

In the cash futures market, expectations regarding future rate rises hardly changed. At the end of the day, contracts implied the cash rate would rise from the current rate of 2.56% to average 2.795% in November and then increase to an average of 2.975% in December. May 2023 contracts implied a 3.755% average cash rate while August 2023 contracts implied 3.92%.

Evans noted the index would have been “significantly worse” had the Reserve Bank delivered a 50bps increase instead of the 25bps rise announced. Respondents surveyed after the announcement were generally less pessimistic than respondents surveyed prior to the announcement.

Three of the five sub-indices registered lower readings, with the “Economic conditions – next 12 months” sub-index posting the largest monthly percentage loss. Readings of the “Family finances – next 12 months” and “Time to buy a major household item” sub-indices both improved.

The Unemployment Expectations index, formerly a useful guide to RBA rate changes, rose from 99.6 to 111.3. Higher readings result from more respondents expecting a higher unemployment rate in the year ahead.

Click for more news