News

Business “far from pessimistic” in NAB’s September survey

11 October 2022

Summary: Business conditions improve in September, adds to recent string of elevated readings; consumers “still finding ways” to spend; confidence deteriorates, just below long-term average; businesses “far from pessimistic”; forward indicators remain “strong”; capacity utilisation rate declines, all 8 sectors of economy still above respective long-run averages.

NAB’s business survey indicated Australian business conditions were robust in the first half of 2018, with a cyclical-peak reached in April of that year. Readings from NAB’s index then began to slip and forecasts of a slowdown in the domestic economy began to emerge in the first half of 2019 as the index trended lower. It hit a nadir in April 2020 as pandemic restrictions were introduced but then conditions improved markedly over the next twelve months. Readings have been generally in a historically-normal range since then.

According to NAB’s latest monthly business survey of over 400 firms conducted over the last week of September, business conditions have improved again, adding to the recent string of elevated readings. NAB’s conditions index registered 25, up from August’s revised reading of 22.

“Conditions are now higher than their pre-COVID peak, which shows just how strong demand is at present,” said NAB Chief Economist Alan Oster. “Clearly, consumers are still finding a way to keep spending, with the very strong labour market, savings buffers and a broader post-pandemic recovery all playing a role.”

In contrast, business confidence deteriorated. NAB’s confidence index fell back from August’s reading of 10 to 5, a reading which is just below the long-term average. Typically, NAB’s confidence index leads the conditions index by one month, although some divergences have appeared from time to time.

Oster noted the confidence index “has been volatile recently” but still said “…businesses are far from pessimistic.”

Commonwealth Government bond yields moved substantially higher on the day. By the close of business, the 3-year ACGB yield had gained 11bps to 3.62%, the 10-year yield had jumped 17bps to 4.06% while the 20-year yield finished 19bps higher at 4.34%.

In the cash futures market, expectations regarding future rate rises hardly changed. At the end of the day, contracts implied the cash rate would rise from the current rate of 2.56% to average 2.795% in November and then increase to an average of 2.975% in December. May 2023 contracts implied a 3.755% average cash rate while August 2023 contracts implied 3.92%.

ANZ economist Madeline Dunk noted the fall in NAB’s confidence index “is not yet reflected in the hard data, with the survey’s forward indicators remaining strong.” She pointed to rises in the survey’s capex and forward orders indices, as well as capacity utilisation’s elevated reading, stating, “This points to a strong outlook for business in the near term.”

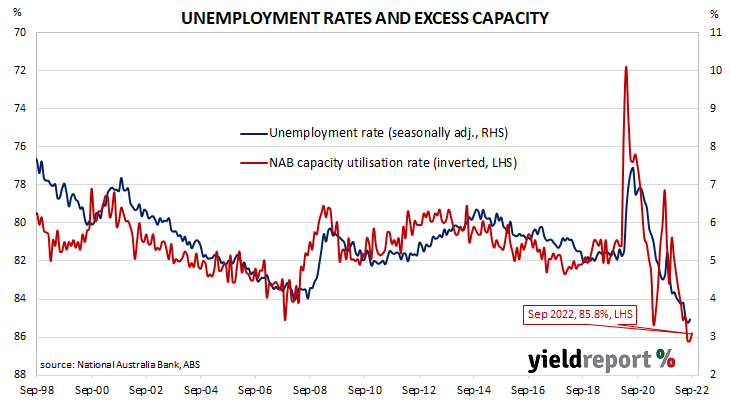
NAB’s measure of national capacity utilisation remained at an historically-elevated level as it declined from August’s revised figure of 86.2% to 85.8%. All eight sectors of the economy were still reported to be operating above their respective long-run averages.

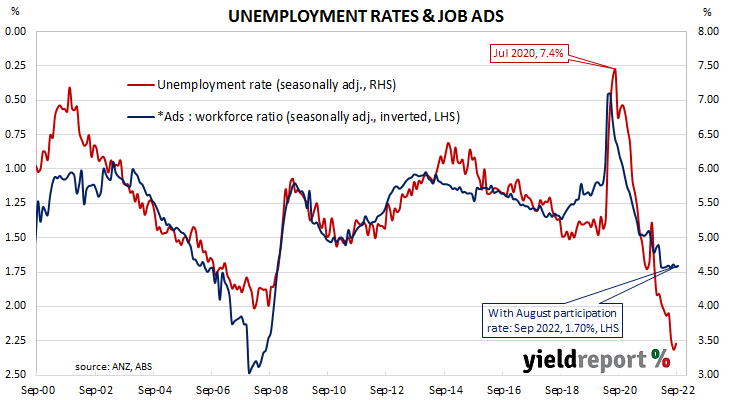
Capacity utilisation is generally accepted as an indicator of future investment expenditure and it also has a strong inverse relationship with the unemployment rate.

US September non-farm payrolls “too solid” for Fed “pivot”

07 October 2022

Summary: Non-farm payrolls up 263,000 in September, slightly more than expected; previous two months’ figures revised up by 11,000; jobless rate falls to 3.5%, participation rate slips to 62.3%; too solid to support a ‘pivot’ narrative; jobs-to-population ratio steady at 60.1%; underutilisation rate falls from 7.0% to 6.7%; annual hourly pay growth slows from 5.2% to 5.0%.

The US economy ceased producing jobs in net terms as infection controls began to be implemented in March 2020. The unemployment rate had been around 3.5% but that changed as job losses began to surge through March and April of 2020. The May 2020 non-farm employment report represented a turning point and subsequent months provided substantial employment gains. Changes in recent months have been generally more modest but still above the average of the last decade.

According to the US Bureau of Labor Statistics, the US economy created an additional 263,000 jobs in the non-farm sector in September. The increase slightly more than the 250,000 which had been generally expected but less than the 315,000 jobs which had been added in August after revisions. Employment figures for July and August were revised up by a total of 11,000.

The total number of unemployed decreased by 261,000 to 5.753 million while the total number of people who are either employed or looking for work decreased by 57,000 to 164.689 million. These changes led to the US unemployment rate falling from 3.7% to 3.5% as the participation rate slipped from August’s rate of 62.4% to 62.3%.

“It was ‘good news is bad news’ for US Payrolls which were a touch better than expected and seen as too solid to support a ‘pivot’ narrative,” said NAB senior economist Tapas Strickland.

Non-farm payrolls up 263,000 in September, slightly more than expected; previous two months’ figures revised up by 11,000; jobless rate falls to 3.5%, participation rate slips to 62.3%; too solid to support a ‘pivot’ narrative; jobs-to-population ratio steady at 60.1%; underutilisation rate falls from 7.0% to 6.7%; annual hourly pay growth slows from 5.2% to 5.0%.

US Treasury yields rose noticeably on the day. By the close of business, the 2-year yield had gained 12bps to 4.48%, the 10-year yield had added 7bps to 3.85% while the 30-year yield finished 4bps higher at 3.81%.

In terms of US Fed policy, expectations of a steeper path for the federal funds rate over the next 12 months hardened. At the close of business, November contracts implied an effective federal funds rate of 3.76%, 68bps higher than the current spot rate, while December contracts implied 4.145%. September 2023 futures contracts implied an effective federal funds rate of 4.48%, 140bps above the spot rate.

“The drop in job openings in August does suggest labour demand may be easing from the unprecedented levels seen recently, but there’s a long way to go before the labour market will be in a better, that is, less inflationary, balance,” said ANZ Head of Australian Economic David Plank.

One figure which is indicative of the “spare capacity” of the US employment market is the employment-to-population ratio. This ratio is simply the number of people in work divided by the total US population. It hit a cyclical-low of 58.2 in October 2010 before slowly recovering to just above 61% in late-2019. September’s reading remained unchanged at 60.1%, still some way from the April 2000 peak reading of 64.7%.

Apart from the unemployment rate, another measure of tightness in the labour market is the underutilisation rate and the latest reading of it registered 6.7%, down from 7.0% in August. Wage inflation and the underutilisation rate usually have an inverse relationship; however, hourly pay growth in the year to September still declined from 5.2% to 5.0%.

“First meaningful sign” of cracks in US jobs market: August JOLTS

04 October 2022

Summary: US quit rate steady at 2.7% in August; US bond yields fall substantially, expectations of higher rates firm; “first meaningful sign” of cracks in labour market; quits, separations up, openings down.

The number of US employees who quit their jobs as a percentage of total employment increased slowly but steadily after the GFC. It peaked in March 2019 and then tracked sideways until virus containment measures were introduced in March 2020. The quit rate then plummeted as alternative employment opportunities rapidly dried up. Following the easing of US pandemic restrictions, it proceeded to recover back to its pre-pandemic rate in the third quarter of 2020 and trended higher through 2021 before easing in the first half of 2022.

Figures released as part of the most recent Job Openings and Labor Turnover Survey (JOLTS) report show the quit rate remained steady in August. 2.7% of the non-farm workforce left their jobs voluntarily, unchanged from July, as quits rose by 100,000 and an additional 315,000 people were employed in non-farm sectors.

US quit rate steady at 2.7% in August; US bond yields fall substantially, expectations of higher rates firm; “first meaningful sign” of cracks in labour market; quits, separations up, openings down.

US Treasury yields finished the day substantially lower. By the close of business, the 2-year Treasury bond yield had shed 21bps to 4.01%, the 10-year yield had lost 23bps to 3.58% while the 30-year yield finished 12bps lower at 3.65%.

In terms of US Fed policy, expectations of higher federal funds rates over the next 12 months firmed slightly. At the close of business, November contracts implied an effective federal funds rate of 3.725%, 65bps higher than the current spot rate while December contracts implied a rate of 4.035%. September 2023 futures contracts implied 4.32%, 134bps above the spot rate.

The rise in total quits was led by 119,000 more resignations in the “Accommodation and food services” sector while the “Professional and business services” sector experienced the largest fall, decreasing by 98,000. Overall, the total number of quits for the month rose from July’s revised figure of 4.058 million to 4.158 million.

Total vacancies at the end of August dropped by 1.117 million, or 10.0%, from July’s revised figure of 11.170 million to 10.053 million. The fall was driven by a 236,000 decrease in the “Health care and social assistance” sector and a 183,000 fall in the “Other services” sector while the “Construction” sector experienced the single largest increase, rising by 54,000. Overall, 14 out of 18 sectors experienced fewer job openings than in the previous month.

NAB Head of FX Strategy, Ray Attrill, described the fall as ”the first meaningful sign of some cracks in the labour market.” However, he also said “the absolute levels are still consistent with a very tight labour market…” He noted “the Fed will undoubtedly welcome the tentative signs of easing demand for labour.”

Total separations increased by 182,000, or 3.1%, from July’s revised figure of 5.794 million to 5.976 million. The rise was led by the “Accommodation and food services” sector where there were 175,000 more separations than in July. Separations increased in 11 out of 18 sectors.

The “quit” rate time series produced by the JOLTS report is a leading indicator of US hourly pay. As wages account for around 55% of a product’s or service’s price in the US, wage inflation and overall inflation rates tend to be closely related. Former Federal Reserve chief and current Treasury Secretary Janet Yellen was known to pay close attention to it.

Home approvals jump in August after July plunge

04 October 2022

Summary: Home approval numbers up 28.1% in July, above expectations; 9.5% lower than August 2021; strong increase in units “suggest some appetite and ability” to continue providing new supply; non-high rise resilience questions extent of drag on growth from policy tightening, other factors; house approvals up 3.7%, apartments up 98.6%; non-residential approvals up 15.1% in dollar terms, residential alterations up 5.4%.

Building approvals for dwellings, that is apartments and houses, headed south after mid-2018. As an indicator of investor confidence, falling approvals had presented a worrying signal, not just for the building sector but for the overall economy. However, approval figures from late-2019 and the early months of 2020 painted a picture of a recovery taking place, even as late as April of that year. Subsequent months’ figures then trended sharply upwards before falling back in 2021 and the first half of 2022.

The Australian Bureau of Statistics has released the latest figures from August and total residential approvals rebounded by 28.1% on a seasonally-adjusted basis. The rise was significantly greater than the 9.0% increase which had been generally expected and in contrast with the 18.2% fall in July. Total approvals fell by 9.5% on an annual basis, above the previous month’s figure of -25.5%. Monthly growth rates are often volatile.

“As this is a very volatile series, we can’t make too much of the August jump, though the very strong increase in units does suggest some appetite and ability on the part of developers to continue providing new supply in response to tight rental markets, despite instability in the construction sector,” said ANZ senior economist Adelaide Timbrell.

The figures were released on the same day as the RBA’s smaller-than-expected 25bps increase of its cash rate target and Commonwealth Government bond yields fell significantly. By the close of business, the 3-year ACGB yield had shed 34bps to 3.34%, the 10-year yield had lost20bps to 3.75% while the 20-year yield finished 13bps lower at 4.04%.

In the cash futures market, expectations regarding future rate rises eased considerably. At the end of the day, contracts implied the cash rate would rise from the current rate of 2.56% to average 2.78% in November and then increase to an average of 2.93% in December. May 2023 contracts implied a 3.555% average cash rate while August 2023 contracts implied 3.565%.

“While there are clearly volatility issues that still need to be resolved, the resilience of non-high rise segments to date continues to question the extent to which policy tightening and other factors will lead to a significant drag on growth from new dwelling investment,” said Westpac senior economist Matthew Hassan.

Approvals for new houses increased by 3.7% over the month after rising by 1.1% in July. However, on a 12-month basis, house approvals were still 14.9% lower than they were in August 2021, up from July’s comparable figure of -16.9%.

Apartment approval figures are usually a lot more volatile and August’s total nearly doubled, up 98.6% after a 47.3% drop in July. The 12-month growth figure recovered from July’s revised rate of -42.8% to +0.2%.

Non-residential approvals increased by 15.1% in dollar terms over the month but decreased by 10.5% on an annual basis. Figures in this segment also tend to be rather volatile.

Residential alteration approvals increased by 5.4% in dollar terms over the month but were 8.8% lower than in August 2021.

“More weakening to come”; home loan approvals down 3.4% in August

04 October 2022

Summary: Value of loan commitments down 1.4% in August; 20.7% lower than August 2021; “more weakening to come”; “some interesting ‘wrinkles’ from first-home buyers, construction-related finance approvals”; value of owner-occupier loan approvals down 2.7%, investor approvals down 4.8%; number of home loan approvals down 0.4%.

The number and value of approvals began to noticeably increase after the RBA reduced its cash rate target in a series of cuts beginning in mid-2019, potentially ending the downtrend which had been in place since mid-2017. Figures from February through to May of 2020 provided an indication the downtrend was still intact but subsequent figures then pushed both back to elevated levels in 2021.

August’s housing finance figures have now been released and total loan approvals excluding refinancing decreased by 3.4% In dollar terms over the month, slightly higher than the 4.0% fall which had been generally expected and above July’s -8.5%. On a year-on-year basis, total approvals excluding refinancing fell by 12.5%, down from the previous month’s comparable figure of -11.3%.

“Approvals are now 19.6% below their peak at the start of the year. The latest data on turnover and prices, available up to September, points to more weakening to come,” said Westpac senior economist Matthew Hassan.

Value of loan commitments down 1.4% in August; 20.7% lower than August 2021; “more weakening to come”; “some interesting ‘wrinkles’ from first-home buyers, construction-related finance approvals”; value of owner-occupier loan approvals down 2.7%, investor approvals down 4.8%; number of home loan approvals down 0.4%.

The figures were released on the same day as the RBA’s smaller-than-expected 25bps increase of its cash rate target and Commonwealth Government bond yields fell significantly. By the close of business, the 3-year ACGB yield had shed 34bps to 3.34%, the 10-year yield had lost 20bps to 3.75% while the 20-year yield finished 13bps lower at 4.04%.

Hassan noted “some interesting ‘wrinkles’ around first-home buyers and construction-related finance approvals.” Loan approvals for first-home buyers rose by 7.0% while approvals for the purchase of newly built dwellings fell by 11.3%.

The total value of owner-occupier loan commitments excluding refinancing decreased by 2.7%, up from July’s -7.0%. On an annual basis, owner-occupier loan commitments were 15.1% lower than in August 2021, below July’s comparable figure of -7.0%.

The total value of investor commitments excluding refinancing arrangements fell by 4.8%. The decline followed an 11.2% decrease in July, taking the growth rate over the previous 12 months to -6.4%, down from zero.

The total number of loan commitments (excluding refinancing loans) to owner-occupiers decreased by 0.4% to 29303. The decline was a smaller one than July’s 5.8% fall and the annual contraction rate slowed slightly, from -21.4% to -19.2%.

September job ads “holding up well” despite rate rises

04 October 2022

Summary: Job ads down 0.5% in September; 22.3% higher than September 2021; advertisements “holding up well” several months into rate hike cycle; RBA may have to take cash rate further into restrictive territory to slow demand growth; ads-to-workforce ratio steady at 1.7%.

From mid-2017 onwards, year-on-year growth rates in the total number of Australian job advertisements consistently exceeded 10%. That was until mid-2018 when the annual growth rate fell back markedly. 2019 was notable for its reduced employment advertising and this trend continued into the first quarter of 2020. Advertising plunged in April and May of 2020 as pandemic restrictions took effect but then recovered quite quickly.

According to the latest ANZ figures, total advertisements decreased by 0.5% in September on a seasonally adjusted basis. The fall followed a 1.5% gain in August and a 1.7% decline in July after revisions. On a 12-month basis, total job advertisements were 22.3% higher than in September 2021, up from August’s revised figure of 20.3%.

“It shouldn’t be a surprise that ANZ Job Ads is holding up so well several months into the rate hike cycle,” said ANZ senior economist Catherine Birch. “New Zealand’s job ads series, Jobs Online, is yet to turn down, despite the RBNZ commencing tightening seven months earlier than the RBA.”

Job ads down 0.5% in September; 22.3% higher than September 2021; advertisements “holding up well” several months into rate hike cycle; RBA may have to take cash rate further into restrictive territory to slow demand growth; ads-to-workforce ratio steady at 1.7%.

The figures were released on the same day as the RBA’s smaller-than-expected 25bps increase of its cash rate target and Commonwealth Government bond yields fell significantly. By the close of business, the 3-year ACGB yield had shed 34bps to 3.34%, the 10-year yield had lost20bps to 3.75% while the 20-year yield finished 13bps lower at 4.04%.

In the cash futures market, expectations regarding future rate rises eased considerably. At the end of the day, contracts implied the cash rate would rise from the current rate of 2.56% to average 2.78% in November and then increase to an average of 2.93% in December. May 2023 contracts implied a 3.555% average cash rate while August 2023 contracts implied 3.565%.

“The fact that ANZ Job Ads and other leading indicators of Australia’s labour market are still so strong suggests the RBA may have to take the cash rate further into restrictive territory than we currently expect to slow demand growth,” explained Birch.

The inverse relationship between job advertisements and the unemployment rate has been quite strong (see below chart), although ANZ themselves called the relationship between the two series into question in early 2019. A rising number of job advertisements as a proportion of the labour force is suggestive of lower unemployment rates in the near future while a falling ratio suggests higher unemployment rates will follow. September’s ads-to-workforce ratio remained unchanged at 1.7%.

In 2008/2009, advertisements plummeted and Australia’s unemployment rate jumped from 4% to nearly 6% over a period of 15 months. When a more dramatic fall in advertisements took place in April 2020, the unemployment rate responded much more quickly.

ISM PMI “at lowest rate since recovery began” in September

03 October 2022

Summary: ISM PMI down to 50.9% in September, below expectations; US manufacturing still expanding, at lowest rate since recovery began; “companies adjusting to potential future lower demand”; ISM recession indicator at lowest since height of pandemic; ISM: reading corresponds to 0.8% annualised growth rate.

The Institute of Supply Management (ISM) manufacturing Purchasing Managers Index (PMI) reached a cyclical peak in September 2017. It then started a downtrend which ended in March 2020 with a contraction in US manufacturing which lasted until June 2020. Subsequent month’s readings implied growth had resumed, with the index becoming stronger through to March 2021. Since then, readings have declined steadily.

According to the ISM’s September survey, its PMI recorded a reading of 50.9%, below the generally expected figure of 52.4% as well as August’s 52.8. The average reading since 1948 is 53.0% and any reading above 50% implies an expansion in the US manufacturing sector relative to the previous month.

“The US manufacturing sector continues to expand, but at the lowest rate since the pandemic recovery began,” said Timothy Fiore, Chair of the ISM’s Manufacturing Business Survey Committee.

US Treasury yields rose noticeably on the day. By the close of business, the 2-year Treasury bond yield had gained 7bps to 4.22%, the 10-year yield had added 10bps to 3.81% while the 30-year yield finished 11bps higher at 3.77%.

In terms of US Fed policy, expectations of higher federal funds rates over the next 12 months generally softened. At the close of business, November contracts implied an effective federal funds rate of 3.715%, 64bps higher than the current spot rate while December contracts implied a rate of 4.015%. September 2023 futures contracts implied 4.32%, 124bps above the spot rate.

Fiore noted “four straight months of panellists’ companies reporting softening new orders rates” and stated this represented “companies adjusting to potential future lower demand.”

Tapas Strickland, NAB Head of Market Economics, also looked at latest reading of the New Orders index and expressed a potentially more-pessimistic view. “An ISM recession indicator which takes the difference between New Orders and Inventories is now at -8.4, its lowest since the height of the pandemic.”

Purchasing managers’ indices (PMIs) are economic indicators derived from monthly surveys of executives in private-sector companies. They are diffusion indices, which means a reading of 50% represents no change from the previous period, while a reading under 50% implies respondents reported a deterioration on average. A reading “above 48.7%, over a period of time, generally indicates an expansion of the overall economy” according to the ISM.

The ISM’s manufacturing PMI figures appear to lead US GDP by several months despite a considerable error in any given month. The chart below shows US GDP on a “year on year” basis (and not the BEA annualised basis) against US GDP implied by monthly PMI figures. .

According to the ISM and its analysis of past relationships between the PMI and US GDP, September’s PMI corresponds to an annualised growth rate of 0.8%, or 0.2% over a quarter. Regression analysis on a year-on-year basis suggests a 12-month GDP growth rate of 2.6% five months after this latest report.

The ISM index is one of two monthly US PMIs, the other being an index published by S&P Global. S&P Global produces a “flash” estimate in the last week of each month which comes out about a week before the ISM index is published. The S&P Global flash September manufacturing PMI registered 51.8%, 0.5 percentage points higher than August’s final figure.

Inflation Gauge resumes rising, up 0.5% in September

03 October 2022

Summary: Melbourne Institute Inflation Gauge index up 0.5% in September; up 5.0% on annual basis.

The Melbourne Institute’s Inflation Gauge is an attempt to replicate the ABS consumer price index (CPI) on a monthly basis. It has turned out to be a reliable leading indicator of the CPI, although there are periods in which the Inflation Gauge and the CPI have diverged for as long as twelve months. On average, the Inflation Gauge’s annual rate tends to overestimate the ABS rate by around 0.1%.

The Melbourne Institute’s latest reading of its Inflation Gauge index indicates consumer prices increased by 0.5% in September. The rise follows a 0.5% decrease in August and increases of 1.2% and 0.3% in July and June respectively. On an annual basis, the index rose by 5.0%, up from 4.9% in August.

Commonwealth Government bond yields moved modestly higher on the day despite sizable falls in US Treasury yields on Friday night. By the close of business, the 3-year ACGB yield had inched up 1bp to 3.68%, the 10-year yield had gained 3bps to 3.95% while the 20-year yield finished 4bps higher at 4.17%.

In the cash futures market, expectations regarding future rate rises firmed a touch. At the end of the day, contracts implied the cash rate would rise from the current rate of 2.31% to average 2.70% in October and then increase to an average of 3.085% in November. May 2023 contracts implied a 4.125% average cash rate while August 2023 contracts implied 4.135%.

Given the Inflation Gauge’s tendency to overestimate, the latest figures imply an official CPI reading of -0.2% (seasonally adjusted) for the September quarter or 4.9% in annual terms. However, it is worth noting the annual CPI rate to the end of June was 6.1% while the Inflation Gauge had implied a 4.6% annual rate at the time.

Signs of US goods inflation pressures “easing”; core PCE inflation up 0.6% in August

30 September 2022

Summary: US core PCE price index up 0.6% in August, slightly above expectations; annual rate accelerates from 4.7% to 4.9%; “growing signs” goods inflation pressures easing, slowing earnings growth “key”; Treasury yields down; Fed rate-rise expectations firm.

One of the US Fed’s favoured measures of inflation is the change in the core personal consumption expenditures (PCE) price index. After hitting the Fed’s target at the time of 2.0% in mid-2018, the annual rate then hovered in a range between 1.8% and 2.0% before it eased back to a range between 1.5% and 1.8% through 2019. It then plummeted below 1.0% in April 2020 before rising back to around 1.5% in the September quarter of that year. It has since increased significantly above the Fed’s target.

The latest figures have now been published by the Bureau of Economic Analysis as part of the August personal income and expenditures report. Core PCE prices rose by 0.6% over the month, slightly above expectations but considerably more than July’s flat result after it was revised down from 0.1%. On a 12-month basis, the core PCE inflation rate accelerated from July’s revised figure of 4.7% to 4.9%.

“There are growing signs of easing goods inflation pressures but slowing earnings growth will be key to giving the Fed confidence inflation will fall back to target,” said NAB economist Taylor Nugent.

US Treasury bond yields fell on the day. By the close of business, the 2-year Treasury bond yield had lost 5bps to 4.15%, the 10-year yield had shed 13bps to 3.71% while the 30-year yield finished 12bps lower at 3.66%.

In terms of US Fed policy, expectations of a higher federal funds rate over the next 12 months firmed slightly. At the close of business, November contracts implied an effective federal funds rate of 3.705%, 63bps higher than the current spot rate while December contracts implied a rate of 4.01%. September 2023 futures contracts implied 4.385%, 131bps above the spot rate.

The core version of PCE strips out energy and food components, which are volatile from month to month, in an attempt to identify the prevailing trend. It is not the only measure of inflation used by the Fed; the Fed also tracks the Consumer Price Index (CPI) and the Producer Price Index (PPI) from the Department of Labor. However, it is the one measure which is most often referred to in FOMC minutes.

August lending growth fastest annual pace since 2008

30 September 2022

Summary: Private sector credit up 0.8% in August, greater than 0.6% expected; annual growth rate accelerates from 9.1% to 9.3%; fastest annual pace since October 2008; business loans account for over 55% of net growth.

The pace of lending to the non-bank private sector by financial institutions in Australia followed a steady-but-gradual downtrend from late-2015 through to early 2020 before hitting what appears to be a nadir in March 2021. That downtrend ended later in the same year and now annual growth rates are above the peak seen in the previous decade.

According to the latest RBA figures, private sector credit increased by 0.8% in August. The result was greater than the 0.6% increase which had been generally expected but in line with July’s rise. On an annual basis, the growth rate accelerated from 9.1% in July to 9.3%.

Westpac senior economist Andrew Hanlan noted the result “is the fastest annual pace since October 2008, albeit it is well below the 2007 pre-GFC peak of 16.5%.”

Commonwealth Government bond yields fell on the day, following the lead of US Treasury markets overnight. By the close of business, the 3-year ACGB yield had lost 7bps to 3.67%, the 10-year yield had shed 5bps to 3.92% while the 20-year yield finished 6bps lower at 4.13%.

In the cash futures market, expectations regarding future rate rises softened slightly. At the end of the day, contracts implied the cash rate would rise from the current rate of 2.31% to average 2.695% in October and then increase to an average of 3.09% in November. May 2023 contracts implied a 4.09% average cash rate while August 2023 contracts implied 4.095%.

Business lending accounted for over 55% of the net growth over the month while owner-occupier lending accounted most of the balance. Investor loans and personal loans both increased a little.

The traditional driver of overall loan growth, the owner-occupier segment, grew by 0.6% over the month, up from July’s 0.5% increase. The sector’s 12-month growth rate slowed again, this time from 8.3% to 8.0%.

Total lending in the business sector increased by 1.2%, down from the 1.5% increase recorded in July. Growth on an annual basis accelerated from 13.4% to 14.1%.

Monthly growth in the investor-lending segment slowed to a halt in early 2018. Shortly into the 2019/20 financial year, monthly growth rates slipped into the red before posting a series of flat or near-flat results until mid-2020. In August, net lending grew by 0.5%, up from the 0.4% rise in July. The 12-month growth rate ticked up from 6.5% to 6.6%.

Total personal loans grew by 0.3%, in line with July’s result, resulting in a slowing the annual contraction rate from 1.5% to 0.6%. This category of debt includes fixed-term loans for large personal expenditures, credit cards and other revolving credit facilities.

Click for more news