01 September 2022
Summary: ISM PMI unchanged in August, slightly above expectations; manufacturing sector still expanding at same rate, new order rates now growing; reading implies 3.1% 12-month growth rate in January.
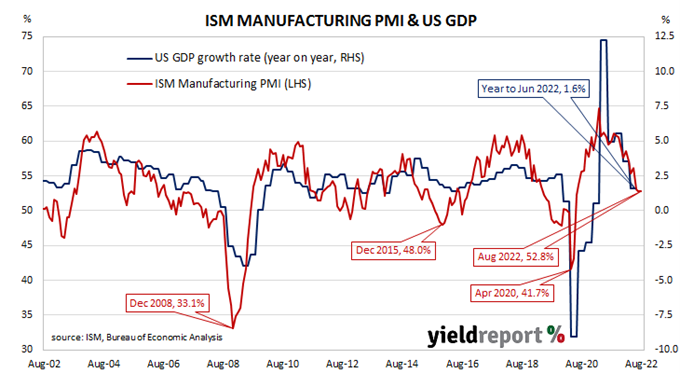
The Institute of Supply Management (ISM) manufacturing Purchasing Managers Index (PMI) reached a cyclical peak in September 2017. It then started a downtrend which ended in March 2020 with a contraction in US manufacturing which lasted until June 2020. Subsequent month’s readings implied growth had resumed, with the index becoming stronger through to March 2021. Since then, readings have remained at levels associated with solid economic growth despite some recent declines.
According to the ISM’s August survey, its PMI recorded a reading of 52.8%, slightly above the generally expected figure of 52.1% but unchanged from July’s figure. The average reading since 1948 is 53.0% and any reading above 50% implies an expansion in the US manufacturing sector relative to the previous month.
“The US manufacturing sector continues expanding at rates similar to the prior two months,” said Timothy Fiore, Chair of the ISM’s Manufacturing Business Survey Committee. “New order rates returned to expansion levels, supplier deliveries remain at appropriate tension levels and prices softened again, reflecting movement toward supply/demand balance.”
US Treasury yields rose noticeably on the day. By the close of business, the 2-year Treasury bond yield had gained 9bps to 3.51%, the 10-year yield had added 7bps to 3.26% while the 30-year yield finished 6bps higher at 3.36%.
In terms of US Fed policy, expectations of higher federal funds rates over the next 12 months hardened. At the close of business, September contracts implied an effective federal funds rate of 2.54%, 21bps higher than the current spot rate while November contracts implied a rate of 3.47%. July 2023 futures contracts implied 3.915%, 159bps above the spot rate.
Purchasing managers’ indices (PMIs) are economic indicators derived from monthly surveys of executives in private-sector companies. They are diffusion indices, which means a reading of 50% represents no change from the previous period, while a reading under 50% implies respondents reported a deterioration on average.
A reading “above 48.7%, over a period of time, generally indicates an expansion of the overall economy” according to the ISM.
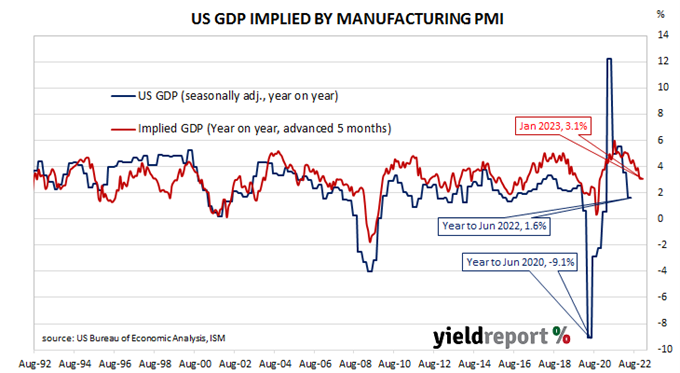
The ISM’s manufacturing PMI figures appear to lead US GDP by several months despite a considerable error in any given month. The chart below shows US GDP on a “year on year” basis (and not the BEA annualised basis) against US GDP implied by monthly PMI figures.
According to the ISM and its analysis of past relationships between the PMI and US GDP, August’s PMI corresponds to an annualised growth rate of 1.4%, or 0.4% over a quarter. Regression analysis on a year-on-year basis suggests a 12-month GDP growth rate of 3.1% five months after this latest report.
The ISM index is one of two monthly US PMIs, the other being an index published by IHS Markit. IHS Markit also produces a “flash” estimate in the last week of each month which comes out about a week before the ISM index is published. The IHS Markit August flash manufacturing PMI registered 51.3%, 0.9 percentage points lower than July’s final figure.