News

Lending growth slows in July, down from “brisk pace” of June quarter

31 August 2022

Summary: Private sector credit up 0.7% in July, in line with expectations; annual growth rate steady at 9.1%; represents “step-down” from June quarter pace; policy U-turn underway; business loans account for over 60% of net growth.

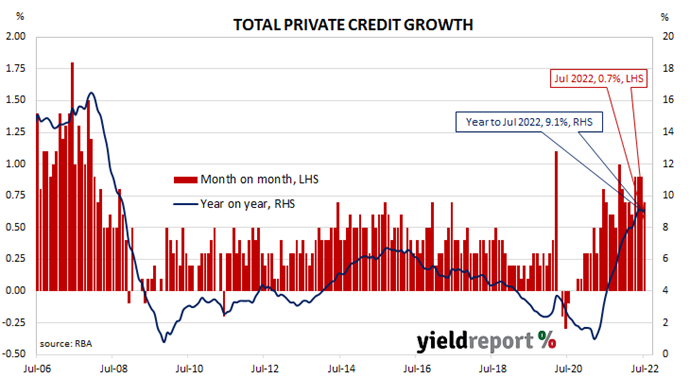
The pace of lending to the non-bank private sector by financial institutions in Australia followed a steady-but-gradual downtrend from late-2015 through to early 2020 before hitting what appears to be a nadir in March 2021. That downtrend ended later in the same year and now annual growth rates are above the peak seen in the previous decade.

According to the latest RBA figures, private sector credit increased by 0.7% in July. The result was in line with expectations but less than June’s 0.9% increase. On an annual basis, the growth rate remained steady at 9.1%.

“While a robust outcome, it represents a step-down from the brisk pace of the June quarter gains of 0.9% in each of the three months,” said Westpac senior economist Andrew Hanlan.

Commonwealth Government bond yields fell on the day. By the close of business, the 3-year ACGB yield had lost 5bps to 3.28% while 10-year and 20-year yields both finished 1bp lower at 3.61% and 3.88% respectively.

In the cash futures market, expectations regarding future rate rises softened slightly. At the end of the day, contracts implied the cash rate would rise from the current rate of 1.81% to 2.18% in September and then increase to 2.975% by November. May 2023 contracts implied a 3.76% cash rate while August 2023 contracts implied 3.855%.

“Importantly, a policy U-turn is now underway,” Hanlan added. “The RBA is quickly removing ultra-easy monetary policy, on the way to a contractionary stance to fight a significant inflation challenge. The tightening of policy will reduce demand for credit across households and businesses.”

Business loans accounted for over 60% of the net growth over the month while owner-occupier loans accounted most of the balance. Investor loans increased a little and personal loans decreased slightly.

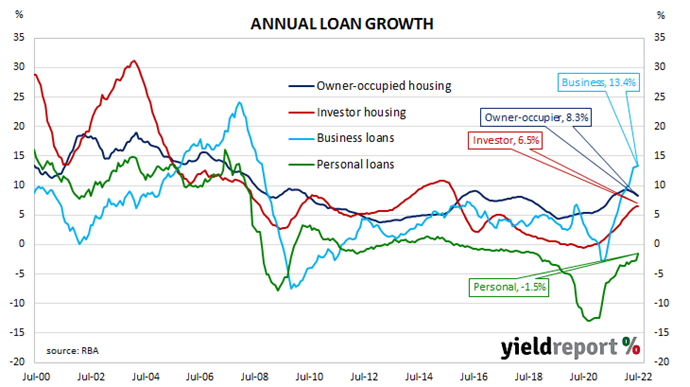
The traditional driver of overall loan growth, the owner-occupier segment, grew by 0.5% over the month, down from June’s 0.6% increase. The sector’s 12-month growth rate slowed again, this time from 8.6% to 8.3%.

Total lending in the business sector increased by 1.2%, less than the 1.5% increase recorded in June. Growth on an annual basis accelerated from 13.2% to 13.4%.

Monthly growth in the investor-lending segment slowed to a halt in early 2018. Shortly into the 2019/20 financial year, monthly growth rates slipped into the red before posting a series of flat or near-flat results until mid-2020. In July, net lending grew by 0.5%, slightly lower than the 0.6% increases in the months from March to June. The 12-month growth rate ticked up from 6.4% to 6.5%.                              

Total personal loans grew by 0.2%, in contrast with June’s 0.3% decline and slowing the annual contraction rate from 2.6% to 1.5%. This category of debt includes fixed-term loans for large personal expenditures, credit cards and other revolving credit facilities.

Quit rate slips in July; “more aggressive” Fed expected

30 August 2022

Summary: US quit rate slips in July; bond yields almost unchanged, expectations of higher rates firm; “no signs” of cooling labour market, Fed “needs to be more aggressive”; quits, separations down, openings up.

The number of US employees who quit their jobs as a percentage of total employment increased slowly but steadily after the GFC. It peaked in March 2019 and then tracked sideways until virus containment measures were introduced in March 2020. The quit rate then plummeted as alternative employment opportunities rapidly dried up. Following the easing of US pandemic restrictions, it proceeded to recover back to its pre-pandemic rate in the third quarter of 2020 and trended higher through 2021 before easing in the first half of 2022.

Figures released as part of the most recent Job Openings and Labor Turnover Survey (JOLTS) report show the quit rate declined in July. 2.7% of the non-farm workforce left their jobs voluntarily, down from 2.8% in June, the result of 74,000 fewer quits and an additional 528,000 people employed.

US Treasury yields finished the day without much change. By the close of business, the 2-year Treasury bond yield had returned to its starting point at 3.43%, the 10-year yield had crept up 1bp to 3.11% while the 30-year yield finished 2bps lower at 3.22%.

In terms of US Fed policy, expectations of higher federal funds rates over the next 12 months firmed. At the close of business, September contracts implied an effective federal funds rate of 2.54%, 21bps higher than the current spot rate while November contracts implied a rate of 3.46%. September 2023 futures contracts implied 3.79%, 146bps above the spot rate.

“The data suggests there are no signs yet of a cooling in the labour market with the inference the Fed needs to be more aggressive,” said NAB Director of Economics Tapas Strickland. “Note the number of people unemployed in the US is 5.67 million, suggesting even if layoffs rise, there is ample opportunity to get re-employment elsewhere.”

The fall in total quits was led by 73,000 fewer resignations in the “Health care and social assistance” sector while the “Professional and business services” sector experienced the single largest rise, increasing by 62,000. Overall, the total number of quits for the month fell from June’s revised figure of 4.253 million to 4.179 million.    

First improvement in Conf. Board confidence index since April

30 August 2022

Summary: Conference Board Consumer Confidence Index improves in August; reading above consensus expectations; views of present conditions, short-term outlook both improve; “recession risks continue”, inflation concerns remain elevated.

US consumer confidence clawed its way back to neutral over the five years after the GFC in 2008/2009 and then went from strength to strength until late 2018. Measures of consumer confidence then oscillated within a relatively narrow band at historically high levels until they plunged in early 2020. Subsequent readings then fluctuated around the long-term average until March 2021 when they reached elevated levels. However, a noticeable gap has since opened between the two most-widely followed surveys.

The latest Conference Board survey held during the first three weeks of August indicated US consumer confidence has improved after deteriorating for three months. August’s Consumer Confidence Index registered 103.2 on a preliminary basis, greater than the median consensus figure of 97.4 as well as July’s final figure of 95.3.

Consumers’ views of present conditions and the near future both improved. The Present Situation Index increased from July’s revised figure of 139.7 to 145.4 while the Expectations Index rose from a revised figure of 65.6 to 75.1.

“The Present Situation Index recorded a gain for the first time since March. The Expectations Index likewise improved from July’s nine-year low, but remains below a reading of 80, suggesting recession risks continue,” said Lynn Franco, a senior director at The Conference Board. He noted inflation concerns remained “elevated.”

US Treasury yields finished the day without much change. By the close of business, the 2-year Treasury bond yield had returned to its starting point at 3.43%, the 10-year yield had crept up 1bp to 3.11% while the 30-year yield finished 2bps lower at 3.22%.

In terms of US Fed policy, expectations of higher federal funds rates over the next 12 months firmed. At the close of business, September contracts implied an effective federal funds rate of 2.54%, 21bps higher than the current spot rate while November contracts implied a rate of 3.46%. September 2023 futures contracts implied 3.79%, 146bps above the spot rate.

“As the Fed raises interest rates to rein in inflation, purchasing intentions for cars, homes and major appliances all pulled back further in July,” Franco added. ”Looking ahead, inflation and additional rate hikes are likely to continue posing strong headwinds for consumer spending and economic growth over the next six months.”

The Consumer Confidence Survey is one of two widely followed monthly US consumer sentiment surveys which produce sentiment indices. The Conference Board’s index is based on perceptions of current business and employment conditions, as well as respondents’ expectations of conditions six months in the future. The other survey, conducted by the University of Michigan, is similar and it is used to produce an Index of Consumer Sentiment. That survey differs in that it does not ask respondents explicitly about their views of the labour market and it also includes some longer-term questions.

Euro-zone sentiment index down again in August

30 August 2022

Summary: Euro-zone composite sentiment index down in August; just below expectations; readings down in two of five sectors; down in three of four largest euro-zone economies; German, French 10-year yields barely change; index implies annual GDP growth of 0.9%.

The European Commission’s Economic Sentiment Indicator (ESI) is a composite index comprising five differently weighted sectoral confidence indicators.  It is heavily weighted towards confidence surveys from the business sector, with the consumer confidence sub-index only accounting for 20% of the ESI. However, it has a good relationship with euro-zone GDP, although not necessarily as a leading indicator.

The ESI posted a reading of 97.6 in August, just below the consensus expectation of 97.8 as well as July’s revised reading of 98.9. The average reading since 1985 is approximately 100.

German and French 10-year bond yields finished the day barely changed. By the close of business, the German bund yield had slipped 1bp to 1.50% while the French OAT yield finished unchanged at 2.12%.

Confidence deteriorated in just two of the five sectors of the economy. On a geographical basis, the ESI declined in three of the euro-zone’s four largest economies, the exception being Spain.

End-of-quarter ESI readings and annual euro-zone GDP growth rates are highly correlated. This latest reading corresponds to a year-to-August GDP growth rate of 0.9%, down from July’s implied growth rate of 1.2%.

Dwelling approvals plunge in July

30 August 2022

Summary: Home approval numbers down 17.2% in July, below expectations; “sudden stop” to high-rise activity, other segments holding up “reasonably well; rate rises placing pressure on borrowing capacity of developers, individual homebuilders; house approvals up 1.0%, apartments down 45.2%; non-residential approvals down 22.6% in dollar terms, residential alterations down 1.3%.

Building approvals for dwellings, that is apartments and houses, headed south after mid-2018. As an indicator of investor confidence, falling approvals had presented a worrying signal, not just for the building sector but for the overall economy. However, approval figures from late-2019 and the early months of 2020 painted a picture of a recovery taking place, even as late as April of that year. Subsequent months’ figures then trended sharply upwards before falling back in 2021 and the first half of 2022.

The Australian Bureau of Statistics has released the latest figures from July and total residential approvals plunged by 17.2% on a seasonally-adjusted basis. The fall over the month was significantly greater than the 3.0% decrease which had been generally expected as well as June’s -0.6%. Total approvals fell by 25.9% on an annual basis, below the previous month’s figure of -17.2%. Monthly growth rates are often volatile.

“Overall, the July report suggests high-rise activity is seeing a sudden stop but that other segments are still holding up reasonably well,” said Westpac senior economist Matthew Hassan.

Commonwealth Government bond yields fell significantly on the day, in contrast with the rises of US Treasury counterparts overnight. By the close of business, the 3-year ACGB yield had shed 10bps to 3.33% while 10-year and 20-year yields both finished 6bps lower at 3.62% and 3.89% respectively.

“We expect that uncertainty around construction costs, initial rate hikes and the prospect of further increases in the cost of debt all contributed to the decline in unit approvals,” said ANZ senior economist Adelaide Timbrell. “We expect total building approvals to keep falling as more rate hikes put downward pressure on borrowing capacity of both developers and individual homebuilders.”

Approvals for new houses increased by 1.0% over the month after rising by 1.4% in June. On a 12-month basis, house approvals were 17.2% lower than they were in July 2021, up from June’s comparable figure of -21.7%.

Apartment approval figures are usually a lot more volatile and July’s total plummeted by 45.2% after a 3.5% decline in June. The 12-month growth figure deteriorated from June’s revised rate of -9.1% to -42.9%.

Non-residential approvals decreased by 22.6% in dollar terms over the month and by 0.9% on an annual basis. Figures in this segment also tend to be rather volatile.

Residential alteration approvals decreased by 1.3% in dollar terms over the month and were 3.6% lower than in July 2021.

“Broad-based lift” in July’s retail sales

29 August 2022

Summary: Retail sales up 1.3% in July, higher than expected; “broad-based lift” not a “rogue” event; rising prices account for sizable portion of total increase; net overseas arrivals very positive in July; tourism, returning residents “likely key driver”; largest influence on month from food sales.

Growth figures of domestic retail sales spent most of the 2010s at levels below the post-1992 average. While economic conditions had been generally favourable, wage growth and inflation rates were low. Expenditures on goods then jumped in the early stages of 2020 as government restrictions severely altered households’ spending habits. Households mostly reverted to their usual patterns as restrictions eased in the latter part of 2020 and throughout 2021, although not for all categories.

According to the latest ABS figures, total retail sales increased by 1.3% in July on a seasonally adjusted basis. The rise was noticeably greater than the 0.3% increase which had been expected as well as June’s 0.2% increase. On an annual basis, retail sales increased by 16.5%, up from June’s comparable figure of 12.0%.

“The detail shows a broad-based lift with nothing to suggest the monthly gain is a ‘rogue’ ,” said Westpac senior economist Matthew Hassan. “That said, rising retail prices undoubtedly account for a sizeable part of the rise, with volumes likely to have been somewhat flatter.”

Commonwealth bond yields increased on the day, especially at the short end. By the close of business, the 3-year ACGB yield had jumped 15bps to 3.43%, the 10-year rate had gained 9bps to 3.68% while the 20-year yield finished 4bps higher at 3.95%.

ANZ senior economist Adelaide Timbrell took a somewhat different approach to her Westpac counterpart, pointing to increased arrivals at Australian airports and ports. “Net overseas arrivals were very positive in July, signalling that tourism and returning residents were likely a key driver of the bump in retail.” She noted June’s modest growth figure had coincided with negative net arrivals and said ANZ “will be watching net arrivals as a signal for retail sales growth in the near term, since the two datasets have been moving together in recent months.”

Retail sales are typically segmented into six categories (see below), with the “food” segment accounting for nearly 40% of total sales. The largest influence on the total during the month came from the “Food” segment which increased by 1.2% over the month and thus contributed 0.48 percentage points of the 1.30% increase. Household goods sales fell by 1.1% over the month and deducted 0.20 percentage points.

Too early to declare victory; core PCE inflation up 0.1% in July

26 August 2022

Summary: US core PCE price index up 0.1% in July, in line with expectations; annual rate slows from 4.8% to 4.6%; US inflation remains too high, too early to declare victory; long-term Treasury yields down; more rate rises still expected.

One of the US Fed’s favoured measures of inflation is the change in the core personal consumption expenditures (PCE) price index. After hitting the Fed’s target at the time of 2.0% in mid-2018, the annual rate then hovered in a range between 1.8% and 2.0% before it eased back to a range between 1.5% and 1.8% through 2019. It then plummeted below 1.0% in April 2020 before rising back to around 1.5% in the September quarter of that year. It has since increased significantly above the Fed’s target.

The latest figures have now been published by the Bureau of Economic Analysis as part of the July personal income and expenditures report. Core PCE prices rose by just 0.1% over the month, in line with expectations but considerably less than June’s 0.6% increase. On a 12-month basis, the core PCE inflation rate slowed from June’s figure of 4.8% to 4.6%.

ANZ Head of Australian Economics David Plank said inflation over the last three months “remains too high”, even after including the latest figure, noting Fed chief Jerome Powell’s statement from Friday that “it’s far too early to declare victory.”

US Treasury bond yields fell on the day. By the close of business, 2-year and 10-year Treasury bond yield had both slipped 1bp to 3.38% and 3.04% respectively while the 30-year yield finished 4bps lower at 3.20%.

In terms of US Fed policy, expectations of a higher federal funds rate over the next 12 months firmed a little. At the close of business, September contracts implied an effective federal funds rate of 2.535%, 21bps higher than the current spot rate while November contracts implied a rate of 3.40%. September 2023 futures contracts implied 3.67%, 134bps above the spot rate.

The core version of PCE strips out energy and food components, which are volatile from month to month, in an attempt to identify the prevailing trend. It is not the only measure of inflation used by the Fed; the Fed also tracks the Consumer Price Index (CPI) and the Producer Price Index (PPI) from the Department of Labor. However, it is the one measure which is most often referred to in FOMC minutes.

August ifo survey: mood “bleak”

25 August 2022

Summary: ifo business climate index down again in August, above expected figure; German mood “bleak”, economy expected to shrink in third quarter; current conditions index, expectations index both down; sentiment unlikely to change given energy shortage; expectations index implies euro-zone GDP contraction of 7.3% in year to November.

Following a recession in 2009/2010, the ifo Institute’s Business Climate Index largely ignored the European debt-crisis of 2010-2012, mostly posting average-to-elevated readings through to early-2020. However, the index was quick to react in the March 2020 survey, falling precipitously. Readings through much of 2021 generally fluctuated around the long-term average before dropping away in 2022.

According to the latest report released by ifo, German business sentiment has deteriorated even further, albeit only slightly. August’s Business Climate Index recorded a reading of 88.5, above the consensus expectation of 86.8 but slightly lower than July’s final reading of 88.7. The average reading since January 2005 is just above 97.

“A bleak mood hangs over the German economy,” said Clemens Fuest, President of the ifo Institute.  “Uncertainty among the companies remains high, and the German economy as a whole is expected to shrink in the third quarter.”

German firms’ views of current conditions and their outlook both deteriorated. The current situation index slipped from July’s revised figure of 97.7 to 97.5 while the expectations index eased from 80.4 to 80.3.

German and French long-term bond yields both fell noticeably on the day. By the close of business, German and French 10-year bond rates had both shed 6bps to 1.31% and 1.92%.

“Even though the declines were modest, sentiment is still negative and this is unlikely to change for some time given the energy shortage faced by Germany,” said ANZ economist Kishti Sen.

The ifo Institute’s business climate index is a composite index which combines German companies’ views of current conditions with their outlook for the next six months. It has similarities to consumer sentiment indices in the US such as the ones produced by The Conference Board and the University of Michigan.

It also displays a solid correlation with euro-zone GDP growth rates. However, the expectations index is a better predictor as it has a higher correlation when lagged by one quarter. August’s expectations index implies a 7.3% year-on-year GDP contraction to the end of November.

Euro consumer sentiment index improves; still well below average

23 August 2022

Summary: Euro-zone households less pessimistic in August; consumer confidence Index up 2.1 points; still well below long-term average, lower bound of “normal” readings; euro-zone bond yields higher.

EU consumer confidence plunged during the GFC and again in 2011/12 during the European debt crisis. After bouncing back through 2013 and 2014, it fell back significantly in late 2018 but only to a level which corresponds to significant optimism among households. Following the plunge which took place in April 2020, a recovery began a month later, with household confidence returning to above-average levels in March 2021. However, recent readings have been extremely low by historical standards.

Consumer confidence improved a little in August according to the latest survey conducted by the European Commission. Its Consumer Confidence Indicator recorded a reading of -24.9, above the generally expected figure of -28.0 as well as July’s -27.0. This latest reading is still well below the long-term average of -11.6 as well as outside the lower end of the range in which “normal” readings usually occur.

Sovereign bond yields rose moderately in major euro-zone bond markets on the day. By the end of it, the German 10-year bund yield had added 3bps to 1.33% and the French 10-year OAT yield had gained 4bps to 1.93%.

US spending shifts from fuel; retail sales flat in July

17 August 2022

Summary:  US retail sales flat in July, less than expected; June figure revised down; report’s details imply ex-auto sales stronger than expected; US Treasury bond yields up, rate rise expectations firm; lower fuel sales offset by spending elsewhere; rises in nine of thirteen retail categories; “non-store” segment largest single influence.

US retail sales had been trending up since late 2015 but, commencing in late 2018, a series of weak or negative monthly results led to a drop-off in the annual growth rate below 2.0%. Growth rates then increased in trend terms through 2019 and into early 2020 until pandemic restrictions sent it into negative territory. A “v-shaped” recovery then took place which was followed by some short-term spikes as federal stimulus payments hit US households in the first and second quarters of 2021.

According to the latest “advance” numbers released by the US Census Bureau, total retail sales remained steady in July. The flat result was slightly less than the 0.1% gain which had been generally expected but considerably lower than June’s 0.8% after it was revised down from 1.0%. However, on an annual basis, the growth rate still accelerated from June’s revised figure of 8.5% to 10.3%.

“US retail sales didn’t grow in July, which was below consensus expectations for a 0.1% lift,” said ANZ economist Madeline Dunk. “But the details of the release were stronger than expected, with retail sales ex-auto and gas lifting 0.7%, versus 0.4% expected.”

US Treasury bond yields rose on the day, especially at the long end. By the close of business, the 2-year Treasury yield had inched up 1bp to 3.27%, the 10-year yield had gained 9bps to 2.90% while the 30-year yield finished 6bps higher at 3.15%.

In terms of US Fed policy, expectations of a steeper path for the federal funds rate over the next 12 months firmed a little. At the close of business, September contracts implied an effective federal funds rate of 2.525%, 20bps higher than the current spot rate. November contracts implied 3.30% while September 2023 futures contracts implied an effective federal funds rate of 3.535%, about 120bps above the spot rate.

“Falling gas prices in the month contributed to a 1.8% fall in gas station sales, with the result suggesting consumers much of this benefit was directed into other spending,” said NAB economist Taylor Nugent.

Nine of the thirteen categories recorded higher sales over the month. The “Non-store retailer” segment provided the largest single influence on the overall result, rising by 2.7% for the month and by 20.2% over the year to July. Sales in the “Motor vehicles & parts dealers” segment also had a significant influence on the month’s result, falling by 1.6%.

The non-store segment includes vending machine sales, door-to-door sales and mail-order sales but nowadays this segment has become dominated by online sales. It now accounts for just over 16% of all US retail sales and it is the second-largest segment after vehicles and parts.

Click for more news