News

Westpac-MI leading index now “broadly steady”, follows “abrupt slowdown”

17 August 2022

Summary:  Leading index growth rate up in July; broadly steady over last three months; reading implies annual GDP growth of around 3.40%; spending growth expected to slow in late 2022 on back of rising interest rates, high inflation.

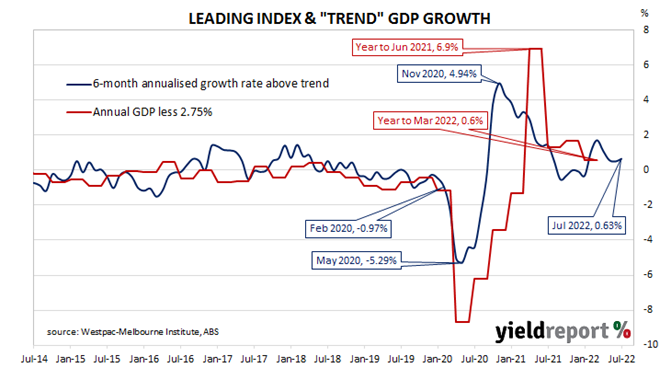
Westpac and the Melbourne Institute describe their Leading Index as a composite measure which attempts to estimate the likely pace of Australian economic growth in the short-term. After reaching a peak in early 2018, the index trended lower through 2018 and 2019 before plunging to recessionary levels in the second quarter of 2020. Subsequent readings were markedly higher but readings through 2021 mostly declined.

The July reading of the six month annualised growth rate of the indicator registered 0.63%, up from June’s figure of 0.48% after it was revised from 0.40%.

“The Index growth rate has held broadly steady over the last three months after an abrupt slowdown earlier in the year from a strongly above-trend starting point,” said Westpac Chief Economist Bill Evans. He interpreted the latest figures as “consistent with momentum continuing to track slightly above trend heading into year-end.”

Index figures represent rates relative to “trend” GDP growth, which is generally thought to be around 2.75% per annum in Australia. The index is said to lead GDP by “three to nine months into the future” but the highest correlation between the index and actual GDP figures occurs with a three-month lead. The current reading thus represents an annual GDP growth rate of around 3.40% at the beginning of the December quarter.

Domestic Treasury bond yields moved higher on the day. By the close of business, the 3-year ACGB yield had gained 5bps to 3.07%, the 10-year yield had added 4bps to 3.29% while the 20-year yield finished 1bp higher at 3.63%.

In the cash futures market, expectations of higher rates eased slightly. At the end of the day, contracts implied the cash rate would rise from the current rate of 1.81% to 2.145% in September and then increase to 2.87% by November. May 2023 contracts implied a 3.52% cash rate, as did August 2023 contracts.

Readings in the first half of 2022 have mostly been of a type which implies above-trend growth but Evans sees some tougher conditions ahead. “While overall momentum in the economy remains above trend, we expect that as we near the final quarter of the year, growth in spending will slow under the weight of rising interest rates and high inflation which are already sapping confidence.”

US vehicle production “surges”; industrial output beats estimates in July

16 August 2022

Summary: US industrial output up 0.6% in July, double market expectations; up 3.9% over past 12 months; vehicle production “surges” as bottlenecks ease; capacity utilisation rate up 0.4ppts to 80.3%, just above long-term average.

The Federal Reserve’s industrial production (IP) index measures real output from manufacturing, mining, electricity and gas company facilities located in the United States. These sectors are thought to be sensitive to consumer demand and so some leading indicators of GDP use industrial production figures as a component.

US production collapsed through March and April of 2020 before recovering the ground lost over the fifteen months to July 2021.

According to the Federal Reserve, US industrial production expanded by 0.6% on a seasonally adjusted basis in July. The result was double the 0.3% increase which had been generally expected and a marked improvement on June’s flat result after it was revised up from -0.2%. However, on an annual basis the growth rate slowed from June’s revised figure of 4.0% to 3.9%.

NAB currency strategist Rodrigo Catril noted the increase was “driven by a 6.6% surge in motor vehicle production, on easing bottlenecks that are allowing a return to more normal production levels.”

Short-term US Treasury bond yields moved considerably higher on the day while longer-term yields barely changed. By the close of business, the 2-year Treasury yield had gained 9bps to 3.26%, the 10-year yield had added 2bps to 2.81 while the 30-year yield finished 1bp lower at 3.09%.

In terms of US Fed policy, expectations of a steeper path for the federal funds rate over the next 12 months firmed slightly. At the close of business, September contracts implied an effective federal funds rate of 2.525%, 20bps higher than the current spot rate. November contracts implied 3.295% while September 2023 futures contracts implied an effective federal funds rate of 3.46%, about 113bps above the spot rate.  

The same report includes US capacity utilisation figures which are generally accepted as an indicator of future investment expenditure and/or inflationary pressures. Capacity usage had hit a high for the last business cycle in early 2019 before it began a downtrend which ended with April 2020’s multi-decade low of 64.2%. July’s reading increased from June’s revised figure of 79.9% to 80.3%, just above of the long-term average of 80.1%.

While the US utilisation rate’s correlation with the US jobless rate is solid, it is not as high as the comparable correlation in Australia.

Up but still really low: UoM confidence index improves in August

12 August 2022

Summary: University of Michigan consumer confidence index firms in July, above consensus expectations; views of present conditions deteriorate, future conditions improve; expectations improvement notable among low, middle income groups; may “soothe” concerns about spiralling fall in private demand.

US consumer confidence started 2020 at an elevated level but, after a few months, surveys began to reflect a growing unease with the global spread of COVID-19 and its reach into the US. Household confidence plunged in April 2020 and then recovered in a haphazard fashion, generally fluctuating at below-average levels according to the University of Michigan. The University’s measure of confidence had recovered back to the long-term average by April 2021 but then it plunged again in the September quarter and has since remained at historically low levels.

The latest survey conducted by the University indicates confidence among US households firmed on average in August. The preliminary reading of the Index of Consumer Sentiment registered 55.1, above the generally expected figure of 52.0 as well as July’s final figure of 51.5. Consumers’ views of current conditions deteriorated while expectations regarding future conditions improved in comparison to those held at the time of the July survey.

“All components of the expectations index improved this month, particularly among low and middle income consumers for whom inflation is particularly salient,” said the University’s Surveys of Consumers Director Joanne Hsu.

Short-term US Treasury bond yields moved higher on the day while longer-term yields moved lower. By the close of business, the 2-year Treasury yield had gained 6bps to 3.25%, the 10-year had shed 6bps to 2.83% while the 30-year yield finished 7bps lower at 3.11%.

“The improvement in the overall index will soothe some concerns about a spiralling fall in private demand, though to the extent that such a dynamic might be precisely what the Fed requires in practice to beat inflation might be a double-edged sword,” said ANZ Head of Australian Economics David Plank.

It was once thought less-confident households are generally inclined to spend less and save more; some decline in household spending could be expected to follow. However, recent research suggests the correlation between household confidence and retail spending is quite weak.

Euro-zone production up in June

12 August 2022

Summary: Euro-zone industrial production up 0.7% in June, greater than expected; annual growth rate improves to 2.4%; German, French 10-year yields hardly move; expands in three of euro-zone’s four largest economies.

Following a recession in 2009/2010 and the debt-crisis which flowed from it, euro-zone industrial production recovered and then reached a peak four years later in 2016. Growth rates then fluctuated for two years before beginning a steady and persistent slowdown from the start of 2018. That decline was transformed into a plunge in March and April of 2020 which then took over a year to claw back. Production in more-recent months has generally stagnated.

According to the latest figures released by Eurostat, euro-zone industrial production expanded by 0.7% in June on a seasonally-adjusted and calendar-adjusted basis. The rise was greater than the 0.2% increase which had been generally expected but it was significantly less than May’s 2.1% increase after revisions. The calendar-adjusted growth rate on an annual basis improved from May’s revised rate of 1.6% to 2.4%.

German and French sovereign bond yields hardly moved on the day. By the close of business, the German 10-year bund yield had returned to its starting point at 0.98% while the French 10-year OAT yield finished 1bps lower at 1.53%.

Industrial production expanded in three of the euro-zone’s four largest economies. Germany’s production grew by 0.6% over the month while the growth figures for France, Spain and Italy were 1.3%, -2.1% and 1.0% respectively.

US producer inflation declines in July as fuel prices ease

11 August 2022

Summary: US producer price index (PPI) down 0.5% in July, less than expected figure; annual rate slows to 9.7%; “core” PPI up 0.2%; fuel accounts for 80% of decline; longer-term US Treasury yields considerably higher, rate-rise expectations firm.

Around the end of 2018, the annual inflation rate of the US producer price index (PPI) began a downtrend which continued through 2019. Months in which producer prices increased suggested the trend may have been coming to an end, only for it to continue, culminating in a plunge in April 2020. Figures returned to “normal” towards the end of that year but annual rates over the past eighteen months have been well above the long-term average.

The latest figures published by the Bureau of Labor Statistics indicate producer prices fell by 0.5% after seasonal adjustments in July. The decline was in contrast with the 0.3% increase which had been generally expected as well as June’s revised increase of 1.0%. On a 12-month basis, the rate of producer price inflation after seasonal adjustments slowed from 11.2% in June to 9.7%.

Producer prices excluding foods and energy, or “core” PPI, rose by 0.2% after seasonal adjustments. The increase was half the 0.4% rise that had been generally expected as well as June’s 0.4%. The annual rate slowed from June’s revised figure of 8.4% to 7.5%.

“The drop in fuel prices accounted for 80% of the decline in prices in July,” said ANZ economist Kishti Sen. “Food prices also eased 0.9%. Easing supply chain pressures appear to be the main factor driving the moderation of prices.”

Long-term US Treasury bond yields moved considerably higher on the day. By the close of business, the 10-year Treasury yield had gained 10bps to 2.89% and the 30-year yield had increased by 15bps to 3.18%. The 2-year yield finished 2bp lower at 3.19%.

In terms of US Fed policy, expectations of a steeper path for the federal funds rate over the next 12 months firmed. At the close of business, September contracts implied an effective federal funds rate of 2.52%, 19bps higher than the current spot rate. November contracts implied 3.31% while September 2023 futures contracts implied an effective federal funds rate of 3.425%, about 110bps above the spot rate.   

The producer price index is a measure of prices received by producers for domestically produced goods, services and construction. It is put together in a fashion similar to the consumer price index (CPI) except it measures prices received from the producer’s perspective rather than from the perspective of a retailer or a consumer. It is another one of the various measures of inflation tracked by the US Fed, along with core personal consumption expenditure (PCE) price data.

“Pleasing first step” towards combatting US inflation in July CPI figures

10 August 2022

Summary: US CPI unchanged in July, lower than expected; “core” rate up 0.3%; “pleasing first step” towards combatting inflation; short-term Treasury yields decline, longer-term yields up, rate rise expectations wound back; 0.3% core inflation “hardly be seen as comforting in normal times”; energy prices main driver of headline fall.

The annual rate of US inflation as measured by changes in the consumer price index (CPI) halved from nearly 3% in the period from July 2018 to February 2019. It then fluctuated in a range from 1.5% to 2.0% through 2019 before rising above 2.0% in the final months of that year. Substantially lower rates were reported from March 2020 to May 2020 and they remained below 2% until March 2021. Rates have since risen significantly.

The latest CPI figures released by the Bureau of Labor Statistics indicated seasonally-adjusted consumer prices remained unchanged on average in July. The result was lower than the generally expected figure of 0.2% as well as June’s 1.3% jump. On a 12-month basis, the inflation rate slowed from June’s reading of 9.0% to 8.5%.

“Headline” inflation is known to be volatile and so references are often made to “core” inflation for analytical purposes. The core prices index, the index which excludes the more variable food and energy components, increased by 0.3% on a seasonally-adjusted basis for the month. The rise was smaller than the 0.5% expected as well as June’s 0.7% increase and the annual growth rate remained steady at 5.9%.

“For the FOMC, the July inflation report is a pleasing first step towards being able to claim victory over inflation,” said Westpac senior economist Elliot Clarke. “However, at least one or two more similar readings for inflation are necessary if they are to have confidence that the inflation emergency has passed.”

US short-term Treasury bond yields declined on the day, while longer-term yields increased. By the close of business, the 2-year Treasury yield had shed 5bps to 3.21% while the 10-year yield inched up 1bp to 2.79% and the 30-year yield  gained 4bps to 3.03%.

In terms of US Fed policy, expectations of higher federal funds rates over the next 12 months were wound back. At the close of business, September contracts implied an effective federal funds rate of 2.525%, 20bps higher than the current spot rate. November contracts implied 3.30% while July 2023 futures contracts implied an effective federal funds rate of 3.475%, 115bps above the spot rate.

NAB senior interest rate strategist Ken Crompton sounded a note of caution, saying “…it’s easy to forget that in more normal times, a +0.3% core inflation print, which annualises beyond 3.5%, would hardly be seen as comforting, even if softer than expected.”

The largest influence on headline results is often the change in fuel prices. “Energy commodities”, the segment which contains vehicle fuels, dropped by 7.6%, subtracting 0.43 percentage points. Prices of non-energy services, the segment which includes actual and implied rents, added 0.23 percentage points after they increased by 0.4% on average.

NAB July business survey: demand “strong”, inflation yet to peak

09 August 2022

Summary: Business conditions improve in July, at elevated level; confidence also improves, just above long-term average; demand “strong”, inflation yet to peak; capacity utilisation rate up, all 8 sectors of economy above respective long-run averages.

NAB’s business survey indicated Australian business conditions were robust in the first half of 2018, with a cyclical-peak reached in April of that year. Readings from NAB’s index then began to slip and forecasts of a slowdown in the domestic economy began to emerge in the first half of 2019 as the index trended lower. It hit a nadir in April 2020 as pandemic restrictions were introduced but then conditions improved markedly over the next twelve months. Readings have been generally in a historically-normal range since then.

According to NAB’s latest monthly business survey of over 400 firms conducted over the last week and a half of July, business conditions have improved, maintaining an elevated reading. NAB’s conditions index registered 20, up from June’s revised reading of 14.

Business confidence also improved. NAB’s confidence index rose from June’s revised reading of 2 to 7, a reading which is just above the long-term average. Typically, NAB’s confidence index leads the conditions index by one month, although some divergences have appeared from time to time.

“Overall, the survey suggests that despite global and domestic economic headwinds, demand has remained strong and inflationary pressure continues to build, suggesting that inflation is yet to peak,” said NAB senior economist Brody Viney.

Long-term Commonwealth Government bond yields moved lower on the day. By the close of business, the 10-year ACGB yield had lost 3bps to 3.21% and the 20-year yield had shed 5bps to 3.52%. The 3-year yield remained unchanged at 3.03%.

In the cash futures market, expectations of higher rates firmed a touch. At the end of the day, contracts implied the cash rate would rise from the current rate of 1.81% to 2.155% in September and then increase to 2.955% by November. May 2023 contracts implied a 3.465% cash rate and August 2023 contracts implied 3.455%.

NAB’s measure of national capacity utilisation resumed its recovery from December’s drop as it increased from June’s revised figure of 84.9% to 86.7%. All eight sectors of the economy were reported to be operating above their respective long-run averages.

Capacity utilisation is generally accepted as an indicator of future investment expenditure and it also has a strong inverse relationship with the unemployment rate.

Consumer sentiment down in August, on par with early pandemic/GFC

09 August 2022

Summary: Household sentiment deteriorates for ninth consecutive month in August; on par with lows of COVID, GFC; three of five sub-indices lower; respondents less concerned by prospects of unemployment.

After a lengthy divergence between measures of consumer sentiment and business confidence in Australia which began in 2014, confidence readings of the two sectors converged again in mid-July 2018. Both measures then deteriorated gradually in trend terms, with consumer confidence leading the way. Household sentiment fell off a cliff in April 2020 but, after a few months of to-ing and fro-ing, it then staged a full recovery. However, consumer sentiment has deteriorated significantly over the past year, while business sentiment has been more robust.

According to the latest Westpac-Melbourne Institute survey conducted in the first week of August, household sentiment has deteriorated for a ninth consecutive month. Their Consumer Sentiment Index declined from July’s reading of 83.8 to 81.2, a reading which is well below the range of “normal” readings and significantly lower than the long-term average reading of just over 101.

“This reading is on a par with the lows of COVID and the Global Financial Crisis, although still well above the lows during the late 80’s / early 90’s recession,” said Westpac Chief Economist Bill Evans.

Any reading of the Consumer Sentiment Index below 100 indicates the number of consumers who are pessimistic is greater than the number of consumers who are optimistic.

Long-term Commonwealth Government bond yields moved lower on the day. By the close of business, the 10-year ACGB yield had lost 3bps to 3.21% and the 20-year yield had shed 5bps to 3.52%. The 3-year yield remained unchanged at 3.03%.

In the cash futures market, expectations of higher rates firmed a touch. At the end of the day, contracts implied the cash rate would rise from the current rate of 1.81% to 2.155% in September and then increase to 2.955% by November. May 2023 contracts implied a 3.465% cash rate and August 2023 contracts implied 3.455%.

Three of the five sub-indices registered lower readings, with the “Time to buy a major household item” sub-index posting the largest monthly percentage loss. The reading of the “Family finances – next 12 months” sub-index increased modestly while the “Family finances versus a year ago” remained essentially unchanged.

The Unemployment Expectations index, formerly a useful guide to RBA rate changes, fell from 109.8 to 103.4. Lower readings result from fewer respondents expecting a higher unemployment rate in the year ahead.

Services lead charge; July non-farm employment jumps

08 August 2022

Summary: Non-farm payrolls up by 528,000 in July, double expected rise; previous two months’ figures revised up by 28,000; jobless rate steady declines to 3.5%, participation rate slips to 62.1%; services lead charge, construction, manufacturing also strong; jobs-to-population ratio ticks up to 60.0%; underutilisation rate steady at 6.7%; annual hourly pay growth steady at 5.2%.

The US economy ceased producing jobs in net terms as infection controls began to be implemented in March 2020. The unemployment rate had been around 3.5% but that changed as job losses began to surge through March and April of 2020. The May 2020 non-farm employment report represented a turning point and subsequent months provided substantial employment gains. Changes in recent months have been generally more modest but also well above the long-term monthly average.

According to the US Bureau of Labor Statistics, the US economy created an additional 528,000 jobs in the non-farm sector in July. The increase was more than double the 250,000 which had been generally expected but considerably more than the 398,000 jobs which had been added in June after revisions. Employment figures for May and June were revised up by a total of 28,000.

The total number of unemployed decreased by 242,000 to 5.670 million while the total number of people who are either employed or looking for work decreased by 63,000 to 163.960 million. These changes led to the US unemployment rate declining from 3.6% to 3.5%. The participation rate assisted by slipping from June’s rate of 62.2% to 62.1%. “Services led the charge but construction and manufacturing were also strong, belying recent indicators,” said ANZ Rates Strategist Gregorius Steven. “Noise in the seasonal adjustment factor could feed into downward surprises in coming months; all else equal but there’s no question that the US labour market is extremely tight.”

US Treasury yields jumped on the day. By the close of business, the 2-year yield had gained 19bps to 3.21%, the 10-year yield had added 17bps to 2.83% while the 30-year yield finished 12bps higher at 3.07%.

In terms of US Fed policy, expectations of a steeper path for the federal funds rate over the next 12 months hardened. At the close of business, September contracts implied an effective federal funds rate of 2.555%, 23bps higher than the current spot rate, while November contracts implied 3.36%. July 2023 futures contracts implied an effective federal funds rate of 3.475%, 115bps above the spot rate.

One figure which is indicative of the “spare capacity” of the US employment market is the employment-to-population ratio. This ratio is simply the number of people in work divided by the total US population. It hit a cyclical-low of 58.2 in October 2010 before slowly recovering to just above 61% in late-2019. July’s reading ticked up from 59.9 to 60.0%, still some way from the April 2000 peak reading of 64.7%.

Wage growth spiked in the US during the early stages of pandemic restrictions as lower-paid jobs disappeared at a faster rate relative to higher-paid jobs, disrupting the usual relationship between wage inflation and unemployment rates. Normally, wages tend to grow as the supply of labour tightens.

Apart from the unemployment rate, another measure of tightness in the labour market is the underutilisation rate and the latest reading of it remained steady at 6.7%. Wage inflation and the underutilisation rate usually have an inverse relationship and hourly pay growth in the year to July remained unchanged from June’s revised rate of 5.2%.

Signs of easing labour demand in June JOLTS report

02 August 2022

Summary: US quit rate unchanged in June; bond yields drop on hawkish Fed statements; expectations of higher rates harden; labour demand easing, not enough to bring wages under control; quits, openings, separations all down.

The number of US employees who quit their jobs as a percentage of total employment increased slowly but steadily after the GFC. It peaked in March 2019 and then tracked sideways until virus containment measures were introduced in March 2020. The quit rate then plummeted as alternative employment opportunities rapidly dried up. Following the easing of US pandemic restrictions, it proceeded to recover back to its pre-pandemic rate in the third quarter of 2020 and trended higher through 2021 before easing in the first half of 2022.

Figures released as part of the most recent Job Openings and Labor Turnover Survey (JOLTS) report show the quit rate remained unchanged in June. 2.8% of the non-farm workforce left their jobs voluntarily, the same percentage as in May, even though there were 37,000 fewer quits and an additional 372,000 people employed.

US Treasury yields jumped on the day, especially at the short end of the curve, as markets took note of hawkish messages from several FOMC members. By the close of business, the 2-year Treasury bond yield had gained 17bps to 3.03%, the 10-year yield had added 18bps to 2.75% while the 30-year yield finished 9bps higher at 3.01%.

In terms of US Fed policy, expectations of higher federal funds rates over the next 12 months hardened. At the close of business, September contracts implied an effective federal funds rate of 2.515%, 19bps higher than the current spot rate while November contracts implied a rate of 3.225%. July 2023 futures contracts implied 3.24%, 91bps above the spot rate.

NAB Director of Economics Tapas Strickland said the figures show “labour demand is easing but perhaps not rapidly enough to bring wages under control as illustrated in last Friday’s Employment Cost Index.”

The fall in total quits was led by 51,000 fewer resignations in the “Construction” sector while the “Federal Government” sector experienced the single largest rise, increasing by 11,000. Overall, the total number of quits for the month fell from May’s revised figure of 4.274 million to 4.237 million.             

Total vacancies at the end of June decreased by 605,000, or 5.4%, from May’s revised figure of 11.303 million to 10.698 million. The fall was driven by a 343,000 drop in the “Retail trade” sector while the “Health care and social assistance” sector experienced the single largest increase, rising by 79,000. Overall, 11 out of 18 sectors experienced fewer job openings than in the previous month.  

Total separations decreased by 86,000, or1.4%, from May’s revised figure of 6.017 million to 5.931 million. The fall was led by the “Wholesale trade” sector where there were 27,000 fewer separations than in May. Separations declined in 9 out of 18 sectors.

The “quit” rate time series produced by the JOLTS report is a leading indicator of US hourly pay. As wages account for around 55% of a product’s or service’s price in the US, wage inflation and overall inflation rates tend to be closely related. Former Federal Reserve chief and current Treasury Secretary Janet Yellen was known to pay close attention to it.

Click for more news