News

“More significant declines to come” in home loan approvals

02 August 2022

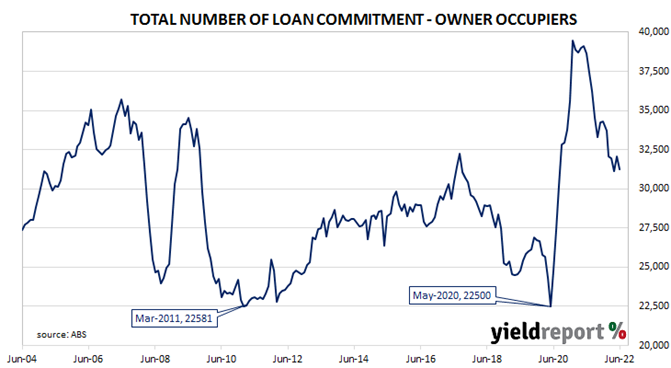
Summary: Value of loan commitments down 4.4% in June; “more significant declines to come”; holiday disruptions in April, May conceal “turning point”; value of owner-occupier loan approvals down 3.3%, investor approvals down 6.3%; number of home loan approvals down 2.6%.

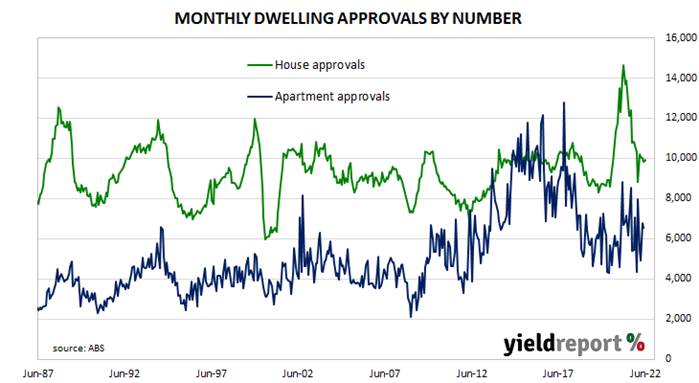
After the RBA reduced its cash rate target in a series of cuts beginning in mid-2019 the number and value of approvals began to noticeably increase, potentially ending the downtrend which had been in place since mid-2017. Figures from February through to May of 2020 provided an indication the downtrend was still intact but subsequent figures then pushed both back to elevated levels in 2021.

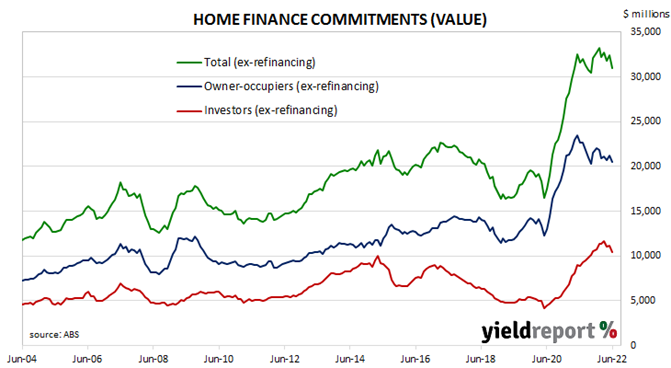
June’s housing finance figures have now been released and total loan approvals excluding refinancing decreased by 4.4% In dollar terms over the month, slightly worse than the 3.0% fall which had been generally expected and in contrast with May’s +1.8%. On a year-on-year basis, total approvals excluding refinancing declined by 2.0%, down from the previous month’s comparable figure of -0.4%.

“Even sharper falls in the value of property sales since the start of the year point to more significant declines to come,” said Westpac senior economist Matthew Hassan.

Commonwealth Government bond yields fell significantly on the day, to some degree following the falls of US Treasury yields overnight. By the close of business, the 3-year ACGB yield had lost 9bps to 2.74%, the 10-year yield had shed 12bps to 3.00% while the 20-year yield finished 6bps lower at 3.37%.

“The ABS previously advised that the timing of public and school holidays disrupted approvals in previous months, with delays in April and a catch-up in May,” Hassan added. “That is likely concealing a turning point in activity.”

The total value of owner-occupier loan commitments excluding refinancing decreased by 3.3%, in contrast to May’s 2.2% increase. On an annual basis, owner-occupier loan commitments were 9.6% lower than in June 2021, the same as in May.

The total value of investor commitments excluding refinancing arrangements fell by 6.3%. The drop followed a 0.9% increase in May, taking the growth rate over the previous 12 months to 17.3%, down from 23.7% in May. 

The total number of loan commitments (excluding refinancing loans) to owner-occupiers declined by 2.6% to 31,243. The decrease contrasted with May’s 3.0% rise and the annual contraction rate worsened slightly, from -18.0% to -19.2%.

“Significant hit still looms”; dwelling approvals decline in June

02 August 2022

Summary: Home approval numbers down 0.7% in June, above expectations; strong growth in Victoria offset by declines in Qld., SA; “significant hit still looms” from rising costs, interest rates; accelerating population growth “should support total residential approvals” beyond 2022; house approvals up 0.9%, apartments down 3.1%; non-residential approvals down 6.1% in dollar terms, residential alterations down 2.2%.

Building approvals for dwellings, that is apartments and houses, had been heading south since mid-2018. As an indicator of investor confidence, falling approvals had presented a worrying signal, not just for the building sector but for the overall economy. However, approval figures from late-2019 and the early months of 2020 painted a picture of a recovery taking place, even as late as April of that year. Subsequent months’ figures then trended sharply upwards before falling back in 2021 and the first half of 2022.

The Australian Bureau of Statistics has released the latest figures from June and total residential approvals declined by 0.7% on a seasonally-adjusted basis. The fall over the month was higher than the 5.0% decrease which had been generally expected but it contrasted with May’s 11.2%. Total approvals fell by 17.2% on an annual basis, slightly higher than the previous month’s revised figure of -20.0%. Monthly growth rates are often volatile.

“There was considerable variation across states, with very strong growth in Victoria offset by declines in Queensland and South Australia,” said ANZ senior economist Adelaide Timbrell.

Commonwealth Government bond yields fell significantly on the day, to some degree following the falls of US Treasury yields overnight. By the close of business, the 3-year ACGB yield had lost 9bps to 2.74%, the 10-year yield had shed 12bps to 3.00% while the 20-year yield finished 6bps lower at 3.37%.

“Overall, it still looks like just a matter of time before the pressure from rising costs and interest rates impacts new dwelling approvals. The June quarter may have held up much better than expected but a significant hit still looms,” said Westpac senior economist Matthew Hassan.

ANZ’s Timbrell appeared somewhat more optimistic, at least in the medium-term. “Beyond 2022, accelerating population growth, as immigration recovers to near pre-pandemic rates, should support total residential approvals and reduce the risk of a ‘cliff’ in construction activity.”

Approvals for new houses increased by 0.9% over the month after declining by 1.8% in May. On a 12-month basis, house approvals were 22.1% lower than they were in June 2021, up from May’s comparable figure of -29.2%.                                                                      

Apartment approval figures are usually a lot more volatile and June’s total slid by 3.1% after a 37.6% jump in May. The 12-month growth figure deteriorated from May’s revised rate of -1.3% to -8.4%.

Non-residential approvals decreased by 6.1% in dollar terms over the month and by 8.4% on an annual basis. Figures in this segment also tend to be rather volatile.

Residential alteration approvals decreased by 2.2% in dollar terms over the month and were 0.7% lower than in June 2021.

“Price pressures may be easing”; encouraging sign inflation pressures easing in July PMI

01 August 2022

Summary: ISM PMI slightly down in July, above expectations; new order rates contracting, supplier deliveries improve, prices soften; sharp fall in price subindex “an encouraging sign”, pressures “may be easing”; latest reading implies 3.1% 12-month growth rate in December.

The Institute of Supply Management (ISM) manufacturing Purchasing Managers Index (PMI) reached a cyclical peak in September 2017. It then started a downtrend which ended in March 2020 with a contraction in US manufacturing which lasted until June 2020. Subsequent month’s readings implied growth had resumed, with the index becoming stronger through to March 2021. Since then, readings have remained at levels associated with economic growth despite some recent declines.

According to the ISM’s July survey, its PMI recorded a reading of 52.8%, above the generally expected figure of 52.1% but slightly lower than June’s 53.0%. The average reading since 1948 is 53.0% and any reading above 50% implies an expansion in the US manufacturing sector relative to the previous month.

“The US manufacturing sector continues expanding, though slightly less so in July, as new order rates continue to contract, supplier deliveries improve and prices soften to acceptable levels,” said Timothy Fiore, Chair of the ISM’s Manufacturing Business Survey Committee.

US Treasury yields fell on the day. By the close of business, the 2-year Treasury bond yield had lost 2bps to 2.86%, the 10-year yield had shed 8bps to 2.57% while the 30-year yield finished 9bps lower at 2.92%.

In terms of US Fed policy, expectations of higher federal funds rates over the next 12 months generally firmed a little. At the close of business, September contracts implied an effective federal funds rate of 2.51%, 18bps higher than the current spot rate while November contracts implied a rate of 3.16%. July 2023 futures contracts implied 3.045%, 72bps above the spot rate.

“It’s a reasonable print by historical standards but [it] reflects a sharp drop from the low 60s seen at the end of 2021 and the headline index is at a two-year low,” said ANZ Head of Australian Economics David Plank. He noted the sharp fall in the Prices subindex, stating it was “an encouraging sign that price pressures may be easing.”

Purchasing managers’ indices (PMIs) are economic indicators derived from monthly surveys of executives in private-sector companies. They are diffusion indices, which means a reading of 50% represents no change from the previous period, while a reading under 50% implies respondents reported a deterioration on average. A reading “above 48.7%, over a period of time, generally indicates an expansion of the overall economy” according to the ISM.        

The ISM’s manufacturing PMI figures appear to lead US GDP by several months despite a considerable error in any given month. The chart below shows US GDP on a “year on year” basis (and not the BEA annualised basis) against US GDP implied by monthly PMI figures. 

According to the ISM and its analysis of past relationships between the PMI and US GDP, July’s PMI corresponds to an annualised growth rate of 1.4%, or 0.4% over a quarter. Regression analysis on a year-on-year basis suggests a 12-month GDP growth rate of 3.1% five months after this latest report.

The ISM index is one of two monthly US PMIs, the other being an index published by IHS Markit. IHS Markit also produces a “flash” estimate in the last week of each month which comes out about a week before the ISM index is published. The IHS Markit July flash manufacturing PMI registered 52.3%, 0.4 percentage points lower than June’s final figure.

“May be past peak”; ANZ job ads fall in July

01 August 2022

Summary:  Job ads down 1.1% in July; 15.6% higher than same month in 2021; may be past peak but jobless rate still expected to fall; ads-to-workforce ratio steady at 1.7%.

From mid-2017 onwards, year-on-year growth rates in the total number of Australian job advertisements consistently exceeded 10%. That was until mid-2018 when the annual growth rate fell back markedly. 2019 was notable for its reduced employment advertising and this trend continued into the first quarter of 2020. Advertising plunged in April and May of 2020 as pandemic restrictions took effect but then recovered quite quickly.

According to the latest ANZ figures, total advertisements decreased by 1.1% in July on a seasonally adjusted basis. The fall followed a 0.4% increase in June and a 0.6% rise in May after revisions. On a 12-month basis, total job advertisements were 15.6% higher than in July 2021, down from June’s revised figure of 16.7%.

ANZ senior economist Catherine Birch said the fall may be “a signal that we may be past the peak.” However,  she also said ANZ “does not think that will translate immediately into rising unemployment and underemployment” and that “we now forecast unemployment to fall below 3% by early-2023.”

The figures were released on the same day as the latest reading of the Westpac-Melbourne Institute Inflation Gauge and Commonwealth Government bond yields generally increased. By the close of business, the 3-year ACGB yield had gained 6bps to 2.83%, the 10-year yield had added 4bps to 3.12% while the 20-year yield finished unchanged at 3.43%.

In the cash futures market, expectations of higher rates hardened with respect to the remainder of 2022 but remained largely unchanged for 2023. At the end of the day, contracts implied the cash rate would rise from the current rate of 1.31% to 1.76% in August and then increase to 2.13% by September. November contracts implied a 2.82% cash rate and May 2023 contracts implied 3.27%.

The inverse relationship between job advertisements and the unemployment rate has been quite strong (see below chart), although ANZ themselves called the relationship between the two series into question in early 2019.  A rising number of job advertisements as a proportion of the labour force is suggestive of lower unemployment rates in the near future while a falling ratio suggests higher unemployment rates will follow. July’s ads-to-workforce ratio remained unchanged at 1.7%.

In 2008/2009, advertisements plummeted and Australia’s unemployment rate jumped from 4% to nearly 6% over a period of 15 months. When a more dramatic fall in advertisements took place in April 2020, the unemployment rate responded much more quickly.

“Ongoing, broad-based” pressure evident in July Inflation Gauge

01 August 2022

Summary: Melbourne Institute Inflation Gauge index up 1.2% in July; up 5.4% on annual basis; “ongoing, broad-based inflationary pressure”.

The Melbourne Institute’s Inflation Gauge is an attempt to replicate the ABS consumer price index (CPI) on a monthly basis. It has turned out to be a reliable leading indicator of the CPI, although there are periods in which the Inflation Gauge and the CPI have diverged for as long as twelve months. On average, the Inflation Gauge’s annual rate tends to overestimate the ABS rate by around 0.1%.

The Melbourne Institute’s latest reading of its Inflation Gauge index indicates consumer prices increased by 1.2% in July. The rise follows a 0.3% increase in June and a 1.1% jump in May. On an annual basis, the index rose by 5.4%, up from 4.7% in June.

“The results suggest ongoing, broad-based inflationary pressure with higher prices observed for a wide range of goods and services, including utilities, rents, housing construction, food and insurance,” said the Melbourne Institute’s Associate Professor Sam Tsiaplias.

The figures were released on the same day as ANZ’s latest job advertisement report and Commonwealth Government bond yields generally increased. By the close of business, the 3-year ACGB yield had gained 6bps to 2.83%, the 10-year yield had added 4bps to 3.12% while the 20-year yield finished unchanged at 3.43%.

In the cash futures market, expectations of higher rates hardened with respect to the remainder of 2022 but remained largely unchanged for 2023. At the end of the day, contracts implied the cash rate would rise from the current rate of 1.31% to 1.76% in August and then increase to 2.13% by September. November contracts implied a 2.82% cash rate and May 2023 contracts implied 3.27%.

Central bankers desire a certain level of inflation which is “sufficiently low that it does not materially distort economic decisions in the community” but high enough so it does not constrain “a central bank’s ability to combat recessions.” Hence the recent obsession among central banks, including the RBA, to bring inflation back to their various targets.

Doubts on inflation normalisation after June core PCE inflation numbers

29 July 2022

Summary: US core PCE price index up 0.6% in June, more than expected; annual rate ticks up from 4.7% to 4.8%; normalising of inflation pressures in doubt after report; long-term Treasury yields down modestly; rate rises still expected.

One of the US Fed’s favoured measures of inflation is the change in the core personal consumption expenditures (PCE) price index. After hitting the Fed’s target at the time of 2.0% in mid-2018, the annual rate then hovered in a range between 1.8% and 2.0% before it eased back to a range between 1.5% and 1.8% through 2019. It then plummeted below 1.0% in April 2020 before rising back to around 1.5% in the September quarter of that year. It has since increased significantly above the Fed’s target.

The latest figures have now been published by the Bureau of Economic Analysis as part of the June personal income and expenditures report. Core PCE prices rose by 0.6% over the month, slightly more than the 0.5% which had been generally expected but double May’s 0.3% increase. On a 12-month basis, the core PCE inflation rate ticked up from May’s figure of 4.7% to 4.8%.

ANZ senior economist Adelaide Timbrell said the figures places doubt on “the notion that inflation pressures are on the brink of normalising completely.”

Long-term US Treasury bond yields declined modestly on the day. By the close of business, 10-year and 30-year Treasury bond yield had both lost 2bps to 2.65% and 3.01% respectively. The 2-year yield finished 2bps higher at 2.88%.

In terms of US Fed policy, expectations of a higher federal funds rate over the next 12 months softened, particularly with respect to 2023. At the close of business, September contracts implied an effective federal funds rate of 2.505%, 18bps higher than the current spot rate while November contracts implied a rate of 3.155%. July 2023 futures contracts implied 3.02%, 69bps above the spot rate.

The core version of PCE strips out energy and food components, which are volatile from month to month, in an attempt to identify the prevailing trend. It is not the only measure of inflation used by the Fed; the Fed also tracks the Consumer Price Index (CPI) and the Producer Price Index (PPI) from the Department of Labor. However, it is the one measure which is most often referred to in FOMC minutes.

Lending growth steady at 9% in June; RBA moves to “dent demand”

29 July 2022

Summary: Private sector credit up 0.9% in June, above expectations; annual growth rate up from 8.6% to 9.0%; “tightening of policy will dent demand for credit”; business loans account for about 55% of net growth again.

The pace of lending to the non-bank private sector by financial institutions in Australia followed a steady-but-gradual downtrend from late-2015 through to early 2020 before hitting what appears to be a nadir in March 2021. That downtrend ended later in the same year and now annual growth rates are above the peak rate seen in the previous decade.

According to the latest RBA figures, private sector credit increased by 0.9% in June. The result was greater than the 0.7% increase which had been generally expected but in line with May’s 0.9% increase after it was revised up. On an annual basis, the growth rate remained steady at 9.1% after revisions.

“Importantly, a policy u-turn is now underway. The RBA is quickly removing ultra-easy monetary policy, on the way to a contractionary stance, to fight a significant inflation challenge,” said Westpac senior economist Andrew Hanlan. “The tightening of policy will dent demand for credit, across households and businesses.”

Commonwealth Government bond yields fell heavily on the day, outpacing the substantial falls of US Treasury yields overnight. By the close of business, the 3-year ACGB yield had dropped by 20bps to 2.77%, the 10-year yield had lost 15bps to 3.08% while the 20-year yield finished 4bps lower at 3.43%.

In the cash futures market, expectations of higher rates eased. At the end of the day, contracts implied the cash rate would rise from the current rate of 1.31% to 1.75% in August and then increase to 2.08% by September. November contracts implied a 2.755% cash rate while May 2023 contracts implied 3.19%.

Business loans again accounted for about 55% of the net growth over the month, while owner-occupier loans and investor loans accounted for the balance. Total personal debt decreased a little.

The traditional driver of loan growth rates, the owner-occupier segment, grew by 0.6% over the month, down from Mya’s 0.7% increase. The sector’s 12-month growth rate slowed again, this time from 8.9% to 8.6%.

Total lending in the business sector increased by 1.5%, slightly more than the 1.4% increase recorded in May. Growth on an annual basis accelerated from 13.0% to 13.2%.

Monthly growth in the investor-lending segment slowed to a halt in early 2018. Shortly into the 2019/20 financial year, monthly growth rates slipped into the red before posting a series of flat or near-flat results until mid-2020. In June, net lending grew by 0.6%, in line with increases in March, April and May. The 12-month growth rate accelerated from 6.1% to 6.4%.                         

Total personal loans contracted by 0.4%, down from May’s 0.1% increase, but still slowing the annual contraction rate from 2.8% to 2.7%. This category of debt includes fixed-term loans for large personal expenditures, credit cards and other revolving credit facilities.

Another fall from euro sentiment index in July

28 July 2022

Summary: Euro-zone composite sentiment index down in July; below expectations; readings down in all five sectors; down in all four large economies; German, French 10-year yields materially lower; index implies annual GDP growth of 1.2%.

The European Commission’s Economic Sentiment Indicator (ESI) is a composite index comprising five differently weighted sectoral confidence indicators.  It is heavily weighted towards confidence surveys from the business sector, with the consumer confidence sub-index only accounting for 20% of the ESI. However, it has a good relationship with euro-zone GDP, although not as a leading indicator.

The ESI posted a reading of 99.0 in July, below the consensus expectation of 101.0 as well as June’s revised reading of 103.5. The average reading since 1985 is approximately 100.

German and French 10-year bond yields finished the day markedly lower. By the close of business, both had shed 14bps to 0.81% and 1.38% respectively.

Confidence deteriorated in all five sectors of the economy. On a geographical basis, the ESI declined in all the euro-zone’s four largest economies.

End-of-quarter ESI readings and annual euro-zone GDP growth rates are highly correlated. This latest reading corresponds to a year-to-July GDP growth rate of 1.2%, down from June’s implied growth rate of 2.3% after revisions.

Recession: US GDP contracts for second consecutive quarter

28 July 2022

Summary:  US GDP down 0.2% (0.9% annualised) in June quarter; contrasts with 0.1% increase (0.5% annualised) expected; a little stronger than headline number suggests; all up a “disappointing” report; GDP price deflator annual rate rises from 6.9% to 7.5%.

US GDP growth slowed in the second quarter of 2019 before stabilising at about 0.5% per quarter.  At the same time, US bond yields suggested future growth rates would be below trend. The US Fed agreed and it reduced its federal funds range three times in the second half of 2019. Pandemic restrictions in the June quarter of 2020 sent parts of the US economy into hibernation; the lifting of those same restrictions sparked a rapid recovery.

The US Bureau of Economic Analysis has now released June quarter “advance” GDP estimates and they indicate the US economy contracted by 0.2% or at an annualised rate of 0.9%. The contraction contrasted with the 0.1% increase (+0.5% annualised) which had been generally expected but it was smaller than the March quarter’s -0.2% after revisions.

“While technically a recession, the details were a little stronger than the headline number suggests,” said ANZ economist Kishti Sen. “A lot of the weakness came from inventories which subtracted 2ppts from the headline figure.”

US GDP numbers are published in a manner which is different to most other countries; quarterly figures are compounded to give an annualised figure. In countries such as Australia and the UK, an annual figure is calculated by taking the latest number and comparing it with the figure from the same period in the previous year. The diagram above shows US GDP once it has been expressed in the normal manner, as well as the annualised figure.

US Treasury bond yields dropped materially on the day. By the close of business, the 2-year Treasury bond yield had shed 16bps to 2.86%, the 10-year yield had lost 12bps to 2.67% while the 30-year yield finished 4bps lower at 3.03%.

In terms of US Fed policy, expectations for a higher federal funds rate over the next 12 months softened. At the close of business, September contracts implied an effective federal funds rate of 2.505%, 18bps higher than the current spot rate. November contracts implied 3.14% while July 2023 futures contracts implied an effective federal funds rate of 2.98%, 65bps above the spot rate.

Sen noted personal consumption had not increased as much as expected while private fixed investment had decreased by 3.9%. “All up, it was still a disappointing report, even when accounting for the outsized influence of the inventories number.”

One part of the report which is often overlooked are the figures regarding the GDP price deflator, which is another measure of inflation. The GDP price deflator is restricted to new, domestically-produced goods and services and it is not based on a fixed basket as is the case for the consumer price index (CPI). The annual rate rose from the March quarter’s revised figure of 6.9% to 7.5%.


“Recession risks persist”: Conf. Board confidence Index slides again in July

26 July 2022

Summary: Conference Board Consumer Confidence Index deteriorates again in July; reading less than consensus expectations; views of present conditions, short-term outlook both deteriorate; “recession risks persist”; inflation, rate hikes likely posing strong headwinds for consumer spending.

US consumer confidence clawed its way back to neutral over the five years after the GFC in 2008/2009 and then went from strength to strength until late 2018. Measures of consumer confidence then oscillated within a relatively narrow band at historically high levels until they plunged in early 2020. Subsequent readings then fluctuated around the long-term average until March 2021 when they reached elevated levels. However, a noticeable gap has since opened between the two most-widely followed surveys.

The latest Conference Board survey held during the first three weeks of July indicated US consumer confidence has deteriorated again. July’s Consumer Confidence Index registered 95.7 on a preliminary basis, less than the median consensus figure of 96.4 as well as June’s final figure of 98.7.

Consumers’ views of present conditions and the near future both deteriorated again. The Present Situation Index dropped from June’s revised figure of 147.2 to 141.3 while the Expectations Index slipped from a revised figure of 65.8 to 65.3.

“The Expectations Index held relatively steady, but remained well below a reading of 80, suggesting recession risks persist,” said Lynn Franco, a senior director at The Conference Board. “Concerns about inflation, rising gas and food prices in particular, continued to weigh on consumers.”

Short-term US Treasury yields moved a little higher on the day. By the close of business, the 2-year Treasury bond yield had added 2bps to 3.05% while 10-year and 30-year yields both finished unchanged at 2.80% and 3.03% respectively.

In terms of US Fed policy, expectations for a higher federal funds rate over the next 12 months softened slightly. At the close of business, July contracts implied an effective federal funds rate of 1.68%, 10bps higher than the current spot rate while September contracts implied a rate of 2.54%. July 2023 futures contracts implied 3.13%, 155bps above the spot rate.

“As the Fed raises interest rates to rein in inflation, purchasing intentions for cars, homes and major appliances all pulled back further in July,” Franco added. ”Looking ahead, inflation and additional rate hikes are likely to continue posing strong headwinds for consumer spending and economic growth over the next six months.”

The Consumer Confidence Survey is one of two widely followed monthly US consumer sentiment surveys which produce sentiment indices. The Conference Board’s index is based on perceptions of current business and employment conditions, as well as respondents’ expectations of conditions six months in the future. The other survey, conducted by the University of Michigan, is similar and it is used to produce an Index of Consumer Sentiment. That survey differs in that it does not ask respondents explicitly about their views of the labour market and it also includes some longer-term questions.

Click for more news