News

Home loan approvals surprise in May

04 July 2022

Summary: Value of loan commitments up 1.7% in May; housing downturn emerging; too early to see impact of May’s rate increase; value of owner-occupier loan approvals up 2.1%, investor approvals up 0.9%; number of home loan approvals up 2.9%.

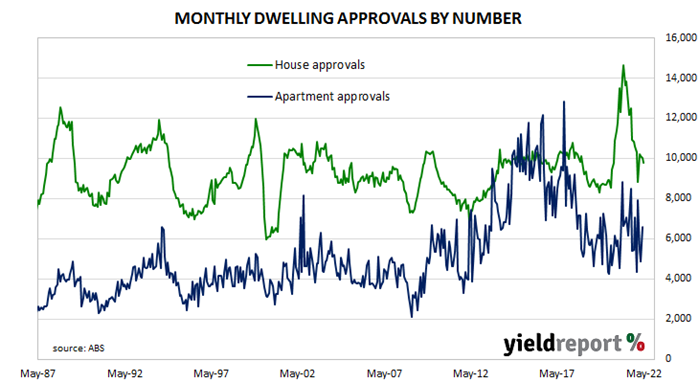
After the RBA reduced its cash rate target in a series of cuts beginning in mid-2019 the number and value of approvals began to noticeably increase, potentially ending the downtrend which had been in place since mid-2017. Figures from February through to May of 2020 provided an indication the downtrend was still intact but subsequent figures then pushed both back to elevated levels.

May’s housing finance figures have now been released and total loan approvals excluding refinancing increased by 1.7% In dollar terms over the month, in contrast to the 2.5% fall which had been generally expected as well as April’s -2.8%. On a year-on-year basis, total approvals excluding refinancing declined by 0.4%, down from the previous month’s comparable figure of +2.6%.

“The April and May results still leave in place a housing downturn emerging in 2022,” said Westpac senior economist Andrew Hanlan. “However, the rate of decline to date in official figures paints a more orderly adjustment than appeared to be the case a month ago.”

The figures were released on the same day as several other domestic data reports and Commonwealth Government bond yields fell modestly. By the close of business, the 3-year ACGB yield had shed 4bps to 3.16%, the 10-year yield had lost 3bps to 3.62% while the 20-year yield finished 2bps lower at 3.84%.

“It’s too early to see the impact of the RBA’s first rate hike since 2010 in these May numbers,” said ANZ senior economist Felicity Emmett. “But higher rates will eventually bite and drive housing finance and building approvals lower.”

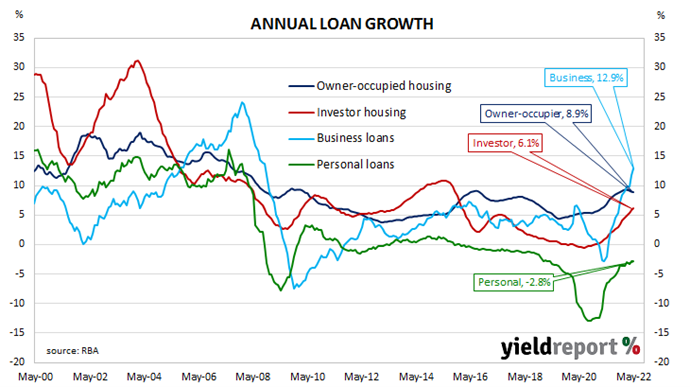
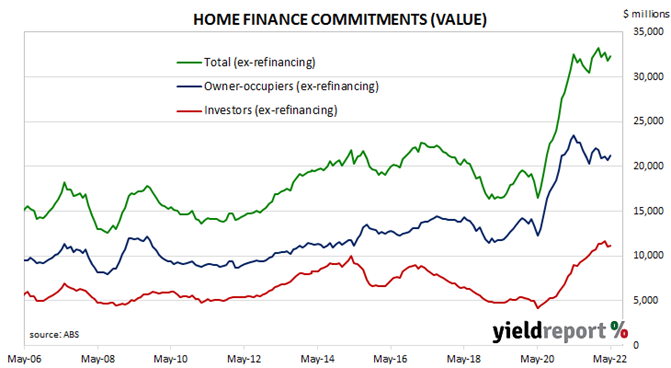
The total value of owner-occupier loan commitments excluding refinancing increased by 2.1%, in contrast to April’s 1.7% decrease. On an annual basis, owner-occupier loan commitments were 9.7% lower than in May 2021, whereas April’s annual growth figure was -9.6%.

The total value of investor commitments excluding refinancing arrangements increased by 0.9%. The rise followed a 4.8% fall in April. On an annual basis, the value of loan commitments in the month was 23.7% higher than in May 2021, down from 37.1% in April.

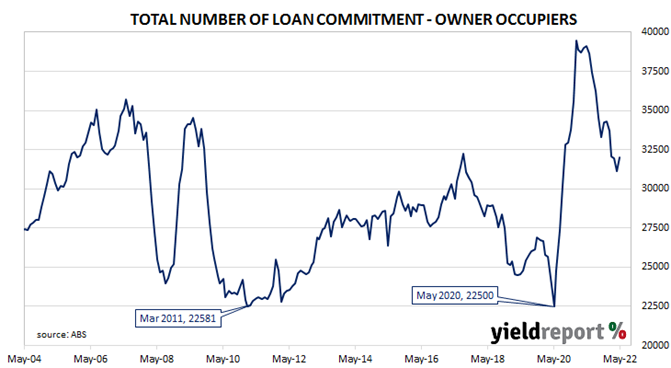
The total number of loan commitments (excluding refinancing loans) to owner-occupiers rose by 2.9% to 32,035. The increase contrasted with April’s 2.5% fall and the annual contraction rate eased slightly, from -20.1% in April to -18.1%.

Job ads increase in June; demand for labour still outpacing supply

04 July 2022

Summary:  Job ads up 1.4% in May; 18.4% higher than same month in 2021; labour demand still outpacing supply; suggests underutilisation will keep falling; ads-to-workforce ratio steady at 1.7%.

From mid-2017 onwards, year-on-year growth rates in the total number of Australian job advertisements consistently exceeded 10%. That was until mid-2018 when the annual growth rate fell back markedly. 2019 was notable for its reduced employment advertising and this trend continued into the first quarter of 2020. Advertising plunged in April and May of 2020 as pandemic restrictions took effect but then recovered quite quickly.

According to the latest ANZ figures, total advertisements increased by 1.4% in June on a seasonally adjusted basis. The rise followed a 1.0% increase in May and a 1.7% fall in April after revisions. On a 12-month basis, total job advertisements were 18.4% higher than in June 2021, up from May’s revised figure of 17.4%.

“Growth in demand for labour is still outpacing supply,” said ANZ senior economist Catherine Birch.

The figures were released on the same day as several other domestic data reports and Commonwealth Government bond yields fell modestly. By the close of business, the 3-year ACGB yield had shed 4bps to 3.16%, the 10-year yield had lost 3bps to 3.62% while the 20-year yield finished 2bps lower at 3.84%.

In the cash futures market, expectations of higher rates eased a little. At the end of the day, contracts implied the cash rate would rise from the current rate of 0.81% to 1.185% in July and then increase to 1.655% by August. November contracts implied a 2.74% cash rate and May 2023 contracts implied 3.54%.

Birch added “the sheer volume of unmet labour demand suggests underutilisation will keep falling and stay low” despite higher inflation rates and higher interest rates.” She expects a “very tight labour market” to keep the Australian economy “resilient”.

The inverse relationship between job advertisements and the unemployment rate has been quite strong (see below chart), although ANZ themselves called the relationship between the two series into question in early 2019.  A rising number of job advertisements as a proportion of the labour force is suggestive of lower unemployment rates in the near future while a falling ratio suggests higher unemployment rates will follow. June’s ads-to-workforce ratio remained unchanged at 1.7%.

In 2008/2009, advertisements plummeted and Australia’s unemployment rate jumped from 4% to nearly 6% over a period of 15 months. When a more dramatic fall in advertisements took place in April 2020, the unemployment rate responded much more quickly.

June Inflation Gauge reading “consistent with elevated inflation”

04 July 2022

Summary: Melbourne Institute Inflation Gauge index up 0.3% in June; up 4.7% on annual basis; “consistent with elevated inflation”; implies official CPI reading of 0.4% in June quarter.

The Melbourne Institute’s Inflation Gauge is an attempt to replicate the ABS consumer price index (CPI) on a monthly basis. It has turned out to be a reliable leading indicator of the CPI, although there are periods in which the Inflation Gauge and the CPI have diverged for as long as twelve months. On average, the Inflation Gauge’s annual rate tends to overestimate the ABS rate by around 0.1%.

The Melbourne Institute’s latest reading of its Inflation Gauge index indicates consumer prices increased by 0.3% in June. The rise follows a 1.1% jump in May and a 0.1% decline in April. On an annual basis, the index rose by 4.7%, down from 4.8% in May.

“The Melbourne Institute data overall remains consistent with elevated inflation and aligns with our expectation for another very strong CPI print in Q2, where published trimmed mean inflation is likely to be similar or stronger than the 1.4% seen in Q1,” said NAB economist Taylor Nugent.

The figures were released on the same day as several other domestic data reports and Commonwealth Government bond yields fell modestly. By the close of business, the 3-year ACGB yield had shed 4bps to 3.16%, the 10-year yield had lost 3bps to 3.62% while the 20-year yield finished 2bps lower at 3.84%.

In the cash futures market, expectations of higher rates eased a little. At the end of the day, contracts implied the cash rate would rise from the current rate of 0.81% to 1.185% in July and then increase to 1.655% by August. November contracts implied a 2.74% cash rate and May 2023 contracts implied 3.54%.

Given the Inflation Gauge’s tendency to overestimate, the latest figures imply an official CPI reading of 0.4% (seasonally adjusted) for the June quarter or 4.6% in annual terms. However, it is worth noting the annual CPI rate to the end of March was 5.2% while the Inflation Gauge had implied a 3.9% annual rate at the time.

Dwelling approvals downtrend still in place in May

04 July 2022

Summary: Home approval numbers up 9.9% in May, above expectations; down-trend still in place; house approvals down 2.4% by number, apartments up 35.1%; house approvals “particularly weak”, unit approvals trending sideways; non-residential approvals up 16.5% in dollar terms, residential alterations up 3.8%.

Building approvals for dwellings, that is apartments and houses, had been heading south since mid-2018. As an indicator of investor confidence, falling approvals had presented a worrying signal, not just for the building sector but for the overall economy. However, approval figures from late-2019 and the early months of 2020 painted a picture of a recovery taking place, even as late as April of that year. Subsequent months’ figures then trended sharply upwards before falling back in 2021.

The Australian Bureau of Statistics has released the latest figures from May and total residential approvals increased by 9.9% on a seasonally-adjusted basis. The rise over the month contrasted with the 2.0% decline which had been generally expected, as well as the 3.9% fall in April. Total approvals fell by 20.9% on an annual basis, slightly higher than the previous month’s revised figure of -26.42%. Monthly growth rates are often volatile.

“Although ongoing volatility makes trends harder to read, the underlying detail suggests the down-trend in dwelling approvals, as more firmly established in the April result, still remains in place,” said Westpac economist Ryan Wells.

The figures were released on the same day as several other domestic data reports and Commonwealth Government bond yields fell modestly. By the close of business, the 3-year ACGB yield had shed 4bps to 3.16%, the 10-year yield had lost 3bps to 3.62% while the 20-year yield finished 2bps lower at 3.84%.

In the cash futures market, expectations of higher rates eased a little. At the end of the day, contracts implied the cash rate would rise from the current rate of 0.81% to 1.185% in July and then increase to 1.655% by August. November contracts implied a 2.74% cash rate and May 2023 contracts implied 3.54%.

“Approvals are now down 30% from the peak, as activity brought forward by the HomeBuilder program unwinds,” noted ANZ senior economist Felicity Emmett. “House approvals are particularly weak and are likely to continue to trend lower. Unit approvals are trending sideways. While higher rates will be a headwind, rising immigration and a strong rental market may provide support for higher density approvals.”

Approvals for new houses fell by 2.4% over the month after falling by 0.5% in April. On a 12-month basis, house approvals were 29.2% lower than they were in May 2021, down from April’s comparable figure of -26.3%.                                                                             

Apartment approval figures are usually a lot more volatile and May’s total jumped by 35.1% after a 10.3% fall in April. The 12-month growth figure improved from April’s revised rate of -26.4% to -4.2%.

Non-residential approvals increased by 16.5% in dollar terms over the month and by 6.3% on an annual basis. Figures in this segment also tend to be rather volatile.

Residential alteration approvals increased by 3.8% in dollar terms over the month and were 2.1% higher than in May 2021.

“Another piece of evidence” US economy is slowing from June ISM PMI

01 July 2022

Summary: ISM PMI down in June, below expectations; progress made on addressing moderate-term labour shortages at all tiers; “yet another piece of evidence that the US economy is slowing”; latest reading implies 3.1% 12-month growth rate in November.

The Institute of Supply Management (ISM) manufacturing Purchasing Managers Index (PMI) reached a cyclical peak in September 2017. It then started a downtrend which ended in March 2020 with a contraction in US manufacturing which lasted until June 2020. Subsequent month’s readings implied growth had resumed, with the index becoming stronger through to March 2021. Since then, readings have remained at levels associated with solid economic growth despite some recent declines.

According to the ISM’s June survey, its PMI recorded a reading of 53.0%, below the generally expected figure of 55.4% and lower than May’s 53.6%. The average reading since 1948 is 53.0% and any reading above 50% implies an expansion in the US manufacturing sector relative to the previous month.

“The US manufacturing sector continues to be powered, though less so in June, by demand while held back by supply chain constraints,” said Timothy Fiore, Chair of the ISM’s Manufacturing Business Survey Committee. He noted respondents had pointed to progress “on addressing moderate-term labour shortages at all tiers of the supply chain…”

US Treasury yields fell materially on the day. By the close of business, the 2-year Treasury bond yield had dropped by 14bps to 2.83%, the 10-year yield had shed 13bps to 2.89% while the 30-year yield finished 7bps lower at 3.12%.

In terms of US Fed policy, expectations of higher federal funds rates over the next 12 months generally eased. At the close of business, July contracts implied an effective federal funds rate of 1.685%, 10bps higher than the current spot rate while September contracts implied a rate of 2.435%. June 2023 futures contracts implied 3.22%, 164bps above the spot rate.

“The softer ISM was yet another piece of evidence that the US economy is slowing, after the weaker than expected consumer and investment figures last week,” said NAB currency strategist Rodrigo Catril. “Importantly too, while the data is suggesting a US economic slowdown is coming, we are not yet seeing signs of an ease in inflationary pressures, an important distinction given the Fed will continue with its aggressive tightening approach until it sees evidence of the latter.”

Purchasing managers’ indices (PMIs) are economic indicators derived from monthly surveys of executives in private-sector companies. They are diffusion indices, which means a reading of 50% represents no change from the previous period, while a reading under 50% implies respondents reported a deterioration on average.

A reading “above 48.7%, over a period of time, generally indicates an expansion of the overall economy” according to the ISM.

The ISM’s manufacturing PMI figures appear to lead US GDP by several months despite a considerable error in any given month. The chart below shows US GDP on a “year on year” basis (and not the BEA annualised basis) against US GDP implied by monthly PMI figures. 

According to the ISM and its analysis of past relationships between the PMI and US GDP, June’s PMI corresponds to an annualised growth rate of 1.5%, or 0.4% over a quarter. Regression analysis on a year-on-year basis suggests a 12-month GDP growth rate of 3.1% five months after this latest report.

The ISM index is one of two monthly US PMIs, the other being an index published by IHS Markit. IHS Markit also produces a “flash” estimate in the last week of each month which comes out about a week before the ISM index is published. The IHS Markit June flash manufacturing PMI registered 52.4%, 4.6 percentage points lower than May’s final figure.

Lending growth hits 9% in May as part of “late-cycle flourish”

30 June 2022

Summary: Private sector credit up 0.8% in May, above expectations; annual growth rate up from 8.6% to 9.0%; “a late cycle flourish”, likely near peak; business loans account for about 55% of net growth.

The pace of lending to the non-bank private sector by financial institutions in Australia followed a steady-but-gradual downtrend from late-2015 through to early 2020 before hitting what appears to be a nadir in March 2021. That downtrend ended later in the same year and now annual growth rates are above the peak rate seen in the previous decade.

According to the latest RBA figures, private sector credit increased by 0.8% in May. The result was greater than the 0.6% increase which had been generally expected but slightly less than April’s 0.9% increase after it was revised up from 0.8%. On an annual basis, the growth rate accelerated from April’s figure of 8.6% to 9.0%.

“We interpret the strength of the past two months as likely representing a late-cycle flourish,” said Westpac senior economist Andrew Hanlan. “Annual credit growth at 9% currently is, or is likely very near, what will be the cycle peak.”

Commonwealth Government bond yields fell on the day, especially at the short end. By the close of business, the 3-year ACGB yield had shed 9bps to 3.37%, the 10-year yield had lost 4bps to 3.72% while the 20-year yield finished 2bps lower at 3.92%.

In the cash futures market, expectations of higher rates were wound back. At the end of the day, contracts implied the cash rate would rise from the current rate of 0.81% to 1.185% in July and then increase to 1.685% by August. November contracts implied a 2.82% cash rate while May 2023 contracts implied 3.66%.

Business loans accounted for about 55% of the net growth over the month, while owner-occupier loans and investor loans accounted for the balance. Total personal debt increased slightly.

The traditional driver of loan growth rates, the owner-occupier segment, grew by 0.6% over the month, in line with increases in March and April. The sector’s 12-month growth rate slowed slightly, from 9.0% to 8.9%.

Total lending in the business sector increased by 1.3%, slightly less than the 1.5% increase recorded in April. Growth on an annual basis accelerated from 11.7% to 12.9%.

Monthly growth in the investor-lending segment slowed to a halt in early 2018. Shortly into the 2019/20 financial year, monthly growth rates slipped into the red before posting a series of flat or near-flat results until mid-2020. In May, net lending grew by 0.6%, in line with increases in March and April. The 12-month growth rate accelerated from 5.8% to 6.1%.                                   

Total personal loans expanded by just 0.1%, down from April’s 0.3%, maintaining the annual contraction rate at 2.8%. This category of debt includes fixed-term loans for large personal expenditures, credit cards and other revolving credit facilities.

Core PCE inflation slows in May; “still too high” for Fed

30 June 2022

Summary: US core PCE price index up 0.3% in May, less than expected; annual rate slows from 4.9% to 4.7%; still too high for Fed; Treasury yields down; 168bps of Fed rate rises priced in over next 12 months.

One of the US Fed’s favoured measures of inflation is the change in the core personal consumption expenditures (PCE) price index. After hitting the Fed’s target at the time of 2.0% in mid-2018, the annual rate then hovered in a range between 1.8% and 2.0% before it eased back to a range between 1.5% and 1.8% through 2019. It then plummeted below 1.0% in April 2020 before rising back to around 1.5% in the September quarter of that year. It has since increased significantly above the Fed’s target.

The latest figures have now been published by the Bureau of Economic Analysis as part of the May personal income and expenditures report. Core PCE prices rose by 0.3% over the month, less than the 0.5% which had been generally expected but in line with April’s increase. On a 12-month basis, the core PCE inflation rate slowed from April’s figure of 4.9% to 4.7%.

NAB senior economist Tapas Strickland said the annual rate was “still too high for the Fed and unlikely to sway them from their current path.”

US Treasury bond yields fell on the day. By the close of business, the 2-year Treasury bond yield had shed 9bps to 2.97%, the 10-year yield had lost 8bps to 3.02% with the 30-year yield finished 3bps lower at 3.19%.

In terms of US Fed policy, expectations of a higher federal funds rate over the next 12 months softened, particularly with respect to 2023. At the close of business, July contracts implied an effective federal funds rate of 1.67%, 9bps higher than the current spot rate while September contracts implied a rate of 2.425%. June 2023 futures contracts implied 3.26%, 168bps above the spot rate.

The core version of PCE strips out energy and food components, which are volatile from month to month, in an attempt to identify the prevailing trend. It is not the only measure of inflation used by the Fed; the Fed also tracks the Consumer Price Index (CPI) and the Producer Price Index (PPI) from the Department of Labor. However, it is the one measure which is most often referred to in FOMC minutes.

Spending holding up; May retail rises 0.9%

29 June 2022

Summary: Retail sales up 0.9% in May; higher than expected; broader spending holding up, reflects tight job market, strong household balance sheet; shift towards higher prices, slower volume growth; largest influence on month from department store sales.

Growth figures of domestic retail sales spent most of the 2010s at levels below the post-1992 average. While economic conditions had been generally favourable, wage growth and inflation rates were low. Expenditures on goods then jumped in the early stages of 2020 as government restrictions severely altered households’ spending habits. Households reverted to their usual patterns as restrictions eased in the latter part of 2020 and throughout 2021, although not for all categories.

According to the latest ABS figures, total retail sales increased by 0.9% in May on a seasonally adjusted basis. The rise was noticeably greater than the 0.3% increase which had been expected but in line with April’s rise. On an annual basis, retail sales increased by 10.4%, up from April’s comparable figure of 9.6%.

“This release shows broader spending continues to hold up, reflecting the tight labour market and strong balance sheets of households,” said Morgan Stanley Australia economist Chris Read. “While the increasing headwinds of higher rates and lower house prices have already had a significant impact on consumer sentiment, it does not look to be flowing through to spending at this stage.”

Commonwealth bond yields fell noticeably on the day. By the close of business, the 3-year ACGB yield had shed 7bps to 3.46%, the 10-year rate had lost 5bps to 3.76% while the 20-year yield finished 6bps lower at 3.94%.

In the cash futures market, rate-rise expectations softened a little. At the end of the day, contracts implied the cash rate would rise from the current rate of 0.81% to 1.195% in July and then increase to 1.685% by August. November contracts implied a 2.835% cash rate while May 2023 contracts implied 3.71%.

“The key question is the extent to which the sustained momentum in nominal sales is concealing a shift towards higher prices and slower growth in volumes,” said Westpac senior economist Matthew Hassan.

Retail sales are typically segmented into six categories (see below), with the “food” segment accounting for nearly 40% of total sales. However, the largest influence on the total during the month came from the “Department Stores” segment which increased by 5.1% over the month and thus contributed 0.27 percentage points of the 0.90% increase. Clothing sales fell by 1.4% over the month and deducted 0.12 percentage points.

Euro sentiment index continues slide in June

29 June 2022

Summary: Euro-zone composite sentiment index down in June; slightly above expectations; readings down in all five sectors; down in all four large economies; German, French 10-year yields substantially lower; index implies GDP growth of 2.4%.

The European Commission’s Economic Sentiment Indicator (ESI) is a composite index comprising five differently weighted sectoral confidence indicators.  It is heavily weighted towards confidence surveys from the business sector, with the consumer confidence sub-index only accounting for 20% of the ESI. However, it has a good relationship with euro-zone GDP, although not as a leading indicator.

The ESI posted a reading of 104.0 in June, slightly above the consensus expectation of 103.0 but below May’s reading of 105.0. The average reading since 1985 is approximately 100.

German and French 10-year bond yields finished the day substantially lower. By the close of business, both had shed 11bps to 1.51% and 2.06% respectively.

Confidence deteriorated in all five sectors of the economy. On a geographical basis, the ESI declined in all the euro-zone’s four largest economies.

End-of-quarter ESI readings and annual euro-zone GDP growth rates are highly correlated. This latest reading corresponds to a year-to-June GDP growth rate of 2.4%, down from May’s implied growth rate of 2.6%.

Conf. Board Confidence Index down again, “growing risk of recession”

28 June 2022

Summary: Conference Board Consumer Confidence Index deteriorates again in June, lower than consensus expectations; views of present conditions, short-term outlook deteriorate; Expectations Index falls to lowest point in decade; weaker growth expected in second half, “growing risk of recession”.

US consumer confidence clawed its way back to neutral over the five years after the GFC in 2008/2009 and then went from strength to strength until late 2018. Measures of consumer confidence then oscillated within a relatively narrow band at historically high levels until they plunged in early 2020. Subsequent readings then fluctuated around the long-term average until March 2021 when they reached elevated levels. However, a noticeable gap has since opened between the two most-widely followed surveys.

The latest Conference Board survey held during the first three weeks of June indicated US consumer confidence has deteriorated again. June’s Consumer Confidence Index registered 98.7 on a preliminary basis, lower than the median consensus figure of 100.0 as well as May’s final figure of 103.2.

Consumers’ views of present conditions and the near future both deteriorated. The Present Situation Index slipped from May’s revised figure of 147.4 to 147.1 while the Expectations Index dropped from a revised figure of 73.7 to 66.4.

“While the Present Situation Index was relatively unchanged, the Expectations Index continued its recent downward trajectory, falling to its lowest point in nearly a decade,” said Lynn Franco, a senior director at The Conference Board. He attributed the “grimmer outlook” to rising fuel and food prices were the main concerns of consumers.

US Treasury yields moved lower on the day. By the close of business, 2-year and 10-year Treasury bond yields had both lost 2bps to 3.11% and 3.18% respectively while the 30-year yield finished 3bps lower at 3.28%.

In terms of US Fed policy, expectations for a higher federal funds rate over the next 12 months softened slightly. At the close of business, July contracts implied an effective federal funds rate of 1.68%, 10bps higher than the current spot rate while September contracts implied a rate of 2.45%. June 2023 futures contracts implied 3.535%, 195bps above the spot rate.

Franco pointed out the latest reading of the Expectations Index suggests “weaker growth in the second half of 2022 as well as growing risk of recession by year-end.”

The Consumer Confidence Survey is one of two widely followed monthly US consumer sentiment surveys which produce sentiment indices. The Conference Board’s index is based on perceptions of current business and employment conditions, as well as respondents’ expectations of conditions six months in the future. The other survey, conducted by the University of Michigan, is similar and it is used to produce an Index of Consumer Sentiment. That survey differs in that it does not ask respondents explicitly about their views of the labour market and it also includes some longer-term questions.

Click for more news