News

Rising energy prices, gas shortages threat “of great concern”: June ifo survey

24 June 2022

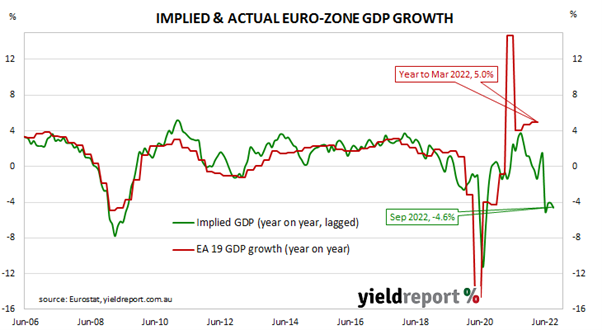
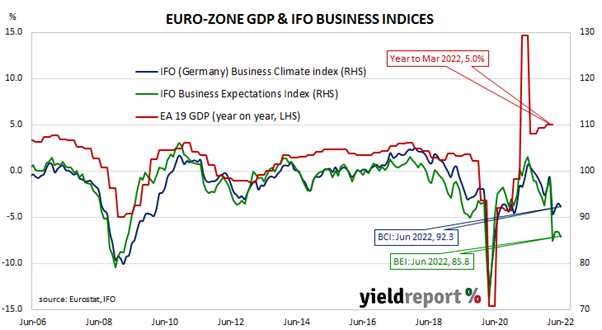
Summary: ifo business climate index down in June, slightly above expected figure; current conditions index, expectations index both down; rising energy prices, threat of gas shortages “of great concern”; expectations index implies euro-zone GDP contraction of 4.6% in year to September 2022.

Following a recession in 2009/2010, the ifo Institute’s Business Climate Index largely ignored the European debt-crisis of 2010-2012, mostly posting average-to-elevated readings through to early-2020. However, the index was quick to react in the March 2020 survey, falling precipitously. Readings through much of 2021 generally fluctuated around the long-term average before dropping away in 2022.

According to the latest report released by ifo, German business sentiment has further deteriorated. June’s Business Climate Index recorded a reading of 92.3, just above the consensus expectation of 92.0 but slightly below May’s final reading of 93.0. The average reading since January 2005 is just above 97.

“Companies were somewhat less satisfied with their current business situation. Their expectations turned markedly more pessimistic,” said Clemens Fuest, President of the ifo Institute. “Rising energy prices and the threat of gas shortages are of great concern to German business.”

German firms’ views of current conditions and their outlook both deteriorated. The current situation index slipped from May’s revised figure of 99.6 to 99.3 while the expectations index decreased from 86.9 to 85.8.

German and French long-term bond yields both increased modestly on the day. By the close of business, the German 10-year bund rate had added 2ps to 1.44% while the French 10-year OAT yield finished 1bp higher at 1.97%.

The ifo Institute’s business climate index is a composite index that combines German companies’ views of current conditions with their outlook for the next six months. It has similarities to consumer sentiment indices in the US such as the ones produced by The Conference Board and the University of Michigan.

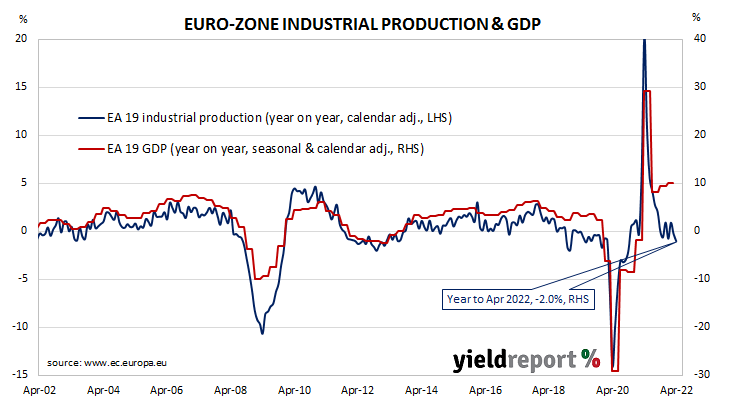
It also displays a solid correlation with euro-zone GDP growth rates. However, the expectations index is a better predictor as it has a higher correlation when lagged by one quarter. June’s expectations index implies a 4.6% year-on-year GDP contraction to the end of September 2022.

Euro consumer sentiment at worst level since pandemic began

22 June 2022

Summary: Euro-zone households more pessimistic in June; Consumer Confidence Indicator down 2.4 points; well below long-term average, lower bound of normal readings; euro-zone sovereign bond yields lower.

EU consumer confidence plunged during the GFC and again in 2011/12 during the European debt crisis. After bouncing back through 2013 and 2014, it fell back significantly in late 2018 but only to a level which corresponds to significant optimism among households. Following the plunge which took place in April 2020, a recovery began a month later, with household confidence returning to above-average levels in March 2021. However, recent readings have been low by historical standards.

Consumer confidence deteriorated in June according to the latest survey conducted by the European Commission. Its Consumer Confidence Indicator recorded a reading of -23.6, down from April’s figure of -21.2. This latest reading is well below the long-term average of -11.6 as well as outside the lower end of the range in which “normal” readings usually occur.

Ray Attrill, Head of FX Strategy within NAB’s FICC division, noted the reading was “just beneath the worst levels seen in the early stages of the pandemic.” He attributed the result to “soaring inflation and the knock-on effects from the Ukraine war…”

Sovereign bond yields dropped in major euro-zone bond markets on the day. By the end of it, the German 10-year bund yield had shed 14bps to 1.63% and the French 10-year OAT yield had lost 15bps to 2.17%.

Westpac-MI leading index down in May, consumer confidence “shock” an emerging theme

22 June 2022

Summary:  Westpac-MI Leading index growth rate down in May; shock to consumer confidence an emerging theme; reading implies annual GDP growth of around 3.00% to 3.25%; Westpac expects below-trend growth later in 2022, 2023.

Westpac and the Melbourne Institute describe their Leading Index as a composite measure which attempts to estimate the likely pace of Australian economic growth in the short-term. After reaching a peak in early 2018, the index trended lower through 2018 and 2019 before plunging to recessionary levels in the second quarter of 2020. Subsequent readings were markedly higher but readings through 2021 mostly declined.

The May reading of the six month annualised growth rate of the indicator registered 0.58%, down from April’s revised figure of 1.09%.

“The components of the Index are indicating an important emerging theme around Australia’s growth prospects – a significant shock to consumer confidence,” said Westpac Chief Economist Bill Evans. However, he noted the current reading “is still indicating above-trend growth momentum heading into the three-to-nine month ‘window’.“

Index figures represent rates relative to “trend” GDP growth, which is generally thought to be around 2.75% per annum in Australia. The index is said to lead GDP by “three to nine months into the future” but the highest correlation between the index and actual GDP figures occurs with a three-month lead. The current reading thus represents an annual GDP growth rate of around 3.00% to 3.25% in the September quarter.

Domestic Treasury bond yields moved considerably lower on the day. By the close of business, the 3-year ACGB yield had shed 10bps to 3.75%, the 10-year yield had lost 8bps to 4.06% while the 20-year yield finished 10bps lower at 4.21%.

In the cash futures market, expectations for the path of the actual cash rate over time were pulled back. At the end of the day, contracts implied the cash rate would rise from the current rate of 0.81% to 1.20% in July and then increase to 1.73% by August. November contracts implied a 2.995% cash rate while May 2023 contracts implied 3.97%.

“The slump in Consumer Sentiment, under the weight of rising interest rates and falling house prices, is likely to take its toll on spending later in the year and into 2023,” said Evans. “We expect this to see the growth rate in the economy fall below trend and should be foreshadowed by negative reads for the Leading Index growth rate later this year.”

US leading index falls again in May

17 June 2022

Summary: Conference Board leading index down 0.4% in May, in line with expectations; suggests weaker economic activity in near term; implies 2.7% US GDP growth to August.

The Conference Board Leading Economic Index (LEI) is a composite index composed of ten sub-indices which are thought to be sensitive to changes in the US economy. The Conference Board describes it as an index which attempts to signal growth peaks and troughs; turning points in the index have historically occurred prior to changes in aggregate economic activity. Readings from March and April of 2020 signalled “a deep US recession” while subsequent readings indicated the US economy would recover rapidly.

The latest reading of the LEI indicates it decreased by 0.4% in May. The result was in line with expectations as well as April’s revised figure after it was revised down from -0.3%.

“The index is still near a historic high but the US LEI suggests weaker economic activity is likely in the near term and tighter monetary policy is poised to dampen economic growth even further,” said Ataman Ozyildirim, Senior Director of Economic Research at The Conference Board. He put the result down to lower share prices, less housing construction and less optimistic consumers.

US Treasury bond yields moved considerably higher, especially at the short end. By the close of business, the 2-year Treasury yield had jumped 9bps to 3.19% while 10-year and 30-year yields both finished 3bps higher at 3.23% and 3.28% respectively.

In terms of US Fed policy, expectations of a higher federal funds range over the next 12 months softened slightly. July contracts implied an effective federal funds rate of 1.685%, 10bps higher than the current spot rate.  September contracts implied a rate of 2.47% while June 2023 futures contracts implied an effective federal funds rate of 3.735%, 215bps above the spot rate. Regression analysis suggests the latest reading implies a 2.7% year-on-year growth rate in August, down from July’s revised figure of 3.4%.  

Publishing, logging drives US industrial output lower in May

17 June 2022

Summary: US industrial output up 0.2% in May, below market expectations; up 5.8% over past 12 months; driven by falls in publishing, logging; capacity utilisation rate up 0.1ppt to 79.0%, still short of long-term average.

The Federal Reserve’s industrial production (IP) index measures real output from manufacturing, mining, electricity and gas company facilities located in the United States. These sectors are thought to be sensitive to consumer demand and so some leading indicators of GDP use industrial production figures as a component.

US production collapsed through March and April of 2020 before recovering the ground lost over the fifteen months to July 2021.

According to the Federal Reserve, US industrial production expanded by 0.2% on a seasonally adjusted basis in May. The result was less than the 0.5% increase which had been generally expected and well below April’s 1.4% jump after it was revised up from 1.1%. On an annual basis, the growth rate slowed from April’s revised figure of 6.3% to 5.8%.

“The weakness in manufacturing was driven by falls in publishing and logging,” said ANZ Head of Australian Economics David Plank. “Production of wood products fell 2.6%, which reflected the weakness in housing starts as residential construction weakens.”

Summary: US industrial output up 0.2% in May, below market expectations; up 5.8% over past 12 months; driven by falls in publishing, logging; capacity utilisation rate up 0.1ppt to 79.0%, still short of long-term average.

US Treasury bond yields moved considerably higher, especially at the short end. By the close of business, the 2-year Treasury yield had jumped 9bps to 3.19% while 10-year and 30-year yields both finished 3bps higher at 3.23% and 3.28% respectively.

The same report includes US capacity utilisation figures which are generally accepted as an indicator of future investment expenditure and/or inflationary pressures. Capacity usage had hit a high for the last business cycle in early 2019 before it began a downtrend which ended with April 2020’s multi-decade low of 64.2%. May’s reading increased from April’s revised figure of 78.9% to 79.0%, still short of the long-term average of 80.1%.

While the US utilisation rate’s correlation with the US jobless rate is solid, it is not as high as the comparable correlation in Australia.

Westpac-MI sentiment index drops; comparable with “major economic dislocations”

15 June 2022

Summary: Household sentiment deteriorates for seventh consecutive month in June; readings at/below this level only during major economic dislocations; driven by rising inflation, lifts in interest rates, loss of confidence around economic outlook; four of five sub-indices lower; respondents less concerned by prospects of unemployment.

After a lengthy divergence between measures of consumer sentiment and business confidence in Australia which began in 2014, confidence readings of the two sectors converged again in mid-July 2018. Both measures then deteriorated gradually in trend terms, with consumer confidence leading the way. Household sentiment fell off a cliff in April 2020 but, after a few months of to-ing and fro-ing, it then staged a full recovery. However, consumer sentiment has deteriorated significantly over the past year, while business sentiment has only deteriorated moderately.

According to the latest Westpac-Melbourne Institute survey conducted in the second week of June, household sentiment has deteriorated for a seventh consecutive month. Their Consumer Sentiment Index fell from May’s reading of 90.4 to 86.4, a reading which is below the range of “normal” readings and significantly lower than the long-term average reading of just over 101.

“This read is even weaker than we had expected,” said Westpac Chief Economist Bill Evans. ”Over the 46-year history of the survey, we have only seen Index reads at or below this level during major economic dislocations.”

Any reading of the Consumer Sentiment Index below 100 indicates the number of consumers who are pessimistic is greater than the number of consumers who are optimistic.

Domestic Treasury bond yields rose strongly on the day despite the figures. By the close of business, the 3-year ACGB yield had gained 16bps to 3.59% while 10-year and 20-year yields both finished 12bps higher at 4.08% and 4.27% respectively.

In the cash futures market, expectations of a steeper path for the actual cash rate over time became further entrenched. At the end of the day, contracts implied the cash rate would rise from the current rate of 0.81% to 1.325% in July and then increase to 1.96% by August. November contracts implied a 3.465% cash rate while May 2023 contracts implied 4.425%.

“The survey detail shows a clear picture of a slump in sentiment being driven by rising inflation, an associated lift in interest rates and a loss of confidence around the economic outlook, both here and abroad,” explained Evans.

Four of the five sub-indices registered lower readings, with the “Family finances – next 12 months” sub-index again posting the largest monthly percentage loss. The reading of the “Economic conditions – next 5 years” sub-index was the only one to increase.

The Unemployment Expectations index, formerly a useful guide to RBA rate changes, declined from 109.6 to 108.5. Lower readings result from fewer respondents expecting a higher unemployment rate in the year ahead.

US May retail sales “point to slowing consumer demand”

15 June 2022

Summary:  US retail sales down 0.3% in May, lower than expected; April figure revised down; points to slowing consumer demand; US Treasury bond yields fall, rate rise expectations soften; auto sales slump, various core measures undershoot expectations; falls in six of thirteen retail categories; vehicles & parts” segment again largest single influence.

US retail sales had been trending up since late 2015 but, commencing in late 2018, a series of weak or negative monthly results led to a drop-off in the annual growth rate below 2.0%. Growth rates then increased in trend terms through 2019 and into early 2020 until pandemic restrictions sent it into negative territory. A “v-shaped” recovery then took place which was followed by some short-term spikes as federal stimulus payments hit US households in the first and second quarters of 2021.

According to the latest “advance” numbers released by the US Census Bureau, total retail sales declined by 0.3% in May. The fall contrasted with the 0.2% gain which had been generally expected as well as April’s 0.7% after it was revised down from 0.9%. However, on an annual basis, the growth rate still accelerated from April’s revised figure of 7.8% to 8.1%.

“Retail sales account for about 35% of US private consumption, so the data point to a slowing in consumer demand and the need to get inflation down to support real consumption growth,” said ANZ economist Madeline Dunk.

US Treasury bond yields dropped on the day after the US Fed announced a 75bps rise of its federal funds rate target range. By the close of business, the 2-year Treasury yield had shed 19bps to 3.21%, the 10-year yield had lost 20bps to 3.28% while the 30-year yield finished 10bps lower at 3.33%.

In terms of US Fed policy, expectations of higher federal funds rates over the next 12 months softened noticeably. At the close of business, July contracts implied an effective federal funds rate of 1.685%, 10bps higher than the newly-raised spot rate. September contracts implied 2.445% while July 2023 futures contracts implied an effective federal funds rate of 3.835%, 225bps above the spot rate.

“Auto sales slumped 3.5% but various core measures also undershot expectations,” said Ray Attrill, Head of FX Strategy within NAB’s FICC division. “These nominal sales look even weaker when adjusted for still-strong inflation.”

Six of the thirteen categories recorded lower sales over the month. The “Motor vehicles & parts dealers” segment again provided the largest single influence on the overall result, falling by 3.5% for the month and by 3.7% over the year to May. “Non-store retailer” sales decreased by 1.0% over the month but increased by 7.0% over the year to May.

The non-store segment includes vending machine sales, door-to-door sales and mail-order sales but nowadays this segment has become dominated by online sales. It now accounts for just over 15% of all US retail sales and it is the second-largest segment after vehicles and parts.

April euro-zone production up; still 2% lower over past 12 months

15 June 2022

Summary: Euro-zone industrial production up 0.4% in April, less than expected; annual growth rate worsens, down 2.0%; German, French 10-year yields fall significantly; expands in all but one of euro-zone’s four largest economies.

Following a recession in 2009/2010 and the debt-crisis which flowed from it, euro-zone industrial production recovered and then reached a peak four years later in 2016. Growth rates then fluctuated for two years before beginning a steady and persistent slowdown from the start of 2018. That decline was transformed into a plunge in March and April of 2020 which then took over a year to claw back. Production in more-recent months has generally stagnated.

According to the latest figures released by Eurostat, euro-zone industrial production expanded by 0.4% in April on a seasonally-adjusted and calendar-adjusted basis. The rise was less than the 0.7% expansion which had been generally expected but it contrasted with March’s 1.4% fall after revisions. However, the calendar-adjusted growth rate on an annual basis worsened from March’s revised rate of -0.5% to -2.0%.

German and French sovereign bond yields fell significantly on the day. By the close of business, the German 10-year bund yield had shed 13bps to 1.64% while the French 10-year OAT yield finished 19bps lower at 2.21%.

Industrial production expanded in all but one of the euro-zone’s four largest economies. Germany’s production grew by 1.3% while the growth figures for France, Spain and Italy were -0.1%, 2.1% and 1.6% respectively.

May PPI report does “little to dampen US inflationary concerns”

14 June 2022

Summary: US producer price index (PPI) up 0.8% in May, in line with expectations; annual rate falls from 10.9% to 10.7%; “core” PPI up 0.2%; figures do little to dampen US inflationary concerns; US Treasury yields higher, rate-rise expectations hardened noticeably: higher energy costs behind most of headline rate’s rise.

Around the end of 2018, the annual inflation rate of the US producer price index (PPI) began a downtrend which continued through 2019. Months in which producer prices increased suggested the trend may have been coming to an end, only for it to continue, culminating in a plunge in April 2020. Figures returned to “normal” towards the end of that year but annual rates over the past twelve months have been well above the long-term average.

The latest figures published by the Bureau of Labor Statistics indicate producer prices rose by 0.8% after seasonal adjustments in May. The increase was in line with consensus expectations but double April’s revised figure of 0.4%. On a 12-month basis, the rate of producer price inflation after seasonal adjustments slowed from April’s revised rate of 10.9% to 10.7%.

Producer prices excluding foods and energy, or “core” PPI, rose by 0.5% after seasonal adjustments. The increase was less than the 0.6% rise which had been generally expected but considerably more than April’s 0.2% after it was revised down from 0.4%. The annual rate decreased from April’s revised rate of 8.7% to 8.3%.

NAB currency strategist Rodrigo Catril said the figures “did little to dampen US inflationary concerns…”

US Treasury bond yields rose on the day. By the close of business, the 2-year Treasury yield had added 3bps to 3.40%, the 10-year yield had gained 12bps to 3.48% while the 30-year yield finished 8bps higher at 3.43%.

In terms of US Fed policy, expectations of higher federal funds rates over the next 12 months hardened noticeably. At the close of business, June contracts implied an effective federal funds rate of 1.19%, 36bps higher than the current spot rate. July contracts implied 1.66% while May 2023 futures contracts implied an effective federal funds rate of 4.055%, nearly 325bps above the spot rate.

“Most of the rise in the headline index resulted from higher energy costs. Service prices rose 0.4% following a 0.2% drop in April,” said ANZ Head of Australian Economics David Plank.

The producer price index is a measure of prices received by producers for domestically produced goods, services and construction. It is put together in a fashion similar to the consumer price index (CPI) except it measures prices received from the producer’s perspective rather than from the perspective of a retailer or a consumer. It is another one of the various measures of inflation tracked by the US Fed, along with core personal consumption expenditure (PCE) price data.

Businesses in strong position despite headwinds: NAB May survey

14 June 2022

Summary: Business conditions deteriorate in May, remain at elevated level; confidence also deteriorates, back to long-term average; most businesses in strong position despite inflation headwinds, yet to feel effects of higher rates, global growth risks; businesses now facing series of future hikes, likely to have muted confidence; activity conditions are robust, consumers have money on hand to spend more freely; capacity utilisation rate up, all 8 sectors of economy above respective long-run averages.

NAB’s business survey indicated Australian business conditions were robust in the first half of 2018, with a cyclical-peak reached in April of that year. Readings from NAB’s index then began to slip and forecasts of a slowdown in the domestic economy began to emerge in the first half of 2019 as the index trended lower. It hit a nadir in April 2020 as pandemic restrictions were introduced but then conditions improved markedly over the next twelve months. Readings have been generally in a historically-normal range since then.

According to NAB’s latest monthly business survey of over 550 firms conducted over the last week of May, business conditions have deteriorated somewhat but remain at an elevated level. NAB’s conditions index registered 16, down from April’s revised reading of 19.

Business confidence also deteriorated. NAB’s confidence index fell from April’s reading of 10 to 6, thus reverting back to the long-term average. Typically, NAB’s confidence index leads the conditions index by approximately one month, although some divergences have appeared in the past from time to time.

“Overall, the survey indicates the economy has maintained its momentum in Q2 and most businesses are in a strong position despite the inflation headwinds, with the lift-off in official interest rates and global growth risks yet to significantly impact Australia’s economic trajectory,” said NAB senior economist Brody Viney.

Commonwealth Government bond yields rocketed up on the day. By the close of business, the 3-year ACGB yield had gained 21bps to 3.48% while 10-year and 20-year yields both finished 18bps higher at 3.96% and 4.15% respectively.

In the cash futures market, expectations of a steeper path for the actual cash rate over time hardened. At the end of the day, contracts implied the cash rate would rise from the current rate of 0.81% to 1.275% in July and then increase to 1.86% by August. November contracts implied a 3.30% cash rate while May 2023 contracts implied 4.18%.

“The results were a bit of a mixed bag and there were a number of influences at play,” said ANZ economist Madeline Dunk. “The survey period was just after the federal election and also captured sentiment following the RBA’s first rate hike in 11 years in early May. Businesses are now facing a series of future hikes and this is likely to have muted confidence.”

Westpac senior economist Andrew Hanlan noted conditions facing the business sector are still good. “The key theme remains that activity conditions are robust currently, with a reopening bounce from the delta lockdowns and the omicron wave disruptions. Fewer COVID related restrictions give consumers more opportunities to spend and, in general, they have the money on hand to spend more freely.”

NAB’s measure of national capacity utilisation continued to recover from December’s drop and it rose from April’s revised figure of 84.2% to 85.0%. All eight sectors of the economy were reported to be operating above their respective long-run averages.

Capacity utilisation is generally accepted as an indicator of future investment expenditure and it also has a strong inverse relationship with the unemployment rate.

Click for more news