News

UoM confidence index hits series low in June

10 June 2022

Summary: University of Michigan consumer confidence index down noticeably in June, below consensus expectations; views of present conditions, future conditions both deteriorate significantly; comparable to trough in 1980 recession.

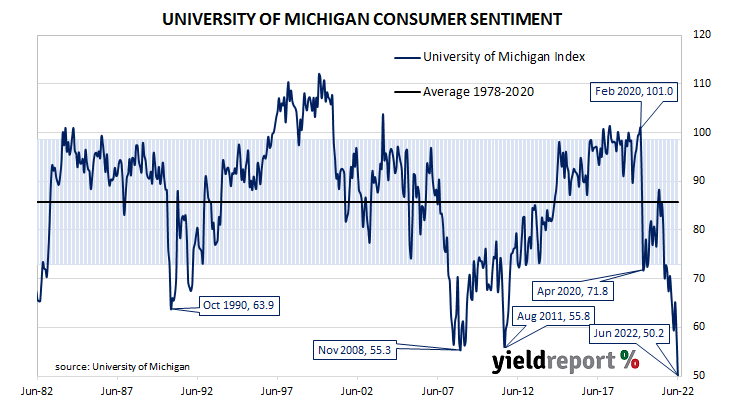
US consumer confidence started 2020 at an elevated level but, after a few months, surveys began to reflect a growing unease with the global spread of COVID-19 and its reach into the US. Household confidence plunged in April 2020 and then recovered in a haphazard fashion, generally fluctuating at below-average levels according to the University of Michigan. The University’s measure of confidence had recovered back to the long-term average by April 2021 but then it plunged again in the September quarter. It has since fallen to historically low levels.

The latest survey conducted by the University indicates confidence among US households deteriorated noticeably on average in June. The preliminary reading of the Index of Consumer Sentiment registered 50.2, well below the generally expected figure of 58.9 as well as May’s final figure of 58.4. Consumers’ views of current conditions and expectations regarding future conditions both deteriorated significantly in comparison to those held at the time of the May survey.

“Consumer sentiment declined by 14% from May, continuing a downward trend over the last year and reaching its lowest recorded value, comparable to the trough reached in the middle of the 1980 recession,” said the University’s Surveys of Consumers chief economist, Richard Curtin. He noted gasoline prices “weighed heavily on consumers” with half of all respondents spontaneously mentioning higher prices during their interviews.

US Treasury bond yields rose materially on the day, although not at the ultra-long end. By the close of business, the 2-year Treasury yield had jumped 25bps to 3.07% and the 10-year yield had gained 11bps to 3.16%. The 30-year yield finished just 2bps higher at 3.19%.

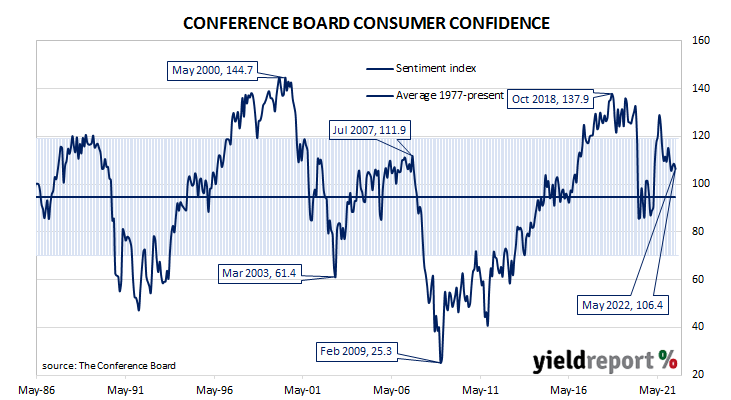
Less-confident households are generally inclined to spend less and save more; some decline in household spending could be expected to follow. As private consumption expenditures account for a majority of GDP in advanced economies, a lower rate of household spending growth would flow through to lower GDP growth if other GDP components did not compensate. However, the University’s survey is one of two widely-followed surveys, the other being produced by The Conference Board, and their indices have diverged markedly over the past two years.

May CPI “undermines” Fed expectations; US bond yields up materially

10 June 2022

Summary: US CPI up 1.0% in May, higher than expectations; “core” rate up 0.6%; “undermines” Fed expectations inflation would moderate in Q2; Treasury yields up materially, rate rise expectations firm considerably; alternative core measures suggest breadth of inflation pressures picks up; non-energy services again main driver of headline rise.

The annual rate of US inflation as measured by changes in the consumer price index (CPI) halved from nearly 3% in the period from July 2018 to February 2019. It then fluctuated in a range from 1.5% to 2.0% through 2019 before rising above 2.0% in the final months of that year. Substantially lower rates were reported from March 2020 to May 2020 and they remained below 2% until March 2021. Rates has risen significantly since then.

The latest CPI figures released by the Bureau of Labor Statistics indicated seasonally-adjusted consumer prices rose by 1.0% on average in May. The increase was higher than the generally expected figure of 0.7% and significantly more than April’s 0.3%. On a 12-month basis, the inflation rate accelerated from April’s reading of 8.2% to 8.5%.

“Headline” inflation is known to be volatile and so references are often made to “core” inflation for analytical purposes. Core inflation, a measure of inflation which strips out the more variable food and energy components of the index, increased by 0.6% on a seasonally-adjusted basis for the month. The rise was larger than the 0.5% expected as well as April’s 0.3% increase. Even so, the annual growth rate slowed from 6.1% to 6.0%.

“The May CPI release undermined Fed expectations that inflation would moderate in Q2 and we fully expect the Fed to make upward revisions to its inflation and fed funds rate projections,” said ANZ senior economist Felicity Emmett.

US Treasury bond yields rose materially on the day, although not at the ultra-long end. By the close of business, the 2-year Treasury yield had jumped 25bps to 3.07% and the 10-year yield had gained 11bps to 3.16%. The 30-year yield finished just 2bps higher at 3.19%.

In terms of US Fed policy, expectations of higher federal funds rates over the next 12 months firmed considerably. At the close of business, June contracts implied an effective federal funds rate of 1.10%, 27bps higher than the current spot rate. July contracts implied 1.46% while May 2023 futures contracts implied an effective federal funds rate of 3.75%, 292bps above the spot rate.

“Alternative core measures suggest the breadth of inflation pressures has actually picked up with the Cleveland Fed Trimmed Mean at 0.8%, its highest in the history of the series which dates back to 1983. Ditto for the year-on-year version at 6.5%,” said NAB senior economist Tapas Strickland.

Strickland noted Federal Reserve officials had recently stated monthly inflation data would influence their thinking regarding the size of increases at September’s FOMC meeting. In his opinion, these latest figures were high enough so the FOMC’s “…foot will still have to be on the pedal”

The largest influence on headline results is often the change in fuel prices. “Energy commodities”, the segment which contains vehicle fuels, increased by 4.5%, adding 0.22 percentage points. However, prices of non-energy services, the segment which includes actual and implied rents, again had the largest single effect, adding 0.34 percentage points after they increased by 0.6% on average.

Inflation Gauge jumps in May, “consistent with broader-based price pressures”

06 June 2022

Summary: Melbourne Institute Inflation Gauge index up 1.1% in May; up 4.4% on annual basis; consistent with acceleration of broader-based price pressures.

The Melbourne Institute’s Inflation Gauge is an attempt to replicate the ABS consumer price index (CPI) on a monthly basis. It has turned out to be a reliable leading indicator of the CPI, although there are periods in which the Inflation Gauge and the CPI have diverged for as long as twelve months. On average, the Inflation Gauge’s annual rate tends to overestimate the ABS rate by around 0.1%.

The Melbourne Institute’s latest reading of its Inflation Gauge index indicates consumer inflation jumped by 1.1% in May. The rise follows a 0.1% decline in April and an increase of 0.8% in March. On an annual basis, the index rose by 4.4%, up from 3.4% in April.

NAB economist Taylor Nugent said the “trimmed mean” measure’s 0.7% increase “is consistent with an acceleration in broader-based price pressures in Q2 and sits alongside other indicators of price pressure…”

The figures were released at roughly the same time as ANZ’s latest Job Ads report but the effect of either on Commonwealth Government bond yields was almost negligible. By the close of business, the 3-year ACGB yield had inched up 1bp to 3.05%, the 10-year yield had returned to its starting point at 3.50% while the 20-year yield finished 1bp lower at 3.79%.

In the cash futures market, expectations of a steeper path for the actual cash rate over time firmed slightly. At the end of the day, contracts implied the cash rate would rise from the current rate of 0.31% to 0.56% in June, rise to 0.92% in July and then increase to 1.335% by August. November contracts implied a 2.43% cash rate while May 2023 contracts implied 3.505%.

Central bankers desire a certain level of inflation which is “sufficiently low that it does not materially distort economic decisions in the community” but high enough so it does not constrain “a central bank’s ability to combat recessions.”

May job ads close to March peak but pool of workers still not utilised

06 June 2022

Summary:  Job ads up 0.4% in May; 17.3% higher than same month in 2021; close to March peak, “significant unmet demand for labour”; “substantial pool” of unutilised labour supply; ads-to-workforce ratio steady at 1.7%, consistent with low jobless rate.

From mid-2017 onwards, year-on-year growth rates in the total number of Australian job advertisements consistently exceeded 10%. That was until mid-2018 when the annual growth rate fell back markedly. 2019 was notable for its reduced employment advertising and this trend continued into the first quarter of 2020. Advertising plunged in April and May of 2020 as pandemic restrictions took effect but then recovered quite quickly.

According to the latest ANZ figures, total advertisements increased by 0.4% in May on a seasonally-adjusted basis. The rise followed a 2.0% decline in April and a 0.8% increase in March after revisions. On a 12-month basis, total job advertisements were 17.3% higher than in May 2021, down from April’s revised figure of 23.6%.

“It [total advertisements] remains close to the March peak, indicating significant unmet demand for labour,” said ANZ senior economist Catherine Birch. However, she pointed to “a substantial pool of domestic labour supply that employers are still not utilising” and noted the job market “is not as tight as in some other economies” such as the US.

The figures were released at roughly the same time as the Melbourne Institute’s latest Inflation Gauge reading but the effect of either on Commonwealth Government bond yields was almost negligible. By the close of business, the 3-year ACGB yield had inched up 1bp to 3.05%, the 10-year yield had returned to its starting point at 3.50% while the 20-year yield finished 1bp lower at 3.79%.

In the cash futures market, expectations of a steeper path for the actual cash rate over time firmed slightly. At the end of the day, contracts implied the cash rate would rise from the current rate of 0.31% to 0.56% in June, rise to 0.92% in July and then increase to 1.335% by August. November contracts implied a 2.43% cash rate while May 2023 contracts implied 3.505%.

The inverse relationship between job advertisements and the unemployment rate has been quite strong (see below chart), although ANZ themselves called the relationship between the two series into question in early 2019.  A rising number of job advertisements as a proportion of the labour force is suggestive of lower unemployment rates in the near-future while a falling ratio suggests higher unemployment rates will follow.

In 2008/2009, advertisements plummeted and Australia’s unemployment rate jumped from 4% to nearly 6% over a period of 15 months. When a more dramatic fall in advertisements took place in April 2020, the unemployment rate responded much more quickly.

May non-farm payroll report affirms “near-term path for continued Fed tightening”

03 June 2022

Summary: Non-farm payrolls up by 390,000 in May, above expectations; previous two months’ figures revised down by 22,000; jobless rate steady at 3.6%, participation rate ticks up; affirms “near-term path for continued Fed tightening”; jobs-to-population ratio creeps up; underutilisation rate ticks up to 7.1%; annual hourly pay growth slows to 5.2%.

The US economy ceased producing jobs in net terms as infection controls began to be implemented in March 2020. The unemployment rate had been around 3.5% but that changed as job losses began to surge through March and April of 2020. The May 2020 non-farm employment report represented a turning point and subsequent months provided substantial employment gains. Changes in recent months have been generally more modest but also well above the long-term monthly average.

According to the US Bureau of Labor Statistics, the US economy created an additional 390,000 jobs in the non-farm sector in May. The increase was greater than the 320,000 increase which had been generally expected but a little lower than the 436,000 jobs which had been added in April after revisions. Employment figures for March and April were revised down by a total of 22,000.

The total number of unemployed increased by 9,000 to 5.950 million while the total number of people who are either employed or looking for work decreased by 0.330 million to 164.376 million. These changes led to the US unemployment rate remaining stable at April’s rate of 3.6%. The participation rate ticked up from April’s rate of 62.2% to 62.3%.

“Markets took the strong US payroll gains…as affirming the near-term path for continued Fed tightening,” said NAB economist Taylor Nugent.

US Treasury yields increased on the day, especially at the short end. By the close of business, the 2-year yield had gained 5bps to 2.68%, the 10-year yield had added 3bps to 2.94% while the 30-year yield finished 1bp higher at 3.09%.

In terms of US Fed policy, expectations for a higher federal funds rate over the next 12 months softened somewhat. At the close of business, June contracts implied an effective federal funds rate of 1.085%, 28bps higher than the current spot rate, while July contracts implied 1.405%. May 2023 futures contracts implied an effective federal funds rate of 3.205%, 238bps above the spot rate.

One figure which is indicative of the “spare capacity” of the US employment market is the employment-to-population ratio. This ratio is simply the number of people in work divided by the total US population. It hit a cyclical-low of 58.2 in October 2010 before slowly recovering to just above 61% in late-2019. May’s reading crept up from 60.0% to 60.1%, still some way from the April 2000 peak reading of 64.7%.

Wage growth spiked in the US during the early stages of pandemic restrictions as lower-paid jobs disappeared at a faster rate relative to higher-paid jobs, disrupting the usual relationship between wage inflation and unemployment rates. Normally, wages tend to grow as the supply of labour tightens.

Apart from the unemployment rate, another measure of tightness in the labour market is the underutilisation rate. The latest reading of it ticked up from 7.0% in April to 7.1%. Wage inflation and the underutilisation rate usually have an inverse relationship and hourly pay growth in the year to May slowed from April’s rate of 5.5% to 5.2%.

Small business “struggling to keep workers”; ADP jobs growth slows in May

02 June 2022

Summary: ADP payrolls up 128,000 in May, less than consensus expectations; April rise revised down by 45,000; small business “struggling to keep workers”; positions up in medium, large businesses, down in small ones again; little over 80% of gains in services sector, led by education/health sector.

The ADP National Employment Report is a monthly report which provides an estimate of US non-farm employment in the private sector. Since publishing of the report began in 2006, its employment figures have exhibited a high correlation with official non-farm payroll figures, although a large difference can arise in any individual month.

The latest ADP report indicated private sector employment increased by 128,000 in May, less than the 295,000 increase which had been generally expected. April’s rise was revised down by 45,000 to 202,000.

“Under a backdrop of a tight labour market and elevated inflation, monthly job gains are getting closer to pre-pandemic trends, while it appears small businesses are struggling to keep workers given the competition for workers,” said NAB senior economist Tapas Strickland.

ADP payrolls up 128,000 in May, less than consensus expectations; April rise revised down by 45,000; small business “struggling to keep workers”; positions up in medium, large businesses, down in small ones again; little over 80% of gains in services sector, led by education/health sector.

US Treasury yields declined at the short end on the day while longer-term yields were either steady or a little higher. At the close of business, the 2-year Treasury bond yield had shed 2bps to 2.63%, the 10-year yield had returned to its starting point at 2.91% while the 30-year yield finished 2bps higher at 3.08%.

In terms of US Fed policy, expectations for higher federal funds rates over the next 12 months were essentially unchanged. At the close of business, June contracts implied an effective federal funds rate of 1.085%, 26bps higher than the current spot rate while July contracts implied a rate of 1.405%. May 2023 futures contracts implied 3.16%, 233bps above the spot rate.

Employment numbers in net terms increased at medium-sized and large businesses while contracting in small enterprises for a second consecutive month. Firms with less than 50 employees lost a net 91,000 positions, mid-sized firms (50-499 employees) added 97,000 positions while large businesses (500 or more employees) accounted for 122,000 more employees.

Employment at service providers accounted for a little over 80% of the total net increase, or 104,000 positions. The “Education & Health” sector was the largest single source of gains, with 46,000 more positions. Total jobs among goods producers increased by a net 24,000 positions.

Prior to the ADP report, the consensus estimate of the change in May’s official non-farm employment figure was +329,000. The non-farm payroll report will be released by the Bureau of Labor Statistics this coming Friday night (AEST), 3 June.

“No cooling yet” from US April JOLTS report

01 June 2022

Summary: US quit rate unchanged in April; quits, openings, separations all down; almost two job openings for every unemployed person, “no cooling yet”.

The number of US employees who quit their jobs as a percentage of total employment increased slowly but steadily after the GFC. It peaked in March 2019 and then tracked sideways until virus containment measures were introduced in March 2020. The quit rate then plummeted as alternative employment opportunities rapidly dried up. Following the easing of US pandemic restrictions, it proceeded to recover back to its pre-pandemic rate in the third quarter of 2020 before trending higher through 2021.

Figures released as part of the most recent Job Openings and Labor Turnover Survey (JOLTS) report show the quit rate remained unchanged in April. 2.9% of the non-farm workforce left their jobs voluntarily, unchanged from March’s figure of 2.9% after it was revised down from 3.0%. Even though there were 25,000 fewer quits during the month and an additional 428,000 people employed, the quit rate remained unchanged after rounding.

US Treasury yields increased on the day, although not at the ultra-long end. By the close of business, the 2-year Treasury bond yield had jumped 9bps to 2.65% and the 10-year yield had gained 6bps to 2.91%. The 30-year yield finished unchanged at 3.06%.

In terms of US Fed policy, expectations of higher federal funds rates over the next 12 months firmed up. At the close of business, June contracts implied an effective federal funds rate of 1.08%, 25bps higher than the current spot rate while July contracts implied a rate of 1.405%. May 2023 futures contracts implied 3.165%, 234bps above the spot rate.

The fall in total quits was led by 57,000 fewer resignations in the “Accommodation and food services” sector while the “Professional and business services” sector experienced the single largest rise, increasing by 46,000. Overall, the total number of quits for the month fell from March’s revised figure of 4.449 million to 4.424 million.      

Total vacancies at the end of April decreased by 455,000, or 3.8%, from March’s revised figure of 11.855 million to 11.400 million. The fall was driven by a 266,000 drop in the “Health care and social assistance” sector, a 162,000 decrease in the “Retail trade” sector and a 149,000 decline in the Professional and business services” sector. The “Transportation, warehousing, and utilities” sector experienced the single largest increase, rising by 97,000. Overall, 11 out of 18 sectors experienced fewer job openings than in the previous month.

“There are almost two job openings for every unemployed person in the US,” said NAB currency strategist Rodrigo Catril. “Fed Chair Powell specifically referenced the job openings to unemployed ratio as one indicator he is watching for some early evidence of a potentially cooling in the labour market, and clearly there is no cooling yet.”

Total separations decreased by 215,000, or 3.4%, from March’s revised figure of 6.248 million to 6.033 million. The fall was led by the “Professional and business services” sector where there were 82,000 fewer separations than in March. Separations decreased in 12 out of 18 sectors.

The “quit” rate time series produced by the JOLTS report is a leading indicator of US hourly pay. As wages account for around 55% of a product’s or service’s price in the US, wage inflation and overall inflation rates tend to be closely related. Former Federal Reserve chief and current Treasury Secretary Janet Yellen was known to pay close attention to it.

May ISM PMI beats expectations; progress made on labour shortages

31 May 2022

Summary: ISM PMI up from 57.1% to 56.1% in May, above expectations; labour shortages, input price inflation easing; prices-paid sub-index “consistent with extremely strong inflationary pressures” but lower employment sub-index indicates job shedding in manufacturing; latest reading implies 3.9% 12-month growth rate in October.

The Institute of Supply Management (ISM) manufacturing Purchasing Managers Index (PMI) reached a cyclical peak in September 2017. It then started a downtrend which ended in March 2020 with a contraction in US manufacturing which lasted until June 2020. Subsequent month’s readings implied growth had resumed, with the index becoming stronger through to March 2021. Since then, readings have remained at levels associated with solid economic growth despite some declines.

According to the ISM’s May survey, its PMI recorded a reading of 56.1%, above the generally expected figure of 55.0% as well as Aprils 55.4%. The average reading since 1948 is 53.0% and any reading above 50% implies an expansion in the US manufacturing sector relative to the previous month.

Timothy Fiore, Chair of the ISM’s Manufacturing Business Survey Committee, said progress was being made on labour shortages and input price inflation had eased somewhat. Survey respondents mostly reported still being optimistic with respect to customer demand.

US Treasury yields increased on the day, although not at the ultra-long end. By the close of business, the 2-year Treasury bond yield had jumped 9bps to 2.65% and the 10-year yield had gained 6bps to 2.91%. The 30-year yield finished unchanged at 3.06%.

In terms of US Fed policy, expectations of higher federal funds rates over the next 12 months firmed up. At the close of business, June contracts implied an effective federal funds rate of 1.08%, 25bps higher than the current spot rate while July contracts implied a rate of 1.405%. May 2023 futures contracts implied 3.165%, 234bps above the spot rate.

NAB currency strategist Rodrigo Catril said the prices-paid sub-index was “still consistent with extremely strong inflationary pressures” but noted the fall in the employment sub-index indicated “at face value, negative employment growth in the manufacturing sector.”

Purchasing managers’ indices (PMIs) are economic indicators derived from monthly surveys of executives in private-sector companies. They are diffusion indices, which means a reading of 50% represents no change from the previous period, while a reading under 50% implies respondents reported a deterioration on average.

A reading “above 48.7%, over a period of time, generally indicates an expansion of the overall economy” according to the ISM.

The ISM’s manufacturing PMI figures appear to lead US GDP by several months despite a considerable error in any given month. The chart below shows US GDP on a “year on year” basis (and not the BEA annualised basis) against US GDP implied by monthly PMI figures. 

According to the ISM and its analysis of past relationships between the PMI and US GDP, May’s PMI corresponds to an annualised growth rate of 2.6%, or 0.6% over a quarter. Regression analysis on a year-on-year basis suggests a 12-month GDP growth rate of 3.9% five months after this latest report.

The ISM index is one of two monthly US PMIs, the other being an index published by IHS Markit. IHS Markit also produces a “flash” estimate in the last week of each month which comes out about a week before the ISM index is published. The IHS Markit May flash manufacturing PMI registered 57.5%, 1.7 percentage points lower than April’s final figure.

April dwelling approvals down, “underlying conditions weakening”

31 May 2022

Summary: Home approval numbers down 2.4% in April, below expectations; underlying conditions weakening; “big surge” in average value of approvals; house approvals up 0.4% by number, apartments down 7.9%; “pricing instability” in construction sector, rate increases behind slowing demand for developments; non-residential approvals down 0.9% in dollar terms, residential alterations down 1.3%.

Building approvals for dwellings, that is apartments and houses, had been heading south since mid-2018. As an indicator of investor confidence, falling approvals had presented a worrying signal, not just for the building sector but for the overall economy. However, approval figures from late-2019 and the early months of 2020 painted a picture of a recovery taking place, even as late as April of that year. Subsequent months’ figures then trended sharply upwards before falling back in 2021.

The Australian Bureau of Statistics has released the latest figures from April and total residential approvals declined by 2.4% on a seasonally-adjusted basis. The fall over the month contrasted with the 2.0% increase which had been generally expected but it was not as great as the 19.2% fall in March. Total approvals fell by 32.4% on an annual basis, slightly higher than the previous month’s revised figure of -35.2%. Monthly growth rates are often volatile.

“Dwelling approvals continued to move lower in April, coming in a touch under expectations but consistent with our prior that underlying conditions are weakening,” said Westpac senior economist Matthew Hassan.

Commonwealth Government bond yields rose significantly on the day. By the close of business, the 3-year ACGB yield had gained 8bps to 2.93% while 10-year and 20-year yields both finished 10bps higher at 3.37% and 3.69% respectively.

In the cash futures market, expectations of a steeper path for the actual cash rate over time firmed. At the end of the day, contract prices implied the cash rate, currently at 0.31%, would rise to 0.59% in June and then rise to 1.36% by August. May 2023 contracts implied a cash rate of 3.345%, 302bps above the current cash rate.

Hassan noted with concern “a big surge” in the average value of approvals. “Overall, the apparent cost-driven surge in approval values is troubling. With a large backlog of unprofitable work, steep cost and price increases, interest rate hikes and a housing markets entering a correction phase, the situation has the makings of a ‘perfect storm’ for Australia’s dwelling construction sector.

Approvals for new houses rose by 0.4% over the month after falling by 4.1% in March. On a 12-month basis, house approvals were 33.7% lower than they were in April 2021, down from March’s comparable figure of -32.1%.                                                                       

Apartment approval figures are usually a lot more volatile and January’s total fell by 7.9% after a 38.3% drop in March. However, the 12-month growth figure improved from March’s revised rate of -40.5% to -29.5%.

“Pricing instability in the construction sector as well as expected increases in the cash rate may be behind the slowing in demand for unit developments,” said ANZ senior economist Adelaide Timbrell. “We expect further falls as rising interest rates hit finance availability for developers.”

Non-residential approvals declined by 0.9% in dollar terms over the month but increased by 49.6% on an annual basis. Figures in this segment also tend to be rather volatile.

Residential alteration approvals declined by 1.3% in dollar terms over the month and were 18.1% higher than in April 2021.

Conference Board Confidence Index down in May; holding up better than UoM gauge

31 May 2022

Summary: Conference Board Consumer Confidence Index deteriorates in May, higher than consensus expectations; views of present conditions, short-term outlook deteriorate; Present Situation Index at strong level, suggests growth in Q2; Conference Board measure holding up better than UoM gauge.

After the GFC in 2008/09, US consumer confidence clawed its way back to neutral over a number of years and then went from strength to strength until late 2018. Measures of consumer confidence then oscillated within a fairly narrow band at historically high levels until they plunged in early 2020. Subsequent readings then fluctuated around the long-term average until March 2021 when they reached elevated levels. However, a noticeable gap has opened up recently between the two most-widely followed surveys.

The latest Conference Board survey held during the first three weeks of May indicated US consumer confidence has deteriorated slightly. May’s Consumer Confidence Index registered 106.4 on a preliminary basis, higher than the median consensus figure of 103.9 but lower than April’s final figure of 108.6.

Consumers’ views of present conditions and the outlook for the near-future both deteriorated. The Present Situation Index declined from April’s revised figure of 152.9 to 149.6 while the Expectations Index declined from a revised figure of 79.0 to 77.5.

“Overall, the Present Situation Index remains at strong levels, suggesting growth did not contract further in Q2,” said Lynn Franco, a senior director at The Conference Board. “That said, with the Expectations Index weakening further, consumers also do not foresee the economy picking up steam in the months ahead.”

Longer-term US Treasury yields moved moderately higher on the day. By the close of business, the 10-year Treasury bond yield had gained 4bps to 2.85% and the 30-year yield had added 5bps to 3.06%. The 2-year yield finished 1bp lower at 2.56%. In terms of US Fed policy, expectations for a higher federal funds rate over the next 12 months hardened. At the close of business, June contracts implied an effective federal funds rate of 1.08%, 23bps higher than the current spot rate while July contracts implied a rate of 1.40%. May 2023 futures contracts implied 3.015%, 219bps above the spot rate.

“Despite further weakening, the Conference Board measure continues to hold up better than the University of Michigan gauge, which puts more weight on personal financial situation and less on business and labour market conditions,” said NAB economist Taylor Nugent.

The Consumer Confidence Survey is one of two monthly US consumer sentiment surveys which result in the construction of an index. The Conference Board’s index is based on perceptions of current business and employment conditions, as well as respondents’ expectations of conditions six months in the future. The other survey, conducted by the University of Michigan, is similar and it is used to produce an Index of Consumer Sentiment. That survey differs in that it also includes some longer-term questions.

Click for more news