News

Business credit jumps; total lending exceeds expectations in April

31 May 2022

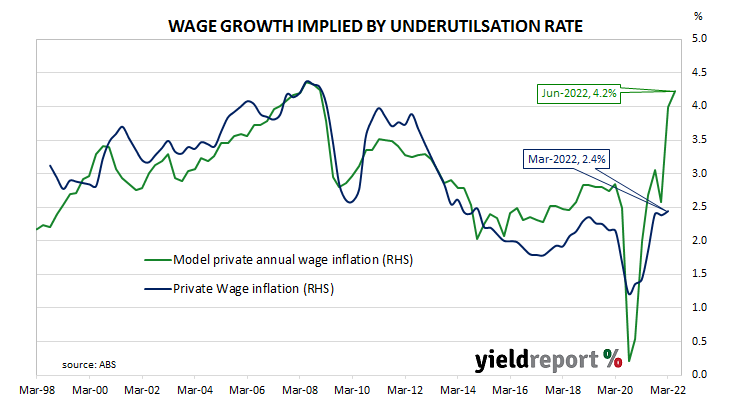
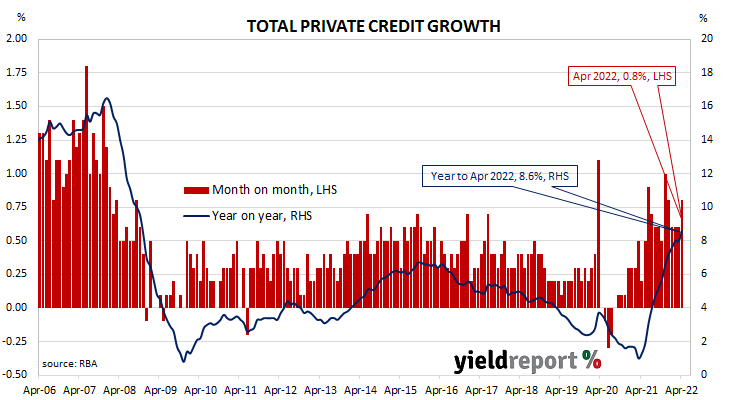
Summary: Private sector credit up 0.8% in April, above expectations; annual growth rate up from 8.0% to 8.6%; business loans account for about 50% of net growth.

The pace of lending to the non-bank private sector by financial institutions in Australia followed a steady-but-gradual downtrend from late-2015 through to early 2020 before hitting what appears to be a nadir in March 2021. That downtrend ended later in the same year and now annual growth rates are above the peak rate seen in the previous decade.

According to the latest RBA figures, private sector credit increased by 0.8% in April. The result was substantially greater than the 0.5% increase which had been generally expected and higher than March’s 0.6% increase after it was revised up from 0.4%. On an annual basis, the growth rate accelerated from March’s revised figure of 8.0% to 8.6%.

“The surprise again was business credit, which tends to be volatile month-to-month,” said NAB senior economist Tapas Strickland.

Commonwealth Government bond yields rose significantly on the day. By the close of business, the 3-year ACGB yield had gained 8bps to 2.93% while 10-year and 20-year yields both finished 10bps higher at 3.37% and 3.69% respectively.

In the cash futures market, expectations of a steeper path for the actual cash rate over time firmed. At the end of the day, contract prices implied the cash rate, currently at 0.31%, would rise to 0.59% in June and then rise to 1.36% by August. May 2023 contracts implied a cash rate of 3.345%, 302bps above the current cash rate.

Business loans accounted for a little over 50% of the net growth over the month, while owner-occupier loans and investor loans accounted for most of the balance. Total personal debt increased a touch.

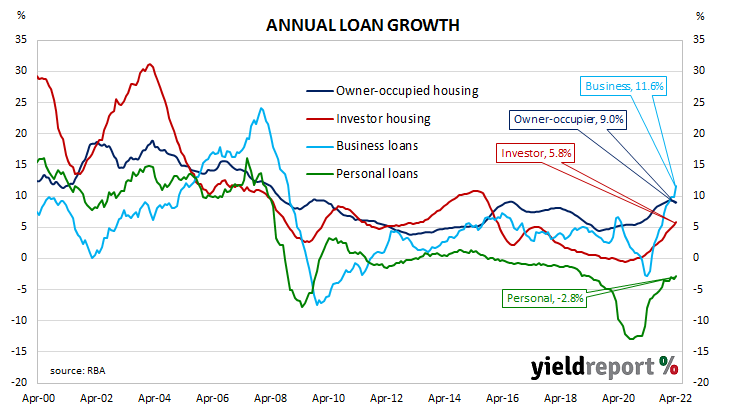
The traditional driver of loan growth rates, the owner-occupier segment, grew by 0.6% over the month, in line with March’s increase. The sector’s 12-month growth rate slowed from 9.2% to 9.0%.

Total lending in the business sector jumped by 1.4%, up from the 0.6% increase recorded in March. Growth on an annual basis accelerated from 9.9% to 11.6%.

Monthly growth in the investor-lending segment slowed to a halt in early 2018. Shortly into the 2019/20 financial year, monthly growth rates slipped into the red before posting a series of flat or near-flat results until mid-2020.

In April, net lending grew by 0.6%, in line with March’s increase. The 12-month growth rate accelerated from 5.3% to 5.8%.                                    

Total personal loans expanded by 0.3%, up from March’s 0.1% contraction, taking the annual contraction rate from 3.3% to 2.8%. This category of debt includes fixed-term loans for large personal expenditures, credit cards and other revolving credit facilities.

Euro composite sentiment index holds

31 May 2022

Summary: Euro-zone composite sentiment index up from 104.9 to 105.0 in May; touch above expectations; readings down in two of five sectors, other three unchanged; up in all four largest euro-zone economies; sovereign bond yields substantially higher; index implies GDP growth of 2.6%.

The European Commission’s Economic Sentiment Indicator (ESI) is a composite index comprising five differently-weighted sectoral confidence indicators.  It is heavily weighted towards confidence surveys from the business sector, with the consumer confidence sub-index only accounting for 20% of the ESI. However, it has a good relationship with euro-zone GDP, although not as a leading indicator.

The ESI posted a reading of 105.0 in May, a touch above the consensus expectation of 104.9 and April’s revised reading of 104.9. The average reading since 1985 is approximately 100.

German and French 10-year bond yields finished the day substantially higher after German inflation figures came in stronger than expected. By the close of business, German and French 10-year yields had both gained 7bps to 1.05% and 1.56% respectively.

Confidence deteriorated in two of the five sectors while the other three remained broadly unchanged. On a geographical basis, the ESI rose in all of the euro-zone’s four largest economies.

End-of-quarter ESI readings and annual euro-zone GDP growth rates are highly correlated. This latest reading corresponds to a year-to-May GDP growth rate of 2.6%, unchanged from April’s implied growth rate.

Annual rate of core PCE inflation slows again in April

27 May 2022

Summary: US core PCE price index up 0.3% in April; in line with expectations; annual rate slows from 5.2% to 4.9%; due to downward move in durable goods prices; Treasury yields down modestly; 210bps of Fed rate rises priced in over next 12 months.

One of the US Fed’s favoured measures of inflation is the change in the core personal consumption expenditures (PCE) price index. After hitting the Fed’s target at the time of 2.0% in mid-2018, the annual rate then hovered in a range between 1.8% and 2.0% before it eased back to a range between 1.5% and 1.8% through 2019. It then plummeted below 1.0% in April 2020 before rising back to around 1.5% in the September quarter of that year. It has since ran up well above the Fed’s target.

The latest figures have now been published by the Bureau of Economic Analysis as part of the April personal income and expenditures report. Core PCE prices rose by 0.3% over the month, in line with expectations as well as March’s increase. On a 12-month basis, the core PCE inflation rate slowed from March’s figure of 5.2% to 4.9%.

“The drop in core PCE was due to a downward move in durable goods prices, which eased to 8.4% versus 10.2%,” said ANZ Head of Australian Economics David Plank. He pointed to a “normalisation” in vehicle production which is “taking the heat out of second-hand car prices.”

US Treasury bond yields fell modestly on the day. By the close of business, the 2-year Treasury bond yield had lost 2bps to 2.46% while 10-year and 30-year yields both finished 1bp lower at 2.74% and 2.97% respectively.

In terms of US Fed policy, expectations of a higher federal funds rate over the next 12 months softened slightly. At the close of business, June contracts implied an effective federal funds rate of 1.085%, 25bps higher than the current spot rate. July contracts implied a rate of 1.40% while May 2023 futures contracts implied 2.93%, 210bps above the spot rate.

The core version of PCE strips out energy and food components, which are volatile from month to month, in an attempt to identify the prevailing trend. It is not the only measure of inflation used by the Fed; the Fed also tracks the Consumer Price Index (CPI) and the Producer Price Index (PPI) from the Department of Labor. However, it is the one measure which is most often referred to in FOMC minutes.

“No observable signs of recession” from May ifo survey

23 May 2022

Summary: ifo business climate index up in May; above expected figure; current conditions index up, expectations index essentially steady; “no observable signs of recession”; expectations index implies euro-zone GDP contraction of 4.0% in year to August 2022.

Following a recession in 2009/2010, the ifo Institute’s Business Climate Index largely ignored the European debt-crisis of 2010-2012, mostly posting average-to-elevated readings through to early-2020. However, the index was quick to react in the March 2020 survey, falling precipitously. The rebound which began in May of that year was almost as sharp but it was also characterised by a period of below-average readings. Readings through much of 2021 generally fluctuated around the long-term average.

According to the latest report released by ifo, German business sentiment has improved a touch, albeit at a low level. May’s Business Climate Index recorded a reading of 93.0, above the consensus expectation of 91.0 and April’s final reading of 91.9. The average reading since January 2005 is just above 97.

“There are currently no observable signs of a recession,” said Clemens Fuest, President of the ifo Institute. He noted German companies were “much more satisfied with their current business” but remained “sceptical” of the outlook.

German firms’ views of current conditions improved while their collective outlook remained almost unchanged. The current situation index increased from April’s revised figure of 97.3 to 99.5 while the expectations index crept up from 86.8 to 86.9.

German and French long-term bond yields both rose noticeably on the day. By the close of business, the German 10-year bund rate had gained 7bps to 1.01% while the French 10-year OAT yield finished 6bps higher at 1.53%.

NAB economist Taylor Nugent noted the rise in the current conditions index presented “a picture of resilience rather than recession” but the expectations index “mired around 86.9 reminds of the significant headwinds still in play.” The ifo Institute’s business climate index is a composite index which combines German companies’ views of current conditions with their outlook for the next six months. It has similarities to consumer sentiment indices in the US such as the ones produced by The Conference Board and the University of Michigan.

It also displays a solid correlation with euro-zone GDP growth rates. However, the expectations index is a better predictor as it has a higher correlation when lagged by one quarter. May’s expectations index implies a 4.0% year-on-year contraction in GDP to the end of August 2022.

US leading index falls in April; Conference Board cuts growth forecast

20 May 2022

Summary: Conference Board leading index down 0.3% in April; lower than expected; signals moderate growth outlook in near-term; forecast for US GDP growth over calendar 2022 cut from 3.0% to 2.3%.

The Conference Board Leading Economic Index (LEI) is a composite index composed of ten sub-indices which are thought to be sensitive to changes in the US economy. The Conference Board describes it as an index which attempts to signal growth peaks and troughs; turning points in the index have historically occurred prior to changes in aggregate economic activity. Readings from March and April of 2020 signalled “a deep US recession” while subsequent readings indicated the US economy would recover rapidly.

The latest reading of the LEI indicates it decreased by 0.3% in April. The result was lower than consensus expectations as well as March’s revised figure of 0.1%.

“The US LEI declined in April largely due to weak consumer expectations and a drop in residential building permits,” said Ataman Ozyildirim, Senior Director of Economic Research at The Conference Board. “Overall, the US LEI was essentially flat in recent months which is in line with a moderate growth outlook in the near-term.”

US Treasury bond yields fell on the day, especially at the front of the curve. By the close of business, the 2-year yield had shed 8bps to 2.58%, the 10-year yield had lost 4bps to 2.84% while the 30-year yield finished 1bp lower at 3.05%.

In terms of US Fed policy, expectations of a higher federal funds range over the next 12 months softened. June contracts implied an effective federal funds rate of 1.10%, 27bps higher than the current spot rate.  June contracts implied a rate of 1.425% while May 2023 futures contracts implied an effective federal funds rate of 3.08%, 325bps above the spot rate. The Conference Board is expecting US GDP growth of 2.3% over calendar-year 2022, down from their forecast of 3.0% one month ago. Regression analysis suggests the latest reading implies a 3.5% year-on-year growth rate in July, down from June’s revised figure of 4.3%.            

“Promising sign” from March wage indices

18 May 2022

Summary: March quarter wages grow by 0.7%, slightly below expectations; annual growth rate ticks up from 2.3% to 2.4%; promising sign of a gathering of momentum in wages; business surveys show labour costs high,  rising; private sector wages up 2.4% over year, public sector up 2.2%; ABS underutilisation rate implies higher wage growth coming.

After unemployment increased and wage growth slowed during the GFC, a resources investment boom prompted a temporary recovery back to nearly 4% per annum. However, from mid-2013 through to the September quarter of 2016, the pace of wage increases slowed, until mid-2017 when it began to slowly creep upwards. After remaining fairly stable at around 2.2% per annum from September 2018 to March 2020, the growth rate slowed significantly in the June and September quarters of 2020 before recovering in 2021.

According to the latest Wage Price Index (WPI) figures published by the Australian Bureau of Statistics (ABS), hourly wages grew by 0.7% in the March quarter. The increase was slightly below expectations of a 0.8% rise but in line with the December quarter’s result. On an annual basis, the growth rate ticked up from 2.3% to 2.4%.

“The ABS noted that in the private sector the average rise of those workers getting a pay rise, about 15% of private sector workers, received a 3.4% increase, the largest increase since June 2013,” said Westpac senior economist Justin Smirk. “This is a promising sign we are seeing a gathering of momentum in wages in the private sector.”

Domestic Treasury bond yields moved higher on the day. By the close of business, the 3-year ACGB yield had added 3bps to 3.02%, the 10-year yield had gained 5bps to 3.49% while the 20-year yield finished 8bps higher at 3.83%.

In the cash futures market, expectations of the actual cash rate’s path over time remained largely unchanged. At the end of the day, contract prices implied the cash rate, currently at 0.31%, would rise to 0.575% in June and then rise to 1.425% by August. May 2023 contracts implied a cash rate of 3.355%, 305bps above the current cash rate.

“Notwithstanding the miss in this print, the trend higher is still clear; the labour market is tight with demand indicators suggesting it will tighten further and business surveys are showing that labour costs are high and rising,” said Morgan Stanley Australia equity strategist Chris Read.

Wages in the private and public sectors grew by 0.7% and 0.6% respectively in the quarter. Over the past 12 months, wages in the private sector increased by 2.4% while public sector wages grew by 2.2%. Annual wage growth in the two sectors had been at 2.4% and 2.1% respectively in the December quarter after revisions.

The “underutilisation rate” is simply the sum of the unemployment and underemployment rates as per ABS monthly statistics. It has a good correlation with private wage growth one quarter in the future and thus it is useful as a leading indicator. However, differences can open up from time to time. March’s underutilisation rate suggests private wage growth is likely to accelerate.

Each quarter the ABS surveys around 3,000 private and public enterprises regarding a sample of jobs in each workplace to measure changes in the price of labour across 18,000 jobs. The results are used to construct the Wage Price Index in a manner similar to the construction of the Consumer Price Index (CPI). Changes in the WPI over time provide a measure of changes in wages and salaries, independently of the type or quantity of work.

Westpac-MI leading index “comfortably above” zero in April

18 May 2022

Summary:  Leading index growth rate down in April; large boost coming in June, September quarters; reading implies annual GDP growth of around 3.50% to 3.75%; Westpac expects “solid lift” in consumer spending but higher prices to constrain spending in real terms.

Westpac and the Melbourne Institute describe their Leading Index as a composite measure which attempts to estimate the likely pace of Australian economic growth in the short-term. After reaching a peak in early 2018, the index trended lower through 2018 and 2019 before plunging to recessionary levels in the second quarter of 2020. Subsequent readings were markedly higher but readings through 2021 mostly declined.

The April reading of the six month annualised growth rate of the indicator registered 0.88%, down from March’s revised figure of 1.69%.

“By holding comfortably above the zero level, the Leading Index is also consistent with above-trend growth in 2022 and a large boost coming in the June and September quarters,” said Westpac Chief Economist Bill Evans.

Index figures represent rates relative to “trend” GDP growth, which is generally thought to be around 2.75% per annum in Australia. The index is said to lead GDP by “three to nine months into the future” but the highest correlation between the index and actual GDP figures occurs with a three-month lead. The current reading thus represents an annual GDP growth rate of around 3.50% to 3.75% in the September quarter.

Domestic Treasury bond yields moved higher on the day. By the close of business, the 2-year ACGB yield had added 3bps to 3.02%, the 10-year yield had gained 5bps to 3.49% while the 20-year yield finished 8bps higher at 3.83%.

In the cash futures market, expectations of the actual cash rate’s path over time remained largely unchanged. At the end of the day, contract prices implied the cash rate, currently at 0.31%, would rise to 0.575% in June and then rise to 1.425% by August. May 2023 contracts implied a cash rate of 3.355%, 305bps above the current cash rate.

Evan said he expects “a further solid lift in consumer spending as household savings normalises and more income flows through to spending.” However, he also noted higher prices will constrain spending in real terms

Vehicle sales, prices boost US April retail figures

17 May 2022

Summary:  US retail sales up 0.9% in April; rise a touch lower than expected; March figure revised up; savings, credit maintains consumption pattern; rises in eight of twelve retail categories; vehicles & parts” segment largest single influence.

US retail sales had been trending up since late 2015 but, commencing in late 2018, a series of weak or negative monthly results led to a drop-off in the annual growth rate below 2.0%. Growth rates then increased in trend terms through 2019 and into early 2020 until pandemic restrictions sent it into negative territory. A “v-shaped” recovery then took place which was followed by some short-term spikes as federal stimulus payments hit US households in the first and second quarters of 2021.

According to the latest “advance” numbers released by the US Census Bureau, total retail sales increased by 0.9% in April. The rise was a touch lower than the 1.0% gain which had been generally expected and well short of March’s 1.4% after it was revised up from 0.5%. On an annual basis, the growth rate accelerated from March’s revised figure of 7.3% to 8.2%.

“In April, headline sales were flattered by a 2.2% increase in auto sales while gains in the core number were broad based,” said NAB currency strategist Rodrigo Catril. “Notwithstanding the increase in prices, the use of savings and credit are helping maintain a strong US consumption pattern.”

The figures were released on the same day as April’s industrial production figures and US Treasury bond yields moved considerably higher, especially at the short end. By the close of business, the 2-year Treasury yield had jumped 13bps to 2.69%, the 10-year yield had gained 10bps to 2.99% while the 30-year yield finished 8bps higher at 3.18%.

Eight of the twelve categories recorded higher sales over the month. The “Motor vehicles & parts dealers” segment provided the largest single influence on the overall result, rising by 2.2% for the month but declining by 1.7% over the year to April. “Non-store retailer” sales increased by 2.1% over the month and by 12.7% over the year.

The non-store segment includes vending machine sales, door-to-door sales and mail-order sales but nowadays this segment has become dominated by online sales. It now accounts for nearly 16% of all US retail sales and it is the second-largest segment after vehicles and parts.

US industrial output beats estimates in April; “consistent with very solid demand pulse”

17 May 2022

Summary: US industrial output up 1.1% in April; above market expectations; up 6.4% over past 12 months; “consistent with very solid demand pulse”; capacity utilisation rate up 0.8ppt to 79.0%, still short of long-term average.

The Federal Reserve’s industrial production (IP) index measures real output from manufacturing, mining, electricity and gas company facilities located in the United States. These sectors are thought to be sensitive to consumer demand and so some leading indicators of GDP use industrial production figures as a component.

US production collapsed through March and April of 2020 before recovering the ground lost over the fifteen months to July 2021.

According to the Federal Reserve, US industrial production expanded by 1.1% on a seasonally adjusted basis in April. The result was substantially greater than the 0.4% which had been generally expected and above March’s 0.9% increase. On an annual basis, the growth rate picked up from March’s revised figure of 5.4% to 6.4%.

“All up, the data are consistent with a very solid demand pulse,” said ANZ Head of Australian Economics David Plank.

The figures were released on the same day as April’s retail sales report and US Treasury bond yields moved considerably higher, especially at the short end. By the close of business, the 2-year Treasury yield had jumped 13bps to 2.69%, the 10-year yield had gained 10bps to 2.99% while the 30-year yield finished 8bps higher at 3.18%.

The same report includes US capacity utilisation figures which are generally accepted as an indicator of future investment expenditure and/or inflationary pressures. Capacity usage had hit a high for the last business cycle in early 2019 before it began a downtrend which ended with April 2020’s multi-decade low of 64.2%. April’s reading increased from March’s revised figure of 78.2% to 79.0%, still short of the long-term average of 80.1%.

While the US utilisation rate’s correlation with the US jobless rate is solid, it is not as high as the comparable correlation in Australia.

UoM confidence index continues downtrend in May

13 May 2022

Summary: University of Michigan consumer confidence index softens in May, below consensus expectations; views of present conditions, future conditions both deteriorate; declines across all demographic groups.

US consumer confidence started 2020 at an elevated level but, after a few months, surveys began to reflect a growing unease with the global spread of COVID-19 and its reach into the US. Household confidence plunged in April 2020 and then recovered in a haphazard fashion, generally fluctuating at below-average levels according to the University of Michigan. The University’s measure of confidence had recovered back to the long-term average by April 2021 but then it plunged again in the September quarter and has since remained at historically low levels.

The latest survey conducted by the University indicates confidence among US households softened on average in May. The preliminary reading of the Index of Consumer Sentiment registered 59.1, below the generally expected figure of 64.0 as well as April’s final figure of 65.2. Consumers’ views of current conditions and expectations regarding future conditions both deteriorated in comparison to those held at the time of the April survey.

The University’s Surveys of Consumers chief economist, Richard Curtin, noted declines in confidence across demographic groups. “These declines were broad based–for current economic conditions as well as consumer expectations, and visible across income, age, education, geography, and political affiliation–continuing the general downward trend in sentiment over the past year. “

Long-term US Treasury bond yields moved higher lower on the day. By the close of business, the 10-year Treasury yield had added 3bps to 2.92% and the 30-year yield had gained 6bps to 3.08%. The 2-year yield finished unchanged at 2.58%.

Less-confident households are generally inclined to spend less and save more; some decline in household spending could be expected to follow. As private consumption expenditures account for a majority of GDP in advanced economies, a lower rate of household spending growth would flow through to lower GDP growth if other GDP components did not compensate.

Click for more news