News

Job ads dip in April; “solid employment gains” in “coming months”

02 May 2022

Summary:  Job ads down 0.5% in April; 26.3% higher than same month in 2021; solid employment gains “in coming months” from strong labour demand; 1.7% ads-to-workforce ratio consistent with low jobless rate.

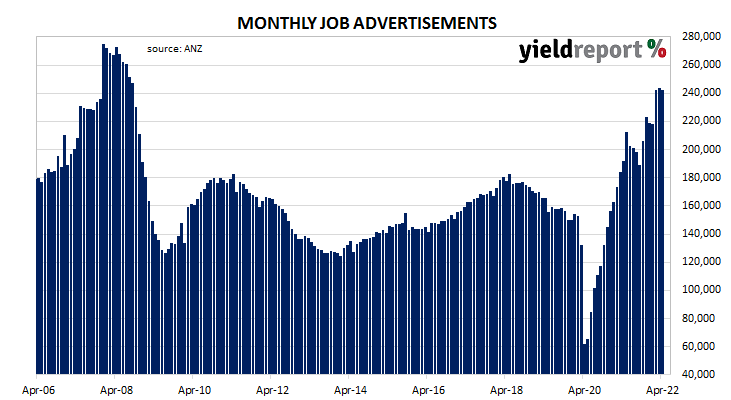
From mid-2017 onwards, year-on-year growth rates in the total number of Australian job advertisements consistently exceeded 10%. That was until mid-2018 when the annual growth rate fell back markedly. 2019 was notable for its reduced employment advertising and this trend continued into the first quarter of 2020. Advertising plunged in April and May of 2020 as pandemic restrictions took effect but then recovered quite quickly.

According to the latest ANZ figures, total advertisements decreased by 0.5% in April on a seasonally-adjusted basis. The fall followed a 0.7% rise in March and an 11.1% jump in February after revisions. On a 12-month basis, total job advertisements were 26.3% higher than in April 2021, down from March’s revised figure of 32.2%.

“We expect strong labour demand to lead to solid employment gains in the coming months. We see the unemployment rate dropping well below 4% in the second half of 2022, which should reinforce the momentum toward higher wages growth,” said ANZ Head of Australian Economics David Plank.

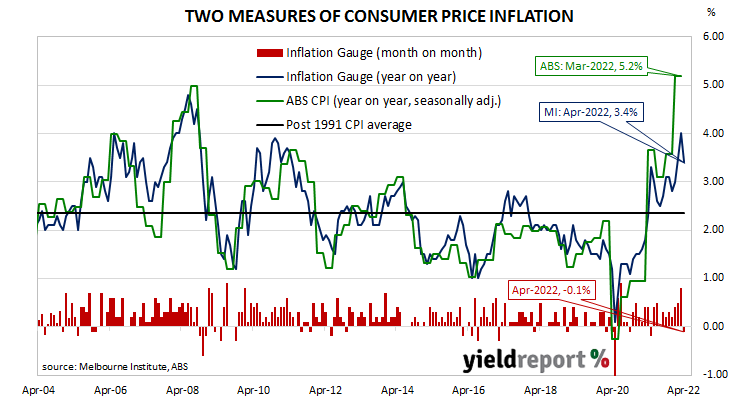
The figures were released at roughly the same time as the Melbourne Institute’s latest Inflation Gauge reading but the effect of either on Commonwealth Government bond yields were overshadowed by jumps in US Treasury yields on Friday night. By the close of business, the 3-year ACGB yield had gained 12bps to 2.86%, the 10-year yield had leaped 14bps to 3.31% while the 20-year yield finished 12bps higher at 3.57%.

In the cash futures market, expectations of any material change in the actual cash rate, currently at 0.06%, softened a touch. At the end of the day, contract prices implied the cash rate would rise to 0.195% in May and then move to 1.315% in August. February 2023 contracts implied a cash rate of 2.79%.

The inverse relationship between job advertisements and the unemployment rate has been quite strong (see below chart), although ANZ themselves called the relationship between the two series into question in early 2019. A rising number of job advertisements as a proportion of the labour force is suggestive of lower unemployment rates in the near-future while a falling ratio suggests higher unemployment rates will follow.

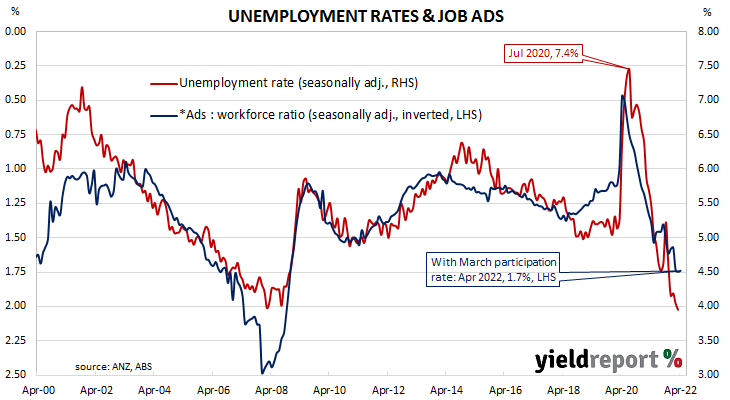
In 2008/2009, advertisements plummeted and Australia’s unemployment rate jumped from 4% to nearly 6% over a period of 15 months. When a more dramatic fall in advertisements took place in April 2020, the unemployment rate responded much more quickly.

Inflation Gauge dips in April as fuel prices fall back

02 May 2022

Summary: Melbourne Institute Inflation Gauge index down 0.1% in April; up 3.4% on annual basis; fall largely associated recent fuel price decline; inflation to remain elevated in short term”, moderate in coming quarters.

The Melbourne Institute’s Inflation Gauge is an attempt to replicate the ABS consumer price index (CPI) on a monthly basis. It has turned out to be a reliable leading indicator of the CPI, although there are periods in which the Inflation Gauge and the CPI have diverged for as long as twelve months. On average, the Inflation Gauge’s annual rate tends to overestimate the ABS rate by around 0.1%.

The Melbourne Institute’s latest reading of its Inflation Gauge index indicates consumer inflation declined by 0.1% in April. The rise follows increases of 0.8% in March and 0.5% in February. On an annual basis, the index rose by 3.4%, down from 4.0% in March.

“The fall in headline inflation for April is largely associated with a recent decline in fuel prices, which surged in February and March. In contrast, housing-related costs continued to rise in April,” said the Melbourne Institute’s Associate Professor Sam Tsiaplias.

The figures were released at roughly the same time as ANZ’s latest Job Ads report but the effect of either on Commonwealth Government bond yields were overshadowed by jumps in US Treasury yields on Friday night. By the close of business, the 3-year ACGB yield had gained 12bps to 2.86%, the 10-year yield had leaped 14bps to 3.31% while the 20-year yield finished 12bps higher at 3.57%.

In the cash futures market, expectations of any material change in the actual cash rate, currently at 0.06%, softened a touch. At the end of the day, contract prices implied the cash rate would rise to 0.195% in May and then move to 1.315% in August. February 2023 contracts implied a cash rate of 2.79%.

Tsiaplias expects inflation rates to “remain elevated in the short term” but “likely moderate in coming quarters, even without aggressive monetary policy.” He said the March quarter’s “spike” was largely attributable to fuel price rises and “supply-side constraints” in the housing market.

Core PCE prices up 0.3% in March; annual rate slows

29 April 2022

Summary: US core PCE price index up 0.3% in March; in line with expectations; annual rate slows from 5.3% to 5.2%; first slowing of annual rate since October 2020, more expected; Treasury yields up considerably; nearly 275bps of Fed rate rises priced in.

One of the US Fed’s favoured measures of inflation is the change in the core personal consumption expenditures (PCE) price index. After hitting the Fed’s target at the time of 2.0% in mid-2018, the annual rate then hovered in a range between 1.8% and 2.0% before it eased back to a range between 1.5% and 1.8% through 2019. It then plummeted below 1.0% in April 2020 before rising back to around 1.5% in the September quarter of that year. It has since ran up well above the Fed’s target.

The latest figures have now been published by the Bureau of Economic Analysis as part of the March personal income and expenditures report. Core PCE prices rose by 0.3% over the month, in line with expectations as well as February’s increase after it was revised down. On a 12-month basis, the core PCE inflation rate slowed from February’s revised figure of 5.3% to 5.2%.

NAB currency strategist Rodrigo Catril noted it was the first decline in the annual rate since October 2020 and “more of the same is expected with base effects remaining favourable over coming months.” ANZ Head of Australian Economics David Plank echoed this sentiment, noting “these price increases were stronger earlier in the quarter, indicating inflation may have peaked.”

US Treasury bond yields increased considerably on the day. By the close of business, the 2-year Treasury bond yield had gained 9bps to 2.72%, the 10-year yield had added 11bps to 2.94% while the 30-year yield finished 10bps higher at 3.00%.

In terms of US Fed policy, expectations of a higher federal funds rate over the next 12 months firmed. At the close of business, May contracts implied an effective federal funds rate of 0.785%, 45bps higher than the current spot rate. August contracts implied a rate of 1.93% and March 2023 futures contracts implied 3.055%, nearly 275bps above the spot rate.

The core version of PCE strips out energy and food components, which are volatile from month to month, in an attempt to identify the prevailing trend. It is not the only measure of inflation used by the Fed; the Fed also tracks the Consumer Price Index (CPI) and the Producer Price Index (PPI) from the Department of Labor. However, it is the one measure which is most often referred to in FOMC minutes.

March credit growth slows; “set to cool”

29 April 2022

Summary: Private sector credit up 0.4% in March; below expectations; annual growth rate slips from 7.9% to 7.8%; owner-occupiers leading lending growth; housing credit growth set to cool; investor loans account for about 45% of net growth in March, owner-occupiers loans 30%.

The pace of lending to the non-bank private sector by financial institutions in Australia followed a steady-but-gradual downtrend from late-2015 through to early 2020 before hitting what appears to be a nadir in March 2021. That downtrend ended later in the same year and now annual growth rates are above the peak rate seen in the previous decade.

According to the latest RBA figures, private sector credit increased by 0.4% in March. The result was below expectations as well as February’s 0.6% increase. On an annual basis, the growth rate slipped from 7.9% to 7.8%.

“Owner-occupiers have led this cycle, with annual growth for the segment at 9.1%…the strongest annual pace since mid-2008. Investors have returned in greater numbers of late, with annual growth lifting to be at 5.3% currently,” said ANZ senior economist Andrew Hanlan.

Commonwealth Government bond yields rose modestly on the day. By the close of business, the 3-year ACGB yield had gained 3bps to 2.86%, the 10-year yield had added 4bps to 3.17% while the 20-year yield finished 2bps higher at 3.45%.

In the cash futures market, expectations of any material change in the actual cash rate, currently at 0.06%, eased a little in regard to rate rises over the next four months but firmed in regard to late-2022 and early 2023. At the end of the day, contract prices implied the cash rate would not exceed the RBA’s 0.10% target rate until May and then rise to 0.53% by June and 1.34% by August. February 2023 contracts implied a cash rate of 2.725%.

“Looking ahead, housing credit growth is set to cool with an imminent RBA tightening cycle, likely beginning with a rate rise at the May meeting,” Hanlan added. He noted there were already “tentative signs” the owner-occupier market is cooling.

Investor loans accounted for a little over 45% of the net growth over the month, while owner-occupier loans and business loans accounted for a little over 30% and 20% respectively. Total personal debt contracted.

The traditional driver of loan growth rates, the owner-occupier segment, grew by 0.6% over the month, slightly lower than February’s 0.7% increase. The sector’s 12-month growth rate slowed from 9.3% to 9.1%.

Total lending in the business sector rose by 0.3%, down from the 0.8% increase recorded in February. The segment’s annual growth rate slowed from 9.8% to 9.4%.

Monthly growth in the investor-lending segment slowed to a halt in early 2018. Shortly into the 2019/20 financial year, monthly growth rates slipped into the red before posting a series of flat or near-flat results until mid-2020.

In March, net lending grew by 0.6%, up from February’s 0.5% increase. The 12-month growth rate accelerated from 4.9% to 5.3%.                                    

Total personal loans contracted by 0.2%, down from February’s flat result, taking the annual contraction rate from 3.0% to 3.3%. This category of debt includes fixed-term loans for large personal expenditures, credit cards and other revolving credit facilities.

US GDP contracts in March quarter; imports dragging

28 April 2022

Summary:  US GDP down 0.4% (1.4% annualised) in March quarter; contrasts with 0.2% increase (1.0% annualised) expected; “some flattening” of growth, consumption; Import growth “phenomenally strong”, main drag on GDP; GDP price deflator annual rate rises from 5.9% to 6.8%.

US GDP growth slowed in the second quarter of 2019 before stabilising at about 0.5% per quarter.  At the same time, US bond yields suggested future growth rates would be below trend. The US Fed agreed and it reduced its federal funds range three times in the second half of 2019. Pandemic restrictions in the June quarter of 2020 sent parts of the US economy into hibernation; the lifting of those same restrictions sparked a rapid recovery.

The US Bureau of Economic Analysis has now released March quarter “advance” GDP estimates and they indicate the US economy contracted by 0.4% or at an annualised rate of 1.4%. The figure contrasted with the 0.2% increase (+1.0% annualised) which had been generally expected as well as the December quarter’s 1.7% expansion after revisions.

“While there was certainly noise within the GDP figures and should be downplayed somewhat, it does suggest some flattening off of growth and consumption…” said NAB senior economist Tapas Strickland.

US GDP numbers are published in a manner which is different to most other countries; quarterly figures are compounded to give an annualised figure. In countries such as Australia and the UK, an annual figure is calculated by taking the latest number and comparing it with the figure from the same period in the previous year. The diagram above shows US GDP once it has been expressed in the normal manner, as well as the annualised figure.

US Treasury bond yields moved higher at the short end on the day but barely moved elsewhere along the curve. By the close of business, the 2-year Treasury bond yield had gained 4bps to 2.63%, the 10-year yield had returned to its starting point at 2.83% while the 30-year yield finished 1bp to 2.90%. In terms of US Fed policy, expectations for a higher federal funds rate over the next 12 months firmed. At the close of business, May contracts implied an effective federal funds rate of 0.775%, 44bps higher than the current spot rate. July contracts implied 1.475% while March 2023 futures contracts implied an effective federal funds rate of 2.975%, 264bps above the spot rate.

“Inventories and government spending need to normalise following the pandemic and supply chain disruption, so that volatility is understandable,” said ANZ Head of Australian Economics David Plank. “Import growth, however, is phenomenally strong and is the main drag on GDP. It argues strongly that the Fed needs to proceed with rate rises.”

One part of the report which is often overlooked are the figures regarding the GDP price deflator, which is another measure of inflation. The GDP price deflator is restricted to new, domestically-produced goods and services and it is not based on a fixed basket as is the case for the consumer price index (CPI). The annual rate rose from the December quarter’s revised figure of 5.9% to 6.8%.

Conference Board Confidence Index up in April; recent slump “may be abating”

26 April 2022

Summary: Conference Board Consumer Confidence Index deteriorates in April; lower than consensus expectations; view of present conditions deteriorate, short-term outlook improves; Present Situation Index  “remains quite high”, implies US economy will continue expansion in June quarter; “recent slump in confidence may be abating”.

After the GFC in 2008/09, US consumer confidence clawed its way back to neutral over a number of years and then went from strength to strength until late 2018. Measures of consumer confidence then oscillated within a fairly narrow band at historically high levels until they plunged in early 2020. Subsequent readings then fluctuated around the long-term average until March 2021 when they reached elevated levels.

The latest Conference Board survey held during the first three weeks of April indicated US consumer confidence has again deteriorated slightly. April’s Consumer Confidence Index registered 107.3 on a preliminary basis, lower than the median consensus figure of 108.4 and slightly below March’s final figure of 107.6.

In contrast with March’s report, consumers’ views of present conditions deteriorated slightly while their outlook for the near-future improved. The Present Situation Index slipped from March’ revised figure of 153.8 to 152.6 while the Expectations Index increased from a revised figure of 76.7 to 77.2.

“The Present Situation Index declined but remains quite high, suggesting the economy continued to expand in early Q2. Expectations, while still weak, did not deteriorate further amid high prices, especially at the gas pump, and the war in Ukraine,” said Lynn Franco, a senior director at The Conference Board.

US Treasury yields moved loved on the day, especially at the short end of the yield curve. By the close of business, the 2-year Treasury bond yield had shed 13bps to 2.50%, the 10-year yield had lost 9bps to 2.73% while the 30-year yield finished 6bps lower at 2.83%.

In terms of US Fed policy, expectations for a higher federal funds rate over the next 12 months softened. At the close of business, May contracts implied an effective federal funds rate of 0.775%, 44bps higher than the current spot rate. July contracts implied 1.45% while March 2023 futures contracts implied an effective federal funds rate of 2.895%, 256bps above the spot rate.

ANZ senior economist Felicity Emmett noted the index reading was below expectations but still suggested “the recent slump in confidence may be abating.” However, she also pointed to inflation as “undoubtedly a factor at play in the recent weakness in confidence.”

The Consumer Confidence Survey is one of two monthly US consumer sentiment surveys which result in the construction of an index. The Conference Board’s index is based on perceptions of current business and employment conditions, as well as respondents’ expectations of conditions six months in the future. The other survey, conducted by the University of Michigan, is similar and it is used to produce an Index of Consumer Sentiment. That survey differs in that it also includes some longer-term questions.

ifo index improves in April; German economy shows “resilience”

25 April 2022

Summary: ifo business climate index up in April; above expected figure; current conditions, expectations indices both up; shock of Ukraine war wearing off; growth still subdued at start of Q2; expectations index implies euro-zone GDP contraction of 4.4% in year to July 2022.

Following a recession in 2009/2010, the ifo Institute’s Business Climate Index largely ignored the European debt-crisis of 2010-2012, mostly posting average-to-elevated readings through to early-2020. However, the index was quick to react in the March 2020 survey, falling precipitously. The rebound which began in May of that year was almost as sharp but it was also characterised by a period of below-average readings. Readings through much of 2021 generally fluctuated around the long-term average.

According to the latest report released by ifo, German business sentiment has improved a touch, albeit at a low level. April’s Business Climate Index recorded a reading of 91.8, above the expected reading of 88.1 as well as March’s final reading of 90.8. The average reading since January 2005 is just above 97.

“After the initial shock of the Russian attack, the German economy has shown its resilience,” said Clemens Fuest, President of the ifo Institute.

German firms’ views of current conditions barely changed while their collective outlook improved. The current situation index crept up from March’s revised figure of 97.1 to 97.2 while the expectations index increased from 84.9 to 86.7.

German and French long-term bond yields both fell noticeably on the day. By the close of business, the German 10-year bund rate had shed 12bps to 0.85% while the French 10-year OAT yield finished 10bps lower at 1.01%.

“The index surprised to the upside as it was expected to fall due to the war in Ukraine pushing up energy costs. The stability in the index is encouraging, but the data still argue that growth remains subdued at the start of Q2,” said ANZ senior economist Adelaide Timbrell.

The ifo Institute’s business climate index is a composite index which combines German companies’ views of current conditions with their outlook for the next six months. It has similarities to consumer sentiment indices in the US such as the ones produced by The Conference Board and the University of Michigan.

It also displays a solid correlation with euro-zone GDP growth rates. However, the expectations index is a better predictor as it has a higher correlation when lagged by one quarter. April’s expectations index implies a 4.4% year-on-year contraction in GDP to the end of July 2022.

Conference Board says US growth “likely to continue through 2022”

21 April 2022

Summary: Conference Board leading index up 0.3% in March; in line with expectations; signals economic growth “likely to continue through 2022”; still forecasts 3.0% US GDP growth for calendar 2022 but “downside risks” remain.

The Conference Board Leading Economic Index (LEI) is a composite index composed of ten sub-indices which are thought to be sensitive to changes in the US economy. The Conference Board describes it as an index which attempts to signal growth peaks and troughs; turning points in the index have historically occurred prior to changes in aggregate economic activity. Readings from March and April of 2020 signalled “a deep US recession” while subsequent readings indicated the US economy would recover rapidly.

The latest reading of the LEI indicates it increased by 0.3% in March. The result was in line with the consensus forecast but half of February’s revised figure of 0.6%. On an annual basis, the LEI growth rate slowed from 9.3% after revisions to 8.1%.

“The US LEI rose again in March despite headwinds from the war in Ukraine,” said Ataman Ozyildirim, Senior Director of Economic Research at The Conference Board. “This broad-based improvement signals economic growth is likely to continue through 2022 despite volatile stock prices and weakening business and consumer expectations.

US Treasury bond yields rose on the day, especially at the front of the curve. By the close of business, the 2-year yield had jumped 11bps to 2.67%, the 10-year yield had gained 7bps to 2.91% while the 30-year yield finished 5bps higher at 2.93%.

In terms of US Fed policy, expectations of a higher federal funds range over the next 12 months hardened considerably. May contracts implied an effective federal funds rate of 0.785%, 34bps higher than the current spot rate.  June contracts implied a rate of 1.12% while March 2023 futures contracts implied an effective federal funds rate of 3.02%, 269bps above the spot rate.

The Conference Board is still expecting US GDP growth of 3.0% over calendar-year 2022, with a 0.5 percentage point discount factored in for the war in Ukraine. However, Ozyildirim noted “downside risks” remain, pointing to further supply-chain disruptions, shutdowns, tightening monetary policy and labour shortages.

Regression analysis suggests the latest reading implies a 4.3% year-on-year growth rate in June, down from May’s revised figure of 4.8%.  

Euro consumer sentiment improves; “surprising” given Ukraine

21 April 2022

Summary: Euro-zone households less pessimistic in April; Consumer Confidence Indicator up 1.8 points to -16.9; well below long-term average, just inside lower bound of normal readings; euro-zone sovereign bond yields higher.

EU consumer confidence plunged during the GFC and again in 2011/12 during the European debt crisis. After bouncing back through 2013 and 2014, it fell back significantly in late 2018 but only to a level which corresponds to significant optimism among households. Following the plunge which took place in April 2020, a recovery began a month later, with household confidence returning to above-average levels in March 2021. However, more recent readings have been low by historical standards.

Consumer confidence improved in April according to the latest survey conducted by the European Commission. Its Consumer Confidence Indicator recorded a reading of -16.9, higher than the -20.0 which had been generally expected as well as March’s figure of -18.7. However, the reading is still well below the long-term average of -11.6 and just inside the lower end of the range in which “normal” readings usually occur.

“Confidence levels amongst European consumers is better than expected which is a tad surprising given the Ukraine situation,” said ANZ senior economist Adelaide Timbrell.

Sovereign bond yields rose strongly in major euro-zone bond markets on the day. By the end of it, the German 10-year bund yield had gained 9bps to 0.94% and the French 10-year OAT yield had added 6bps to 1.39%.

Growth prospects encouraging; Westpac-MI leading index kicks up

21 April 2022

Summary:  Leading index growth rate up in March; February reading revised up; growth prospects “are encouraging”; reading implies annual GDP growth of around 4.25%; figures consistent with Westpac’s upbeat view of economy’s growth momentum.

Westpac and the Melbourne Institute describe their Leading Index as a composite measure which attempts to estimate the likely pace of Australian economic growth in the short-term. After reaching a peak in early 2018, the index trended lower through 2018 and 2019 before plunging to recessionary levels in the second quarter of 2020. Subsequent readings were markedly higher but readings through 2021 mostly declined.

The March reading of the six month annualised growth rate of the indicator registered 1.71%, up from February’s revised figure of 1.02%. February’s reading was revised up from -0.25%.

Westpac Chief Economist Bill Evans described the figures from the early months of 2022 as signs “that growth prospects for the next 3 to 9 months are encouraging.”

Index figures represent rates relative to “trend” GDP growth, which is generally thought to be around 2.75% per annum in Australia. The index is said to lead GDP by “three to nine months into the future” but the highest correlation between the index and actual GDP figures occurs with a three-month lead. The current reading thus represents an annual GDP growth rate of around 4.25% in the June quarter.

Domestic Treasury bond yields moved higher on the day. By the close of business, the 3-year ACGB yield had gained 8bps to 2.73% while 10-year and 20-year yields both finished 4bps higher at 3.16% and 3.50% respectively.

In the cash futures market, expectations of any material change in the actual cash rate, currently at 0.06%, firmed in favour of rate rises over the next twelve months. At the end of the day, contract prices implied the cash rate would not exceed the RBA’s 0.10% target rate until May and then rise to 0.375% by June. February 2023 contracts implied a cash rate of 2.285%.

Evans noted the figures “are consistent with Westpac’s upbeat view of the growth momentum in the economy for most of 2022.” He expects GDP growth of “around 5.5%” over the year, with much of this growth “concentrated in the June and September quarters.”

Click for more news