
Summary:
The Australian yield curve has exhibited notable volatility since 2019, with sharp steepening during mid-2020 and early 2021—likely reflecting aggressive monetary easing and pandemic-driven fiscal stimulus. These peaks indicate heightened investor expectations for long-term economic recovery, despite short-term uncertainty.
- Post-2021 Flattening: The spread narrowed significantly through 2022–2023, indicating a shift toward tighter monetary policy and more cautious growth expectations.
- Recent Uptick (2025): A modest re-steepening in mid-2025 may reflect renewed optimism or potential rate cuts priced into the short end, possibly in response to softening inflation or economic slowdown signals.
This curve behaviour underscores the Reserve Bank of Australia’s balancing act between inflation control and supporting growth, with the spread serving as a barometer of market sentiment around future rate trajectories.
Figure 1: Australia 3 and 10-year Bond Yield Spread
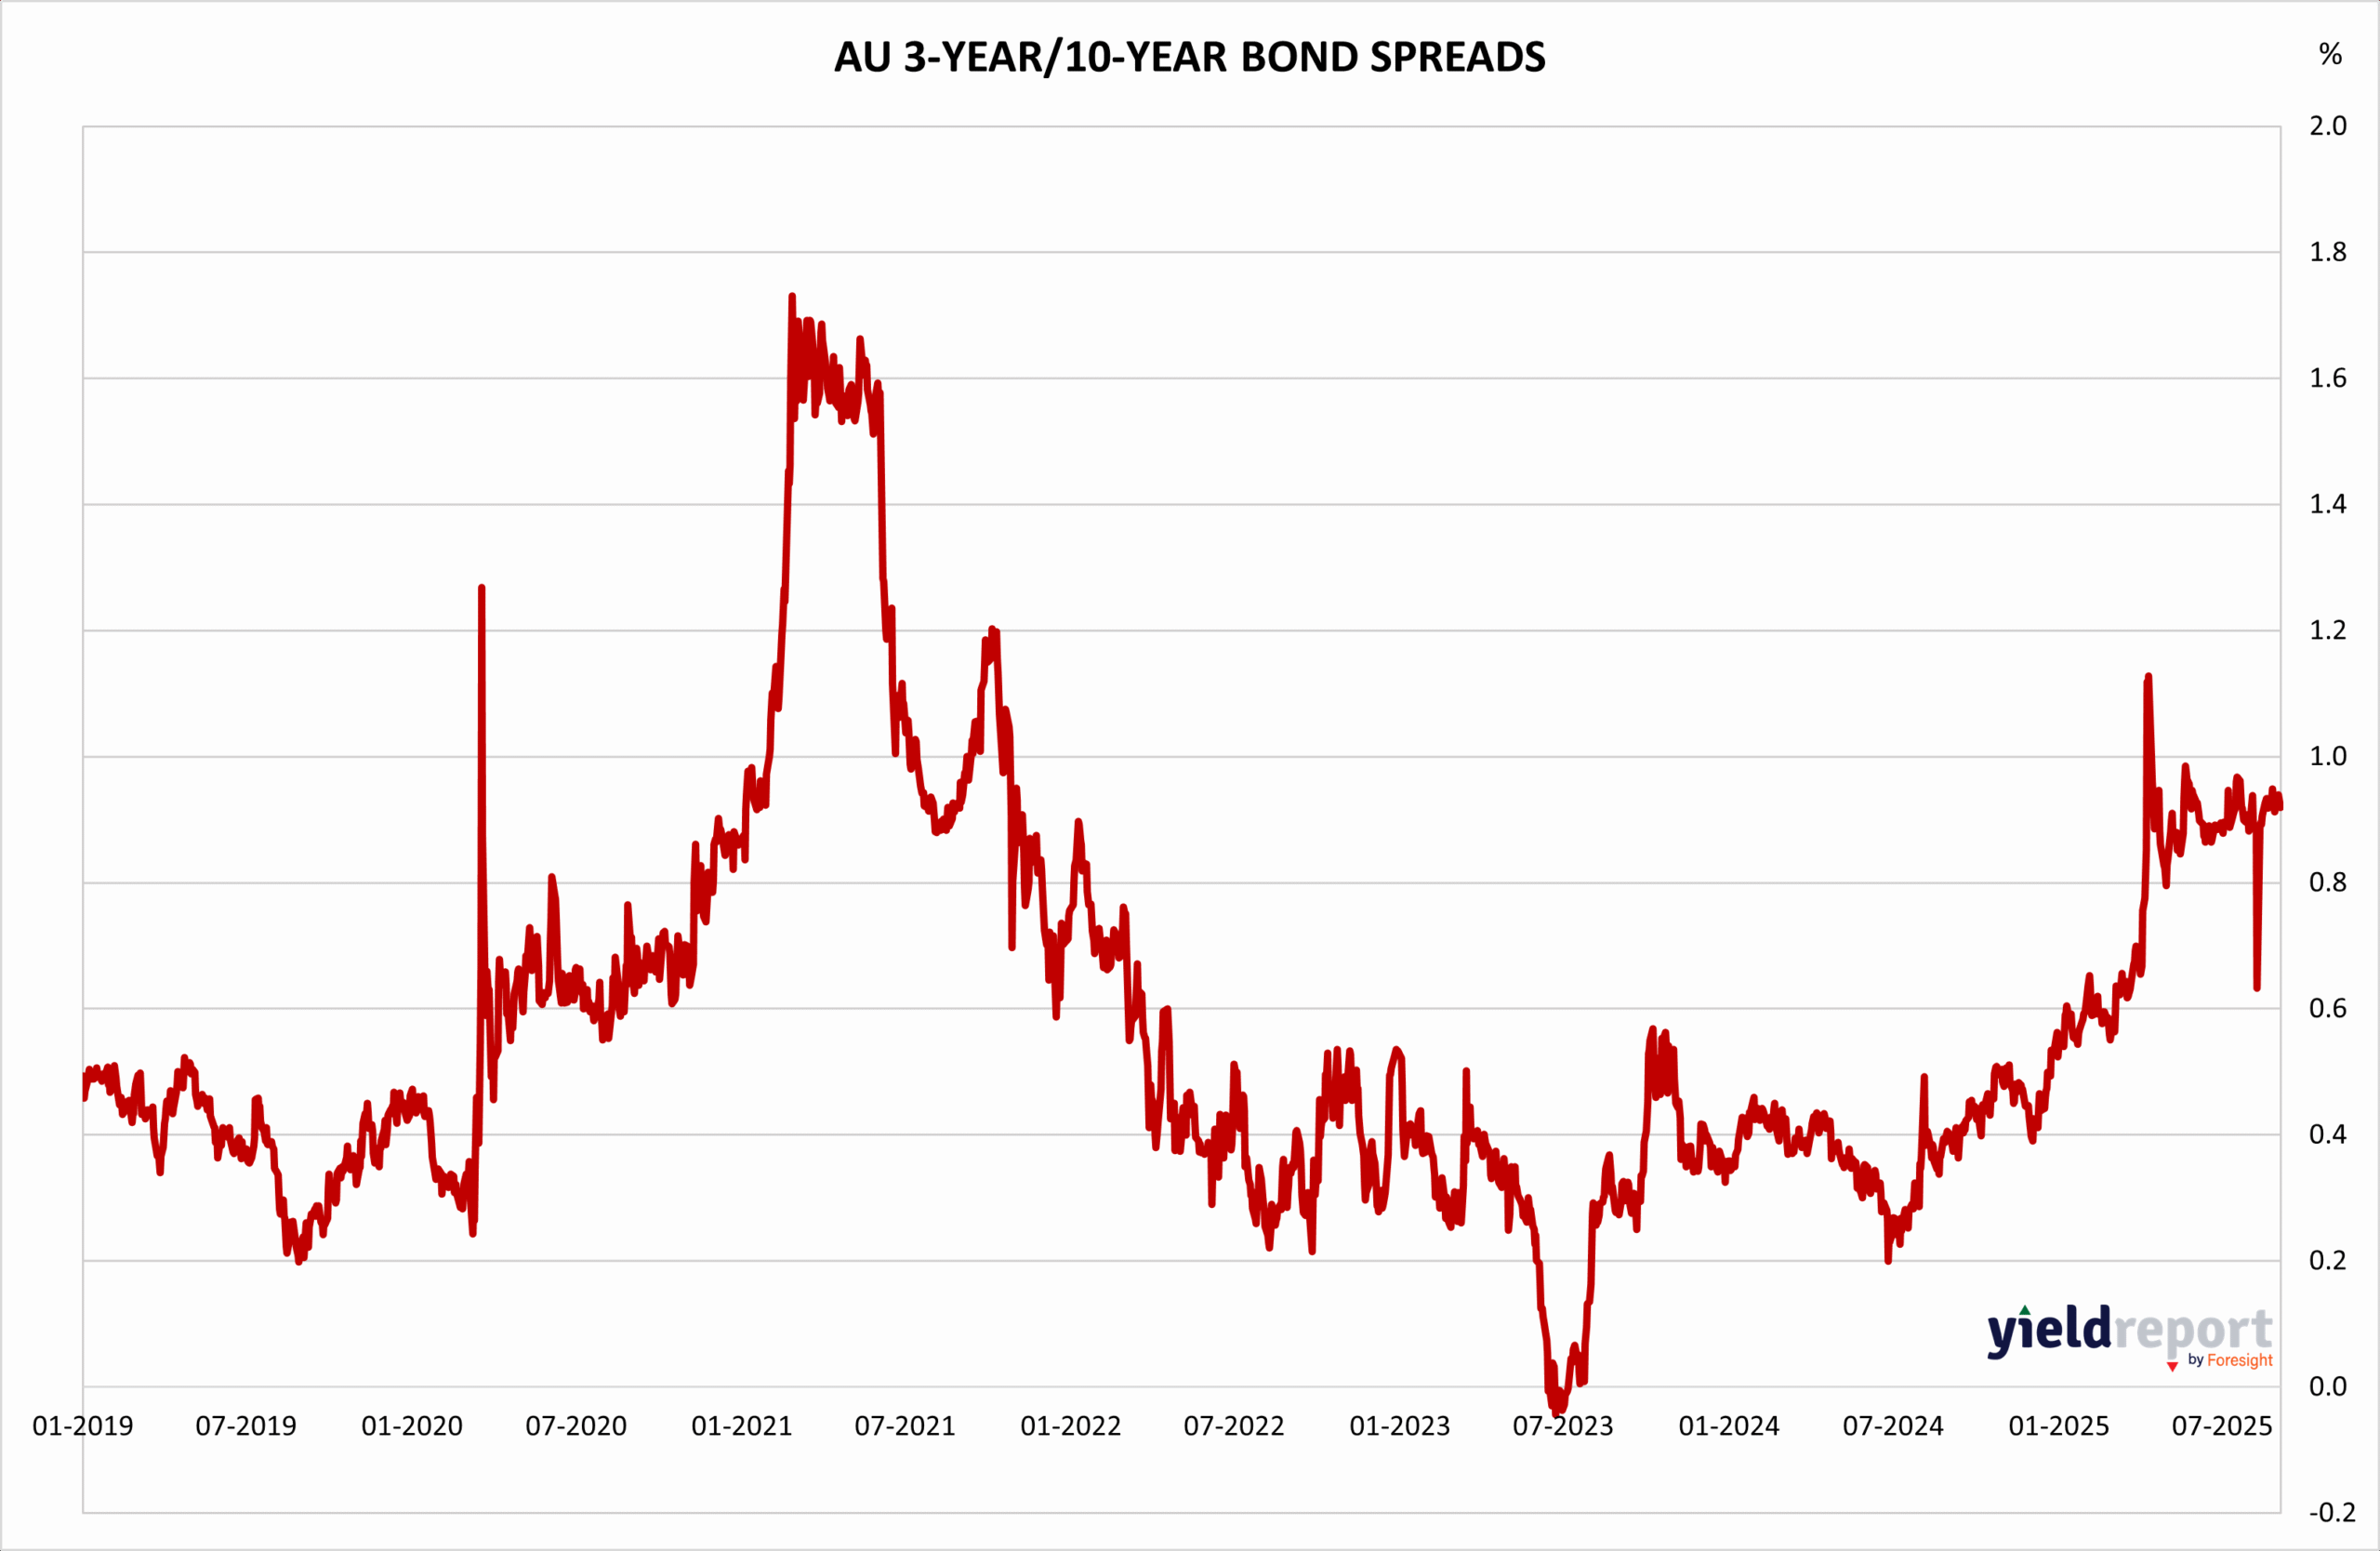
Figure 2: US 2 and 10-year Bond Spread

The U.S. yield curve from 2010 to 2015 reveals a classic cyclical pattern, with steepening during early recovery phases and flattening as monetary tightening looms.
- Mid-2011 Peak: The spread above 1.5% aligns with post-GFC recovery momentum and accommodative Fed policy.
- Mid-2012 Inversion: A brief dip below zero signals investor concern over growth sustainability and potential deflationary pressures.
- Gradual Re-steepening (2013–2015): Reflects improving macro conditions and anticipation of Fed normalization, though still cautious.
This historical curve behavior illustrates how U.S. Treasuries have long served as a forward-looking gauge of economic cycles, with inversion episodes often preceding recessions.
To learn more about yield curves and their predictive power, visit this article or this one.