
Summary:
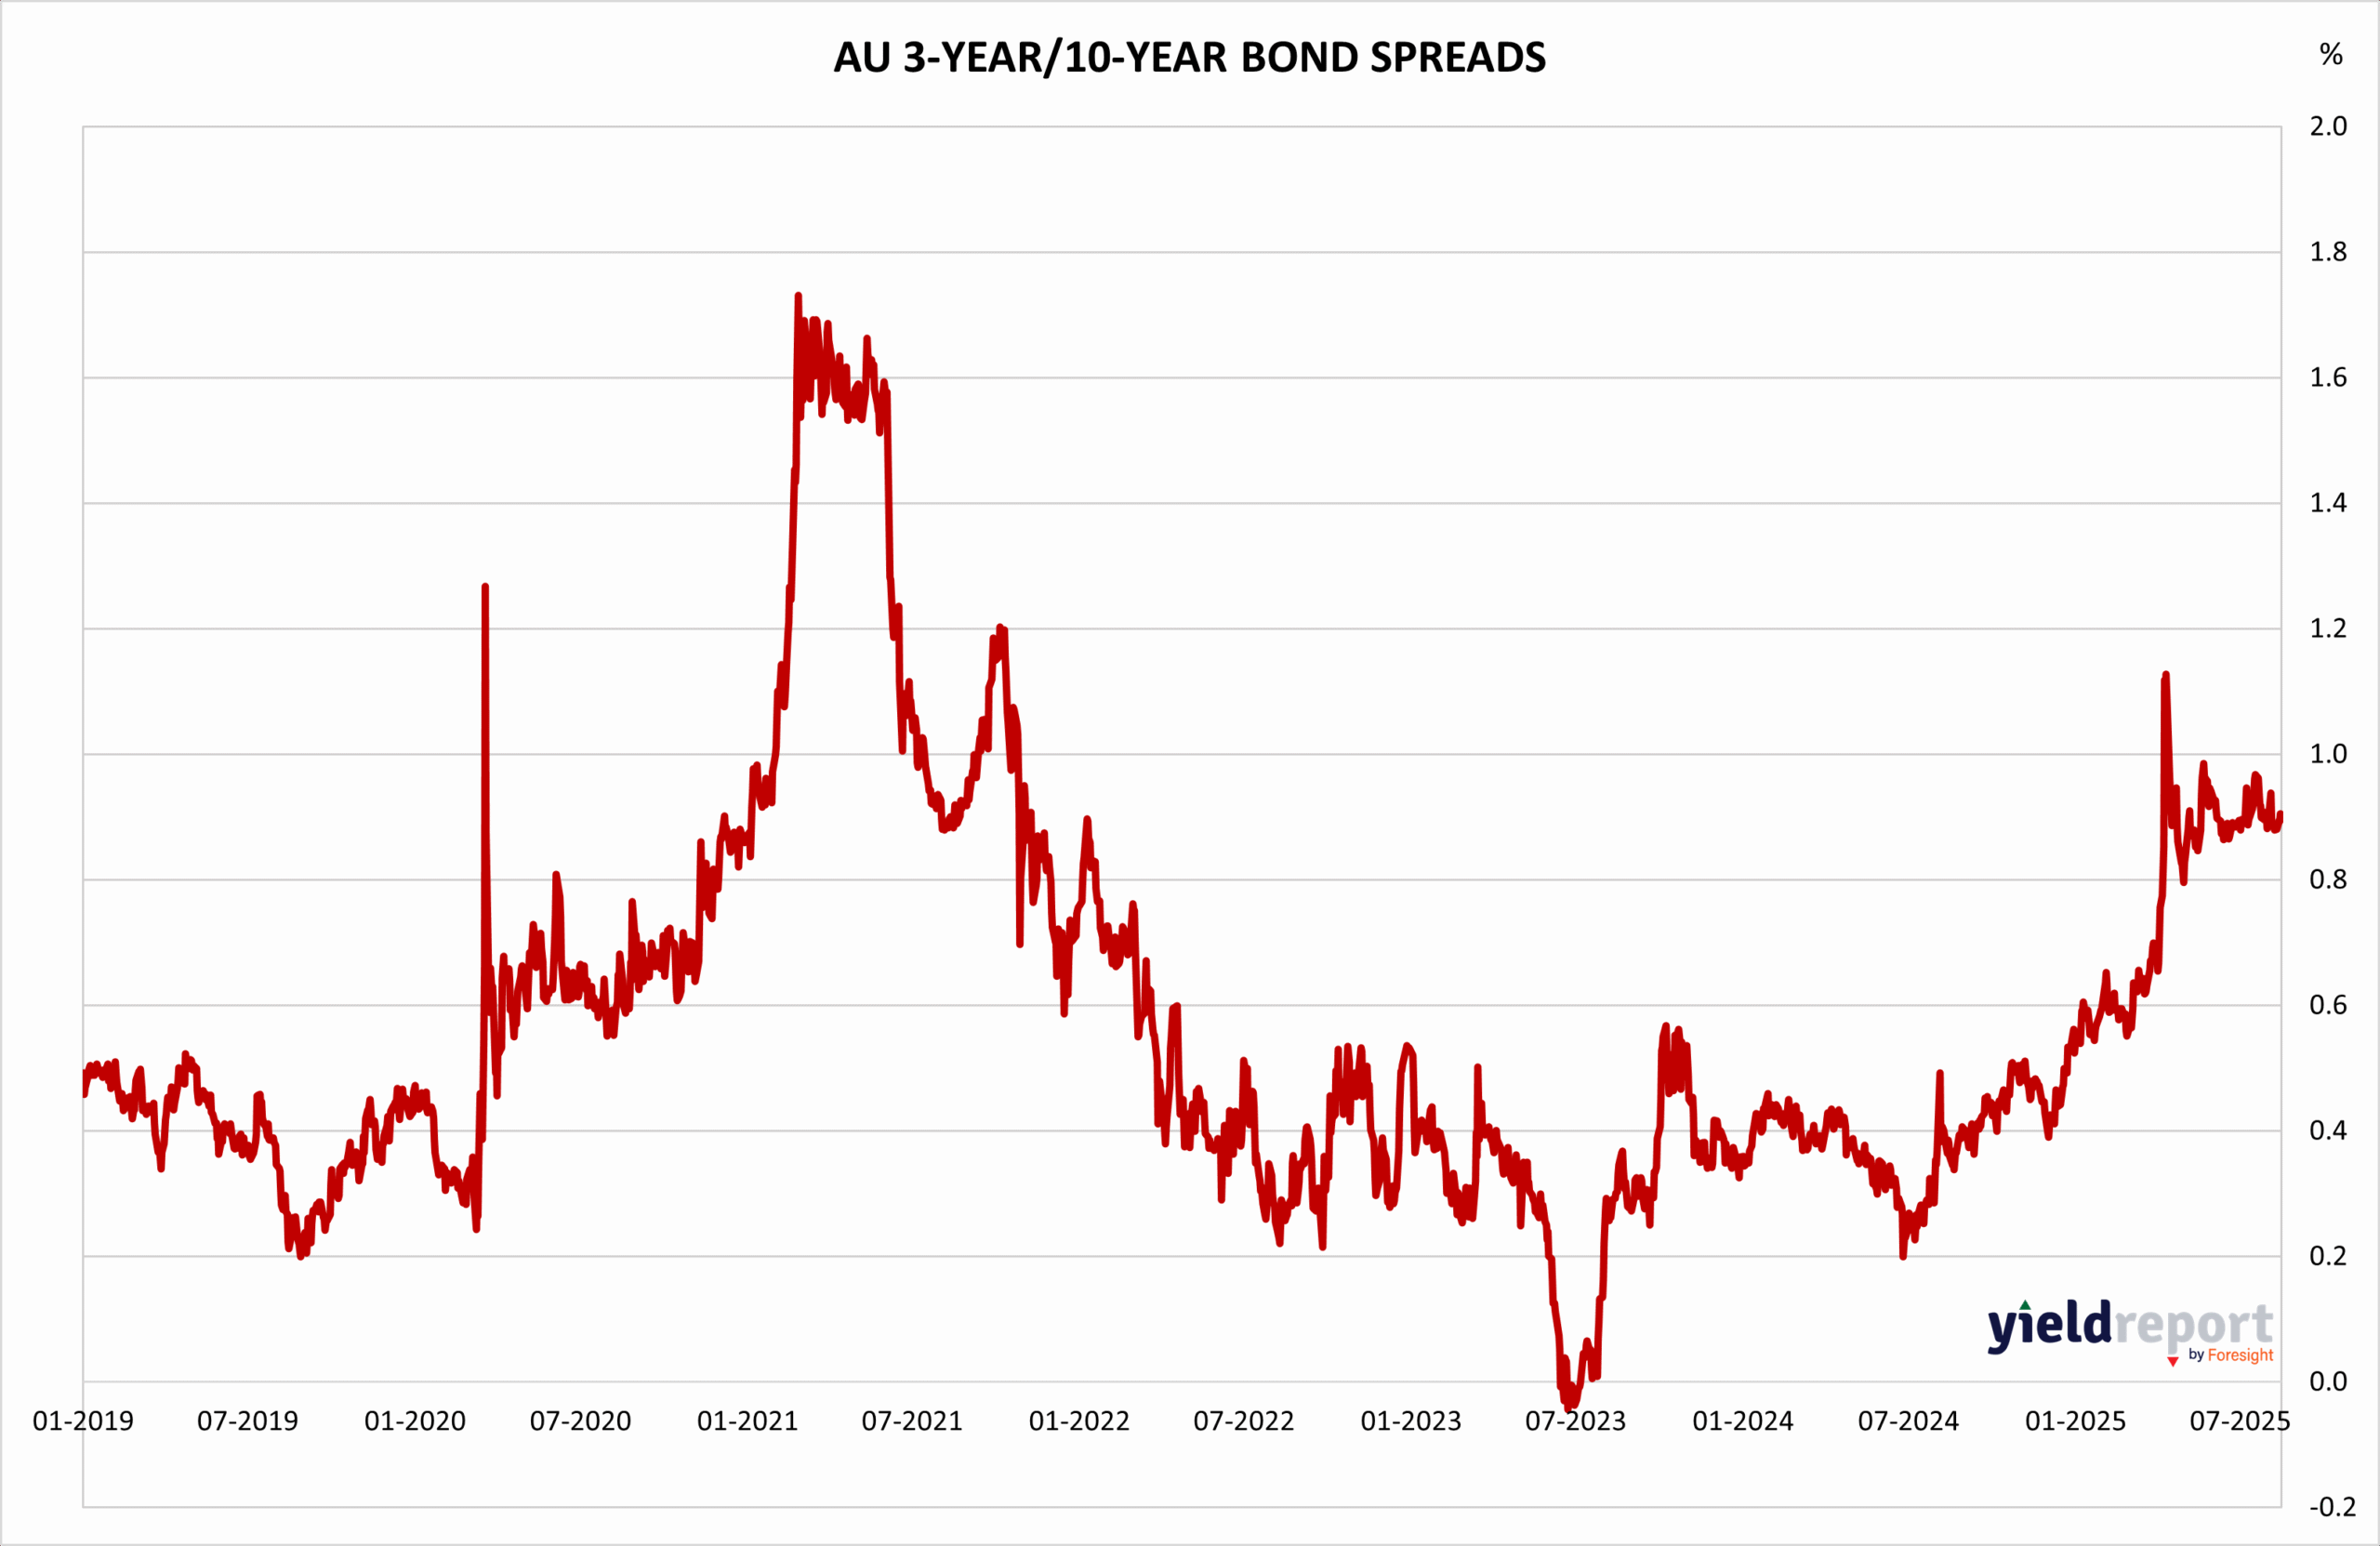
The Australian yield curve has exhibited a relatively stable structure over the past six years, with notable cyclical shifts:
- Mid-2021 Peak: The spread surged above 1.6%, reflecting strong economic recovery expectations and a steepening curve amid global reflation themes.
- 2022–2023 Compression: The spread narrowed significantly, oscillating between 0.2% and 0.8%, suggesting a more cautious outlook and tighter monetary conditions.
- 2023–2025 Gradual Re-steepening: The upward trend toward 0.8% implies a return of long-term growth optimism, possibly driven by easing inflation pressures and stabilizing rate expectations.
This trajectory suggests that while short-term rate hikes have tempered earlier exuberance, the medium-term outlook remains constructive, with investors pricing in a soft landing rather than recession.
Figure 1: Australia 3 and 10-year Bond Yield Spread
United States – US 2-Year/10-Year Bond Spread The U.S. yield curve has been markedly more volatile, with multiple inversions signaling heightened recession risk:
- 2019 & 2022 Inversions: The spread dipped below zero, reaching lows near -1.0%, historically a strong predictor of economic downturns.
- 2023 Recovery Attempt: While the curve began to normalize, it remained below historical averages, reflecting persistent uncertainty around Fed policy and growth resilience.
The deep and prolonged inversion underscores investor skepticism about the sustainability of short-term rate hikes and concerns over lagging economic indicators. Unlike Australia, the U.S. curve reflects a more defensive stance, with markets anticipating potential rate cuts or stagnation.
Figure 2: US 2 and 10-year Bond Spread

To learn more about yield curves and their predictive power, visit this article or this one.