
Summary:
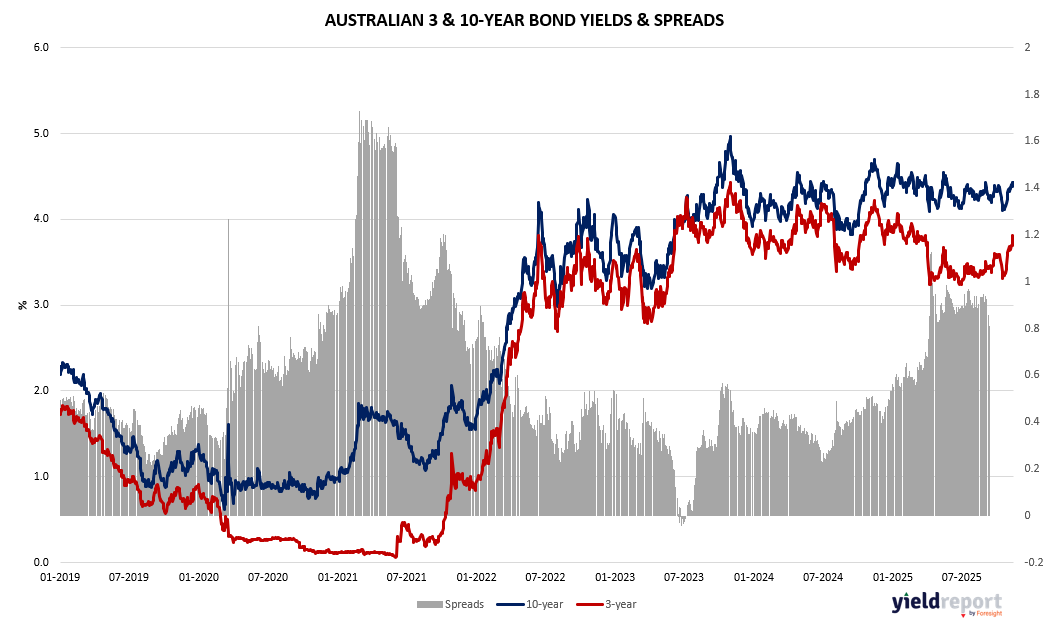
Australian Yield Curve (3-Year vs 10-Year)
- 2020–2021 anchoring: The 3‑year was pinned near zero (reflecting earlier policy settings), while the 10‑year moved higher as reopening progressed, leaving a firmly positive curve.
- 2022 compression: As the RBA shifted course, the 3‑year repriced aggressively, briefly flattening the curve toward zero.
- 2023–2025 re‑steepening: Both tenors rose, but the 10‑year outpaced the 3‑year over the past year, with the spread settling in the +0.7 to +1.0% range on the chart.
- Interpretation: A positive slope with elevated absolute yields points to a late‑cycle mix: front‑end rates reflecting a plateauing policy stance or eventual easing, while the long end embeds term premium, supply considerations, and medium‑term inflation risks.
Figure 1: Australia 3 and 10-year Bond Yield Spread
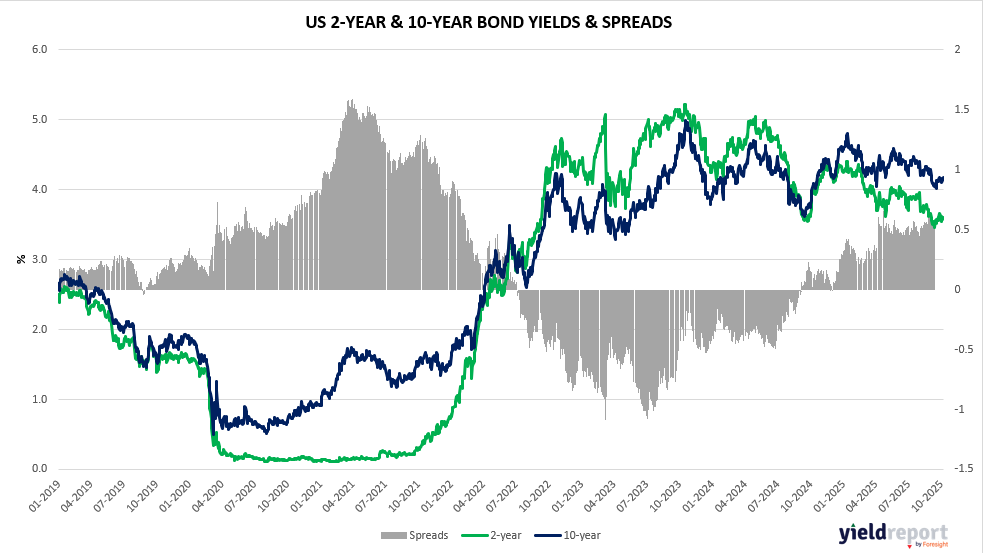
US Yield Curve (2-Year vs 10-Year)
- From 2019 to mid‑2021: The pandemic shock drove both yields sharply lower. The 2‑year anchored near zero while the 10‑year recovered gradually, keeping the curve positively sloped.
- 2022–2023 tightening: A rapid repricing of policy lifted the 2‑year above the 10‑year and pushed the 2s–10s spread to a deep inversion, with the trough near –1% at the peak of front‑end stress.
- 2024–2025 normalisation: Front‑end yields retraced from their highs as markets priced slower inflation and eventual policy easing. The 10‑year eased less—held up by term premium, Treasury supply, and lingering inflation uncertainty—so the curve moved from inverted to slightly positive (roughly +0.5–0.7% on the chart).
- Interpretation: Historically, steepening after a prolonged inversion often occurs ahead of or alongside policy rate cuts and a cooling growth impulse. Today’s mild positive slope suggests the hiking cycle’s impact is maturing, but the long end’s resilience implies investors still demand compensation for duration, supply, and inflation risks.
Figure 2: US 2 and 10-year Bond Spread
To learn more about yield curves and their predictive power, visit this article or this one.