JCB find the YieldReport to be an invaluable summary of all debt market activity. Whilst we are focussed on the highest grade bonds it is important to see what is..Angus Coote, Executive Director, JCB Active Bond Fund
Australian and US Yield Curves Signal Shift Toward Easing Cycle
The Australian and US yield curves continue to reflect expectations of interest rate cuts in 2025, as inflation moderates and growth momentum slows.
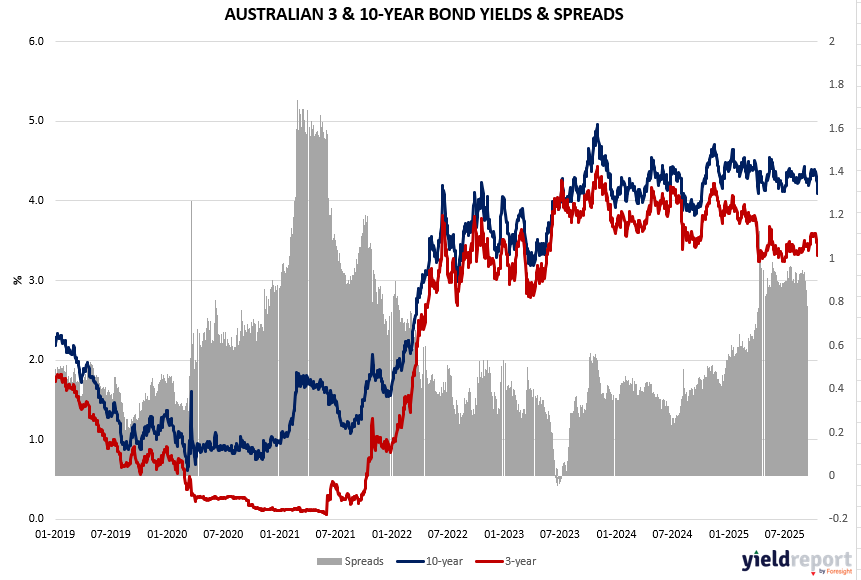
In Australia, both 3-year and 10-year government bond yields have eased from their mid-2023 highs. The yield spread has narrowed but remains positive, suggesting that while markets expect rate reductions ahead, longer-term yields still carry a modest term premium. This indicates a cautious transition from a tightening stance toward a potential easing phase by the RBA.
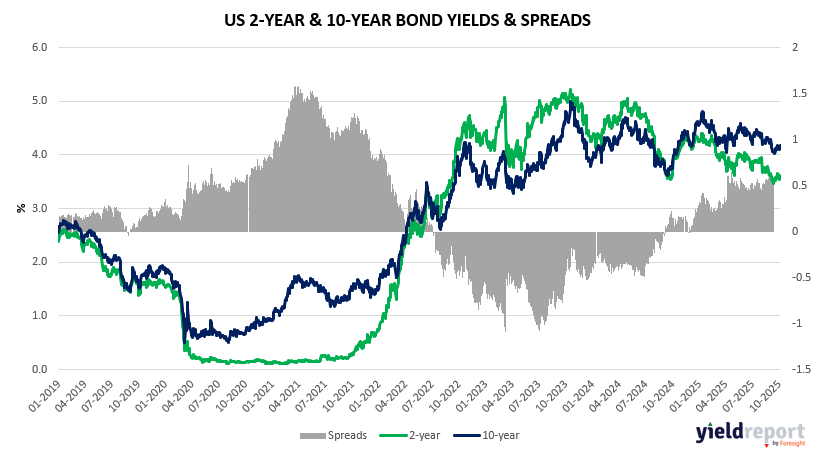
In the US, the 2-year and 10-year yield curve remains inverted but has begun to steepen slightly as the Federal Reserve approaches a likely policy pivot. The sharper decline in 2-year yields points to growing confidence that the next move will be downward in rates.
Overall, bond markets in both regions are signalling the end of the tightening cycle. Investors are positioning for a lower-rate environment in 2025, with yield curve movements suggesting confidence in moderating inflation and a gradual return to policy normalisation.
Figure 1: Australia 3 and 10-year Bond Yield Spread
Figure 2: US 2 and 10-year Bond Spread
To learn more about yield curves and their predictive power, visit this article or this one.